Solutions for 02402 exam 15. December 20111
Solutions for 02402 exam 15. December 20111
Solutions for 02402 exam 15. December 20111
- No tags were found...

Create successful ePaper yourself
Turn your PDF publications into a flip-book with our unique Google optimized e-Paper software.
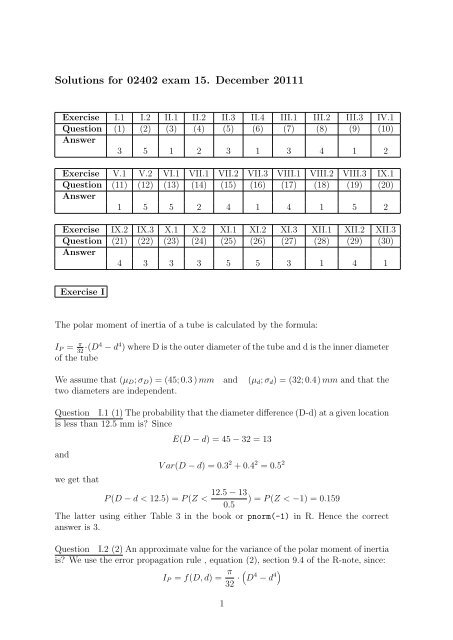
<strong>Solutions</strong> <strong>for</strong> <strong>02402</strong> <strong>exam</strong> <strong>15.</strong> <strong>December</strong> <strong>20111</strong>Exercise I.1 I.2 II.1 II.2 II.3 II.4 III.1 III.2 III.3 IV.1Question (1) (2) (3) (4) (5) (6) (7) (8) (9) (10)Answer3 5 1 2 3 1 3 4 1 2Exercise V.1 V.2 VI.1 VII.1 VII.2 VII.3 VIII.1 VIII.2 VIII.3 IX.1Question (11) (12) (13) (14) (15) (16) (17) (18) (19) (20)Answer1 5 5 2 4 1 4 1 5 2Exercise IX.2 IX.3 X.1 X.2 XI.1 XI.2 XI.3 XII.1 XII.2 XII.3Question (21) (22) (23) (24) (25) (26) (27) (28) (29) (30)Answer4 3 3 3 5 5 3 1 4 1Exercise IThe polar moment of inertia of a tube is calculated by the <strong>for</strong>mula:I P = π 32 ·(D4 − d 4 ) where D is the outer diameter of the tube and d is the inner diameterof the tubeWe assume that (µ D ; σ D ) = (45; 0.3 ) mm and (µ d ; σ d ) = (32; 0.4) mm and that thetwo diameters are independent.Question I.1 (1) The probability that the diameter difference (D-d) at a given locationis less than 12.5 mm is? SinceandE(D − d) = 45 − 32 = 13V ar(D − d) = 0.3 2 + 0.4 2 = 0.5 2we get that12.5 − 13P (D − d < 12.5) = P (Z < ) = P (Z < −1) = 0.1590.5The latter using either Table 3 in the book or pnorm(-1) in R. Hence the correctanswer is 3.Question I.2 (2) An approximate value <strong>for</strong> the variance of the polar moment of inertiais? We use the error propagation rule , equation (2), section 9.4 of the R-note, since:I P = f(D, d) = π 32 · (D 4 − d 4)1
so:∂f∂D = π 8 · D3and∂f∂d = −π 8 · d3and hence: (according to error propagation rule)and hence the correct answer is 5.Exercise IIV ar(I p ) ≈( π8 · D3 ) 2· σ2D +( π8 · d3 ) 2· σ2dA strength calculation on an old tube in a construction is to be per<strong>for</strong>med. Because ofcorrosion and age diameters are quite ’indeterminate’. There<strong>for</strong>e several measurementsare made of as well outer as inner diameter. The measurements of outer respectivelyinner diameter are independent of each other. The results are listed below: (all dimensionsin mm)Outer diameter, x: 44.9, 44.2 , 44.6, 44.8 , 44.0, 45.1Inner diameter, y: 32.4, 32.5, 31.5, 32.2, 32.6, 31.7From the data we get:(¯x; s x ) = (44.6; 0.424) mm and (ȳ; s y ) = (32.15; 0.451) mmQuestion II.1 (3) The outer diameter of the tube is as new 45 mm. The followingtest is per<strong>for</strong>med:H 0 : µ x = 45H 1 : µ x < 45At a 5% level of significance the result of this study is? (As well conclusion as argumentmust be correct) The t-statistic becomes:t =44.6 − 450.424/6 = −2.31and using a t-distribution with df=5 the P-value becomesP (t ≤ −2.31) = 0.0345found in R by pt(-2.31,5). Using Table 4 of the book it would be found that theP-value is between 0.025 and 0.05. If the data was put into R, the result could also befound as:2
x=c(44.9,44.2,44.6,44.8,44,45.1)>t.test(x,mu=45,alt="less")One Sample t-testdata: xt = -2.3094, df = 5, p-value = 0.03448alternative hypothesis: true mean is less than 4595 percent confidence interval:-Inf 44.94902sample estimates:mean of x44.6Anyway, answer 1 is clearly the correct answer: The outer diameter is significantlysmaller than the original, since the P-value is approximately 0.035Question II.2 (4) The original diameter difference is 13 mm. It is assumed that σ x =σ y . The t-statistic <strong>for</strong> the test of the null hypothesis H 0 : µ x − µ y = 13 mm becomes?t =44.6 − 32.15 − 13√s2p (1/6 + 1/6)=44.6 − 32.15 − 13√0.1916 · (1/6 + 1/6) = −2.18sinceOr in R:s 2 p = (s 2 D + s 2 d)/2 = 0.1916> x=c(44.9,44.2,44.6,44.8,44,45.1)> y=c(32.4,32.5,31.5,32.2,32.6,31.7)> t.test(x,y,mu=13,var.equal=TRUE)Two Sample t-testdata: x and yt = -2.1769, df = 10, p-value = 0.05453alternative hypothesis: true difference in means is not equal to 1395 percent confidence interval:11.88705 13.01295sample estimates:mean of x mean of y44.60 32.15So correct answer: 2.3
Question II.3 (5) We want to test the hypothesis σx 2 = σy 2 against the 2-sided alternative.If a significance level of 10% is used the test statistic and critical value <strong>for</strong> thistest are? We use the book section 9.3, pages 272-273:F = s2 ys 2 x= 0.2030.18 = 1.13The 2-sided 10% critical value is F 0.05 with (5, 5) degrees of freedom is 5.05 to be foundin R as qf(0.95,5,5) or in Table 6(a). Hence the correct answer is 3: Test statistic:1.13, critical value: 5.05.Question II.4 (6) Assume that the variance of the measurements on the outer diameteris σ x = 0.43. A new study is planned in which the outer diameter should bedetermined with an accuracy corresponding to a 95% confidence interval of size ± 0.1.What number of measurements, n is required? We use the sample size <strong>for</strong>mula onpage 208 with α = 0.05, σ = 0.43 and E = 0.1, so the correct answer is 1: Around(1.96 · 0.43/0.1) 2 ≈ 71Exercise IIIA company has outsourced the manufacturing of a gasket <strong>for</strong> one of their valves to acompany in China. The gaskets are received in very large lots (with many thousandsof gaskets). The company controls a batch by sampling 200 gaskets at random fromthe lot, these are classified as defective or intact. A lot is accepted if there are at most2 defective item among the controlled ones.Question III.1 (7) What is the approximate probability of accepting a lot if the percentageof defectives is 0.4%?P (Accepting a lot) = P (X ≤ 2)where X follows a binomial with n = 200 and p = 0.004. Hence the correct answeris 3: P (X ≤ 2) = 95%. (Most likely in reality the sampling will be done WITHOUTreplacement - and hence the proper distribution would have been the Hypergeometricdistribution, BUT we are only told that the total amount of lots N out of which wesample the n = 200 is a large number - many thousands - NOT what it is - which wewould have needed to use the Hypergeometric distribution. And we are saved by thefact that in such cases where n ≤ N/10, the binomial is a good approximation of thehypergeometric (page 90-91).Question III.2 (8) Out of 2000 tested gaskets, a total of 14 was defective. The Chinesecompany guarantees that the error rate is not more than 0.4%, so the followinghypothesis test is per<strong>for</strong>med:H 0 : p = 0.004H 1 : p > 0.0044
On a 5% significance level only one of the following options can be a critical value <strong>for</strong>a ”large sample” test of this hypothesis. Which one? We would use the test statisticgiven in page 284:14 − 2000 · 0.004Z = √ = 2.132000 · 0.004 · 0.996But actually we only need the one-sided critical value from the standard normal (Z)distribution to answer the question, and hence the correct answer is 4: z 0.05 = 1.645Question III.3 (9) We repeat the setup from the previous question: (hence one doesnot need to look at that again). Out of 2000 tested gaskets, a total of 14 was defective.The Chinese company guarantees that the error rate is not more than 0.4%, so thefollowing hypothesis test is per<strong>for</strong>med:H 0 : p = 0.004H 1 : p > 0.004The P-value <strong>for</strong> this test can be found using the binomial distribution as follows? (Xis now the number of defective out of 2000). Instead of using the (large sample) Z-testas in the previous question, we are now asked to consider the (exact) binomial basedP-value probability computation. Since a P-value is the probability of observing whatwe’ve seen or something more extreme it becomes:P − value = P (X ≥ 14) = 1 − P (X ≤ 13)where X follows a binomial with n = 2000 and p = 0.004. In R this number canbe found directly as 1-pbinom(13,2000,0.004) to achieve 0.03388445 and hence thecorrect answer is 1: P (X ≥ 14) = 0.034. (Without using R, answer option 2 canbe excluded either by noting that the binomial in question has mean np = 8, so theprobability of going beyond 13 could NOT be as large as 0.999, OR in more detail toapply the normal approximation of the binomial that would say the same thing)Exercise IVThe arrival of guests wishing to check into a hotel is assumed in the period between 14(2pm) and 18 (6 pm) o’clock to be described by a poisson proces (arrivals are assumedevenly distributed over time and independent of each other). From extensive previousmeasurements it has been found that the probability that no guests arrive in a periodof 15 minutes is 0.30. (P (X = 0) = 0.30, where X describes the number of arrivals per15 min).Question IV.1 (10) The expected number of arrivals per 15 min, and the probabilitythat in a period of 1 hour 8 guests or more arrive are? First we need to find theintensity λ 15min of the poisson distribution <strong>for</strong> X - we use the general expression <strong>for</strong>getting zero events in a poisson:P (X = 0) = λ0 15mine −λ 15min0!= e −λ 15min5
And since this is 0.3 we can findλ 15min = − log(0.3) = 1.2Since µ = λ in a poisson (page 106) this number also expresses the expected(average)number of arrivals during 15 minutes. The second part we find by finding the intensity(average) <strong>for</strong> a 60 minutes period:And hence:λ 60min = 4 · λ 15min = 4.8P (X ≥ 8) = 1 − P (X ≤ 7) = 1 − 0.887 = 0.113found in Table 4. Also to be found in R as 1-ppois(7,4.8). Henc the correct answeris 2: µ = 1.2 arrivals per 15 min and P (X 60min ≥ 8) ≈ 11%Exercise VOn a shelf 9 apparently identical ring binders are postioned. It is known that 2 of thering binders contain statistics exercises, 3 of the ring binders contain math problems and4 of ring binders contain reports. Three ring binders are sampled without replacement.Question V.1 (11) The random variable X describes the number of ring binders withstatistics exercises among the 3 chosen ones. The mean and variance <strong>for</strong> the randomvariable X is? This is a Hypergeometric distribution with a = 2, N = 9, n = 3. Themean and variance of this distribution is given on page 96 and page 98:µ = n · aN = 3 · 29 = 2 3σ 2 = n · aN (1 − a N )(N − nN − 1 ) = 3 · 29 (7 9 )(9 − 39 − 1 ) = 7 18Hence the correct answer is 1: µ ≈ 0.67 and σ 2 ≈ 0.39Question V.2 (12) The probability (P 1 ) that all the three chosen ring binders containreports and the probability (P 2 ) to chose exactly one of each kind of ring binder are?Since there are a = 4 that contain reports (and 5 that don’t) we use this hypergeometricdistribution (Y ) to find P 1 : (page 81)(43) (50)P 1 = P (Y = 3) =) = 1 21(93For P 2 we use the same principle as <strong>for</strong> the hypergeometric - the basic probabilityapproach - the denominator counts the total number of possibilities - the numerator6
counts the ones corresponding to the event in question. And <strong>for</strong> the latter one of eachhas to be chosen:( ) ( ) ( )2 3 41 1 1P 2 =) = 6 21(93Hence the correct answer is 5.Exercise VIIn a store chain with separate bakery departments it is required, that the breads in allthe chain’s bakery shops are reasonably homogeneous. For the weight of a given breadthe following requirements are specified:1% of the breads are allowed to weigh below 600 g.5% of the breads are allowed to weigh above 650 g.Data are assumed to follow a normal distributionQuestion VI.1 (13) The mean and standard deviation (µ, σ) to be used <strong>for</strong> the productionto meet these requirements are? First we find the relevant percentiles of thestandard normal (Z) distribution:P (Z < z 0.99 ) = 0.01 and P (Z > z 0.05 ) = 0.05Hence these values can be found from R as qnorm(0.01) and qnorm(0.95) or in Table3:z 0.99 = −2.326 and z 0.05 = 1.645We need to find the µ and the σ that will give the same probabilities in a non-standardnormal X, so we can use the basic standardization <strong>for</strong>mula Z = X−µ twice and solveσ2 equations with two unknowns:−2.326 = x 0.99 − µand 1.645 = x 0.05 − µσσthat is:−2.326 = 600 − µ and 1.645 = 650 − µσσThe solutions is the one given as answer 5: µ = 629.3g and σ = 12.6gExercise VIIFour medical drugs with the same active ingredient are compared in terms of sideeffects. 200 persons participate in a study where the side effects <strong>for</strong> the individualperson is categorized as none / light / serious. The results of the investigation isshown in the table below:7
Medical drug SumA B C DNo side effects 5 3 10 2 20Light side effects 32 32 21 40 125Serious side effects 13 15 19 8 55Sum 50 50 50 50 200Question VII.1 (14) If the entire data material is used a 95% confidence interval<strong>for</strong> the proportion of serious side effects becomes? The large sample <strong>for</strong>mula <strong>for</strong> aconfidence interval page 280 is used with x = 55 (observed number of serious sideeffects) and n = 200 (total number of observations): (55/200 = 0.275)55 √200 ± 1.96 0.275(1 − 0.275)/200which gives answer 2: 0.213 < p serious < 0.337Question VII.2 (15) If the wish is to investigate whether there is a relation betweenthe occurence of side effects and drug type, a test must be per<strong>for</strong>med <strong>for</strong> which theχ 2 -value and number of degrees of freedom (f) is? This is an r × c table as in section10.4 (page 292-295) with c = 4 and r = 3. Hence the degrees of freedom is 3 · 2 = 6and only in answer 4 the right version of the χ 2 − statistic is given where the expectedvalues are put in the denominators - NOT the observed values as in answer 1. Theexpected number <strong>for</strong> e.g. the number of no side effects <strong>for</strong> drug B (observed o 12 = 3)would be:20 · 50e 12 = = 5200So: The correct answer is 4:χ 2 = (5−5)2 + (3−5)2 + (10−5)2 + (2−5)2 + (32−31.25)2 + (32−31.25)2 + (21−31.25)2 + (40−31.25)25 5 5 5 31.25 31.25 31.25 31.25+ (13−13.75)2 + (15−13.75)2 + (19−13.75)2 + (8−13.75)2 and f = 613.75 13.75 13.75 13.75Question VII.3 (16) Apart from the overall test, an investigation is wanted to testthe hypothesis that the proportion of serious side effects is significantly lower <strong>for</strong> drugD than <strong>for</strong> the others. Hence, the following hypothesis test is per<strong>for</strong>med:H 0 : p D = p othersH 1 : p D < p othersThe test statistic and P-value <strong>for</strong> this hypothesis test are? We use the test <strong>for</strong> thedifference of two proportions (page 288 at the bottom) with x 1 = 8, n 1 = 50 , x 2 = 47and n 2 = 150 (and hence ˆp = 55/200 = 0.275 :Z =8− 4750 150√0.275(1 − 0.275)(150 + 1150 ) = −2.10And the P-value is found from Table 3 as P (Z ≤ −2.10)) or in R by pnorm(-2.10)(since it is a one-sided test only the left side is used). So the correct answer is 1:Z = −2.10 and P-value = 0.0188
Exercise VIIIFive different brands of tablets with the same active compound are compared withrespect to their solubility. For each brand four tablets were investigated. For eachtablet, percent solubility is measured after the tablet have been kept in 1000 ml deionizedwater <strong>for</strong> a while. The following data are found:BrandA B C D E39 36 48 60 30%solubility 43 37 46 65 3238 37 43 62 3935 35 41 67 31In the following table <strong>for</strong> a usual oneway analysis of variance, some of the results areshown. Further, the means <strong>for</strong> the brands are given.(It can be assumed that the data follows a normal distribution with the same variancein each group)The means of the five brands are:DF Sums of Mean FSquares SquareBrand x w 585.925 61.2465Error y 143.50 9.567Total z 2487.20Brand Number MeanA 4 38.75B 4 36.25C 4 44.50D 4 63.50E 4 33.00Question VIII.1 (17) The values <strong>for</strong> x, y, z and w are? As this is a one-way ANOVAas in chapter 12, section 2 with k = 5 and N = 20, we know that x = k − 1 = 5 − 1 = 4and y = N − k = 20 − 5 = 15 and z = N − 1 = 19 (page 362). We also know thatSS(Tr)=SST-SSE and hencew = SS(T r) = 2487.20 − 143.50 = 2343.7So the correct answer is 4:x = 4 , y = 15 , z = 19 and w = 2343.7Question VIII.2 (18) The result of the hypothesis test of no difference in mean solubility<strong>for</strong> the five brands is? (Both conclusion and argument must be correct) First9
we find the P-value <strong>for</strong> the F-test. We can look in Table 6(b) with numerator DF as4 and denominator DF as 15 to see that the P-value is (much) lower than 0.01, sinceF = 61.2465 is much higher than 4.17 from the table. In R the P-value could be foundas 1-pf(61.2465,4,15) with the result: 4.1237e-09. Hence the correct answer is 1:At least one mean value is different from one of the others since the P-value is ≈0Question VIII.3 (19) The 99% confidence interval <strong>for</strong> µ A −µ B is? We use the approachfrom page 266:38.75 − 36.25 ± t 0.005√9.567( 1 4 + 1 4 )that is, using 15 degrees of freedom <strong>for</strong> the t:38.75 − 36.25 ± 2.947The correct answer then becomes 5: 2.5 ± 6.44Exercise IX√9.567( 1 4 + 1 4 )Two different brands of tablets with the same active compound are compared withrespect to their solubility. For each of the two brands 10 tablets were investigated. Foreach tablet, percent solubility is measured after the tablet have been kept in 1000 mlde-ionized water <strong>for</strong> a while. One measurement failed, so the following values <strong>for</strong> %solubility were found:Brand F 45 47 48 49 49 50 52 52 53 54Brand G 48 48 49 49 52 54 54 55 55Question IX.1 (20) What are the following five numbers <strong>for</strong> Brand G: 0%-percentile,lower quartile Q 1 , median, upper quartile Q 3 , and 100%-percentile? With n = 9 wecould use the procedure given in page 30 a number of times. However, since the medianof these 9 numbers is the middle number, that is 52, the only possible correct answeris 2: 48, 49, 52, 54, 55. (And we don’t have to think about how to define the 0% and100% percentiles - which simply are defined as the minimum and maximum values)Question IX.2 (21) A 99% confidence interval <strong>for</strong> the difference between the twomeans, which is not based on an assumption about normality of the data, is wanted.The following R lines are run:x=c(45,47,48,49,49,50,52,52,53,54)y=c(48,48,49,49,52,54,54,55,55)k = 10000xsamples = replicate(k, sample (x, replace = TRUE))ysamples = replicate(k, sample (y, replace = TRUE))mymeandifs = apply(xsamples, 2, mean)-apply(ysamples, 2, mean)myquantiles=quantile(mymeandifs, c(0.005,0.01,0.025,0.05,0.25,0.5,0.75,0.95,0.975,0.99,0.995))round(myquantiles,2)10
The result, which then is the rounded (the R-function round is in the last line appliedto round to two decimal points) percentiles of the bootstrap distribution of differencesof means:0.5% 1% 2.5% 5% 25% 50% 75% 95% 97.5% 99% 99.5%-4.93 -4.64 -4.14 -3.79 -2.54 -1.67 -0.80 0.40 0.83 1.29 1.52The 99% confidence interval <strong>for</strong> the difference between the two means based on thisis? We use Section 9.5.2 in the R-note - telling us that we need to read off the 0.5%and 99.5% percentiles of the bootstrapped difference values. Hence the correct answeris 4: [−4.93, 1.52] (Note that if these computations are re-done in R, the results willnot be exactly the same due to simulation uncertainty)Question IX.3 (22) We want to test the following hypothesis on level α = 0.05 basedon the in<strong>for</strong>mation in the previous question:H 0 : µ F − µ G = −4H 1 : µ F − µ G < −4What is the conclusion and the most correct argument? We use Section 9.6.4 in theR-note - doing bootstrap based hypothesis testing <strong>for</strong> the 2-sample situation. We cansee that less then 5% of the bootstrap difference values are below −4 (since the 5%percentile is −3.79. Hence answer 3 is the correct one: The hypothesis is rejected sincethe P-value is less than 5%Exercise XIt is known that the quotient between surface ares and volume has an influence on howfast a tablet is dissolved. To investigate this the following data was collected:%dissolved(y)Surface area/Volume(mm 2 /mm 3 ) (x)0.60 0.75 0.90 1.05 1.5033.00 36.25 38.75 44.50 63.50In R the following has been run:x=c(0.6,.75,0.9,1.05,1.5)y=c(33,36.25,38.75,44.50,63.5)summary(lm(y~x))with the following result:Call:11
lm(<strong>for</strong>mula = y ~ x)Residuals:1 2 3 4 52.2358 0.3042 -2.3774 -1.8090 1.6462Coefficients:Estimate Std. Error t value Pr(>|t|)(Intercept) 10.038 3.448 2.911 0.06193 .x 34.544 3.419 10.104 0.00206 **---Signif. codes: 0 *** 0.001 ** 0.01 * 0.05 . 0.1 1Residual standard error: 2.361 on 3 degrees of freedomMultiple R-squared: 0.9715, Adjusted R-squared: 0.9619F-statistic: 102.1 on 1 and 3 DF, p-value: 0.002065Question X.1 (23) A 95% confidence interval <strong>for</strong> the slope in the model behind theanalysis is? We use that we can read off the standard error of the slope in the R-output:(cf. page 311 in the book and the R-note)SE b = 3.419 = s e ·1√SXXSo to apply the confidence limit <strong>for</strong>mula from page 311, we just need to finde the propert-percentile, t 0.025 with 5 − 2 = 3 degrees of freedom:t 0.025 (3) = 3.182In R: qt(0.975,3). So the correct answer is 3: 34.544 ± 3.182 · 3.419Question X.2 (24) For a random tablet of some other brand, where the surface area/volume= 1.25 mm 2 /mm 3 it is found that % dissovled= 47. Is this in correspondance with thegiven model? Since we ”predict” the value <strong>for</strong> a single new observation we should usethe prediction interval, page 314, (and NOT the confidence interval) with x 0 = 1.25.And only in answer 3 the correct prediction interval is given, So the correct answer is3: Yes, since the prediction interval 53.218±3.182·2.361·√1 + 1 + (1.25−0.96)2 contains5 0.477the valueExercise XIA company works with a 3-shift operation, that is, it is running 24 hours with 3 differentshifts of people working 8 hours. It is expected that the ’down time’ on the machinesis higher on evening and night shifts than it is on day shifts. In order to verify this the’downtime’ is registered on four machines of the same type in a period of time. Themeasured data is shown in the table below. The observations are listed as ’down time’in hours in the given period of time:12
Machine AverageI II III IVDay shift 30 35 59 38 40.5Evening shift 58 55 64 49 56.5Night shift 80 54 72 63 67.25Average 56.0 48.0 65.0 50.0 54.75We assume that the data follows a normal distribution.Below, the ANOVA table <strong>for</strong> the problem is given as it was produced by R. However,some of the numbers are substituted by letters: (In addition, the following in<strong>for</strong>mationcan be used: The ”total sums of squares”, SST , equals 2434.25)Analysis of Variance TableResponse: yDf Sum Sq Mean Sq F value Pr(>F)shift 2 1449.50 724.75 9.4430 Dmachine 3 524.25 174.75 2.2769 EResiduals A B CQuestion XI.1 (25) What is A, B and C? This is a two-way ANOVA situation as in12.3 in the book page 371-373 with a = 3 and b = 4 (OR a = 4 and b = 3) Thetable can be looked at/compared with the generic table on page 373. A is the residualdegrees of freedom. In any way the residual degrees of freedom is (a − 1)(b − 1) = 6.B is the residual SS, that can be found as: (page 372)SSE = SST − SS(T r) − SS(Bl) = 2434.25 − 1449.5 − 524.25 = 460.5And finally C is the MSE = A/B = 76.75. So the correct answer is 5: A = 6 , B =460.5 and C = 76.75Question XI.2 (26) The influence of the machines on ’down time’ is studied, a significancelevel of 5% is used. The conclusion and P-value become? (Both conclusion andargument must be correct) We must find the P-value <strong>for</strong> the relevant F-test (that is,E) which is <strong>for</strong> the F = 2.2769 using degrees of freedom (3, 6). From Table 6(a) we cansee that the P-value must be above 0.05. In R it could be found as 1-pf(2.2769,3,6)(=0.18). In any case, the correct answer can only be 5: Machines have no significantinfluence on the result, since the P-value= 0.18Question XI.3 (27) The influence of the shifts on ’down time’ is studied, a significancelevel of 5% is used. The critical value and conclusion become: (Both critical value andconclusion must be correct) We must find the critical value <strong>for</strong> the relevant F-test (thatis, D) which is <strong>for</strong> the F = 9.4430 using degrees of freedom (2, 6). From Table 6(b) wecan see that this value is 5.14. In R it could be found as qf(0.95,2,6). In any case,13
the correct answer can only be 3: F 0.05 (2, 6) = 5.14, shifts have significant influence on’down time’Exercise XIIA fast-food chain uses a biological degradable material <strong>for</strong> packaging their burgers.The thermal conductivity of the material is an important feature. The data in thetable below comes from an experiment where thermal conductivity is measured as afunction of the material density. It is assumed that the relationship can be describedby a simple linear model. The following values are measured:Material density (g/cm 3 ) .175 .220 .225 .226 .250 .277Thermal conductivity (W/mK) .0480 .0525 .0540 .0535 .0570 .0610Some computational statistics:¯x = 0.2288 , ȳ = 0.05433 , S xx = 0.005767, S yy = 0.00009583 and S xy = 0.0007383The following lines were run in R:x=c(.175,.220,.225,.226,.25,.277)y=c(.048,.0525,.054,.0535,.057,.061)summary(lm(y~x))with the following results: (However, two of the values have been substituted by ”A”and ”B”) :Call:lm(<strong>for</strong>mula = y ~ x)Residuals:1 2 3 4 5 65.590e-04 -7.024e-04 1.575e-04 -4.706e-04 -4.332e-05 4.998e-04Coefficients:Estimate Std. Error t value Pr(>|t|)(Intercept) 0.025036 A 14.42 0.000134 ***x 0.128031 B 17.03 6.97e-05 ***---Signif. codes: 0 *** 0.001 ** 0.01 * 0.05 . 0.1 1Residual standard error: 0.0005709 on 4 degrees of freedomMultiple R-squared: 0.9864, Adjusted R-squared: 0.983F-statistic: 290 on 1 and 4 DF, p-value: 6.973e-0514
Question XII.1 (28) The percentage explained variation r 2 and the residual standarddeviation s e are? These two numbers can be read off directly from the R-output ,cf. the Rnote Section 10.1, so the correct answer is 1: Percentage explained variation:98.6%, s e = 0.000571Question XII.2 (29) From the theory of the tested materials the slope of the lineis expected to be β = 0.155. Is this in correspondance with the observed slope, ifa significance level of 5% is used? (Both answer and argument must be correct) Theconclusion of the hypothesis test is in the answers given based on the confidence interval,so we must identify the right confidence interval, cf. book page 311, (<strong>for</strong> β). The degreesof freedom is 6 − 2 = 4, so the t-percentile to use is t 0.025 = 2.776 (Table 4 or in R:qt(0.975,4). So, since S xx = 0.005767, the only correctly specified confidence intervalis given in answer 4, which is the correct answer: (And the answer is ”no” since 0.155is outside of the confidence band that has an upper limit of 0.149)No since a 95% konfidence interval <strong>for</strong> the slope becomes: 0.1280 ± 2.776 ·√ 0.000571 20.005767Question XII.3 (30) A 95% confidence interval <strong>for</strong> the thermal conductivity, if thedensity is 0.200 (g/cm 3 ), becomes? We use here the confidence band <strong>for</strong>mula <strong>for</strong> apoint on the line (box on page 313) with a = 0.025036, b = 0.128031 and x 0 = 0.200.The degrees of freedom is 6 − 2 = 4, so the t-percentile to use is t 0.025 = 2.776 (Table4 or in R: qt(0.975,4). So the only correct use of this <strong>for</strong>mula is given as the correctanswer 1:√1 (0.200 − 0.2288)20.0250356 + 0.128031 · 0.200 ± 2.776 · 0.000571 · +6 0.0057715