Solutions for 02402 exam 15. December 20111
Solutions for 02402 exam 15. December 20111
Solutions for 02402 exam 15. December 20111
- No tags were found...

Create successful ePaper yourself
Turn your PDF publications into a flip-book with our unique Google optimized e-Paper software.
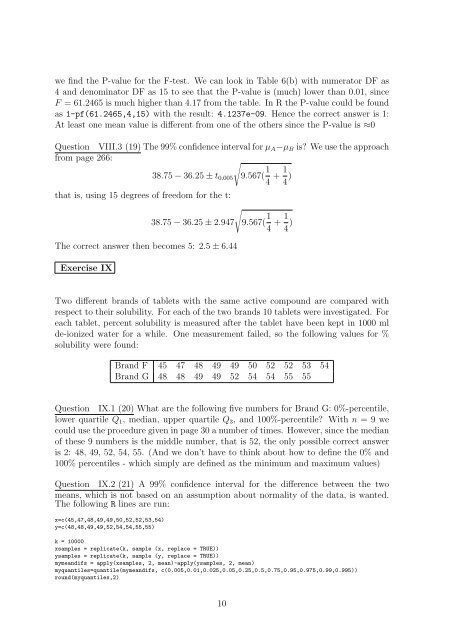
we find the P-value <strong>for</strong> the F-test. We can look in Table 6(b) with numerator DF as4 and denominator DF as 15 to see that the P-value is (much) lower than 0.01, sinceF = 61.2465 is much higher than 4.17 from the table. In R the P-value could be foundas 1-pf(61.2465,4,15) with the result: 4.1237e-09. Hence the correct answer is 1:At least one mean value is different from one of the others since the P-value is ≈0Question VIII.3 (19) The 99% confidence interval <strong>for</strong> µ A −µ B is? We use the approachfrom page 266:38.75 − 36.25 ± t 0.005√9.567( 1 4 + 1 4 )that is, using 15 degrees of freedom <strong>for</strong> the t:38.75 − 36.25 ± 2.947The correct answer then becomes 5: 2.5 ± 6.44Exercise IX√9.567( 1 4 + 1 4 )Two different brands of tablets with the same active compound are compared withrespect to their solubility. For each of the two brands 10 tablets were investigated. Foreach tablet, percent solubility is measured after the tablet have been kept in 1000 mlde-ionized water <strong>for</strong> a while. One measurement failed, so the following values <strong>for</strong> %solubility were found:Brand F 45 47 48 49 49 50 52 52 53 54Brand G 48 48 49 49 52 54 54 55 55Question IX.1 (20) What are the following five numbers <strong>for</strong> Brand G: 0%-percentile,lower quartile Q 1 , median, upper quartile Q 3 , and 100%-percentile? With n = 9 wecould use the procedure given in page 30 a number of times. However, since the medianof these 9 numbers is the middle number, that is 52, the only possible correct answeris 2: 48, 49, 52, 54, 55. (And we don’t have to think about how to define the 0% and100% percentiles - which simply are defined as the minimum and maximum values)Question IX.2 (21) A 99% confidence interval <strong>for</strong> the difference between the twomeans, which is not based on an assumption about normality of the data, is wanted.The following R lines are run:x=c(45,47,48,49,49,50,52,52,53,54)y=c(48,48,49,49,52,54,54,55,55)k = 10000xsamples = replicate(k, sample (x, replace = TRUE))ysamples = replicate(k, sample (y, replace = TRUE))mymeandifs = apply(xsamples, 2, mean)-apply(ysamples, 2, mean)myquantiles=quantile(mymeandifs, c(0.005,0.01,0.025,0.05,0.25,0.5,0.75,0.95,0.975,0.99,0.995))round(myquantiles,2)10