Volume 23 - SST - Sekolah Sains & Teknologi - Universiti Malaysia ...
Volume 23 - SST - Sekolah Sains & Teknologi - Universiti Malaysia ...
Volume 23 - SST - Sekolah Sains & Teknologi - Universiti Malaysia ...
- No tags were found...

Create successful ePaper yourself
Turn your PDF publications into a flip-book with our unique Google optimized e-Paper software.
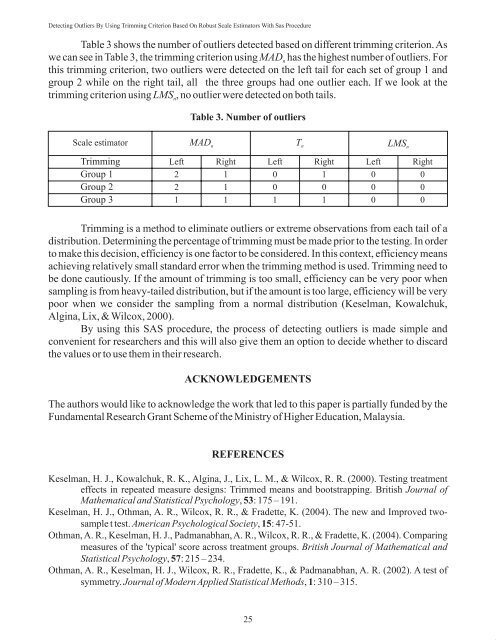
Detecting Outliers By Using Trimming Criterion Based On Robust Scale Estimators With Sas ProcedureTable 3 shows the number of outliers detected based on different trimming criterion.Aswe can see in Table 3, the trimming criterion using MADnhas the highest number of outliers. Forthis trimming criterion, two outliers were detected on the left tail for each set of group 1 andgroup 2 while on the right tail, all the three groups had one outlier each. If we look at thetrimming criterion using LMS , no outlier were detected on both tails.nTable 3. Number of outliersScale estimator MAD nT n LMS nTrimmingGroup 1Group 2Group 3Left221Right111Left001Right101Left000Right000Trimming is a method to eliminate outliers or extreme observations from each tail of adistribution. Determining the percentage of trimming must be made prior to the testing. In orderto make this decision, efficiency is one factor to be considered. In this context, efficiency meansachieving relatively small standard error when the trimming method is used. Trimming need tobe done cautiously. If the amount of trimming is too small, efficiency can be very poor whensampling is from heavy-tailed distribution, but if the amount is too large, efficiency will be verypoor when we consider the sampling from a normal distribution (Keselman, Kowalchuk,Algina, Lix, & Wilcox, 2000).By using this SAS procedure, the process of detecting outliers is made simple andconvenient for researchers and this will also give them an option to decide whether to discardthe values or to use them in their research.ACKNOWLEDGEMENTSThe authors would like to acknowledge the work that led to this paper is partially funded by theFundamental Research Grant Scheme of the Ministry of Higher Education, <strong>Malaysia</strong>.REFERENCESKeselman, H. J., Kowalchuk, R. K., Algina, J., Lix, L. M., & Wilcox, R. R. (2000). Testing treatmenteffects in repeated measure designs: Trimmed means and bootstrapping. British Journal ofMathematical and Statistical Psychology, 53: 175 – 191.Keselman, H. J., Othman, A. R., Wilcox, R. R., & Fradette, K. (2004). The new and Improved twosamplet test. American Psychological Society, 15: 47-51.Othman, A. R., Keselman, H. J., Padmanabhan, A. R., Wilcox, R. R., & Fradette, K. (2004). Comparingmeasures of the 'typical' score across treatment groups. British Journal of Mathematical andStatistical Psychology, 57: 215 – <strong>23</strong>4.Othman, A. R., Keselman, H. J., Wilcox, R. R., Fradette, K., & Padmanabhan, A. R. (2002). A test ofsymmetry. Journal of Modern Applied Statistical Methods, 1: 310 – 315.25