Recent motion of the African plates - Disaster Management Institute ...
Recent motion of the African plates - Disaster Management Institute ...
Recent motion of the African plates - Disaster Management Institute ...
- No tags were found...
You also want an ePaper? Increase the reach of your titles
YUMPU automatically turns print PDFs into web optimized ePapers that Google loves.
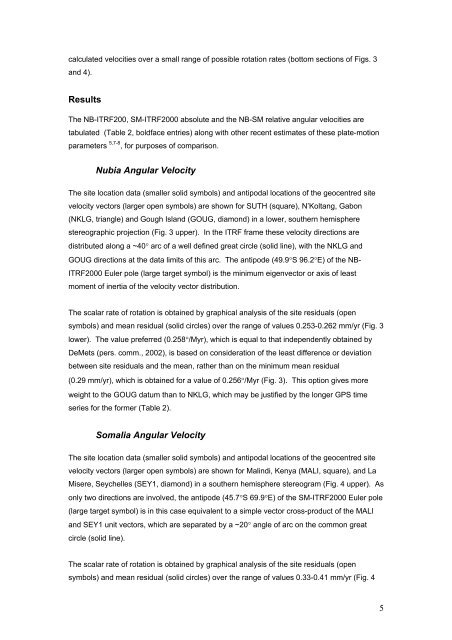
calculated velocities over a small range <strong>of</strong> possible rotation rates (bottom sections <strong>of</strong> Figs. 3and 4).ResultsThe NB-ITRF200, SM-ITRF2000 absolute and <strong>the</strong> NB-SM relative angular velocities aretabulated (Table 2, boldface entries) along with o<strong>the</strong>r recent estimates <strong>of</strong> <strong>the</strong>se plate-<strong>motion</strong>parameters 5,7-8 , for purposes <strong>of</strong> comparison.Nubia Angular VelocityThe site location data (smaller solid symbols) and antipodal locations <strong>of</strong> <strong>the</strong> geocentred sitevelocity vectors (larger open symbols) are shown for SUTH (square), N’Koltang, Gabon(NKLG, triangle) and Gough Island (GOUG, diamond) in a lower, sou<strong>the</strong>rn hemispherestereographic projection (Fig. 3 upper). In <strong>the</strong> ITRF frame <strong>the</strong>se velocity directions aredistributed along a ~40° arc <strong>of</strong> a well defined great circle (solid line), with <strong>the</strong> NKLG andGOUG directions at <strong>the</strong> data limits <strong>of</strong> this arc. The antipode (49.9°S 96.2°E) <strong>of</strong> <strong>the</strong> NB-ITRF2000 Euler pole (large target symbol) is <strong>the</strong> minimum eigenvector or axis <strong>of</strong> leastmoment <strong>of</strong> inertia <strong>of</strong> <strong>the</strong> velocity vector distribution.The scalar rate <strong>of</strong> rotation is obtained by graphical analysis <strong>of</strong> <strong>the</strong> site residuals (opensymbols) and mean residual (solid circles) over <strong>the</strong> range <strong>of</strong> values 0.253-0.262 mm/yr (Fig. 3lower). The value preferred (0.258°/Myr), which is equal to that independently obtained byDeMets (pers. comm., 2002), is based on consideration <strong>of</strong> <strong>the</strong> least difference or deviationbetween site residuals and <strong>the</strong> mean, ra<strong>the</strong>r than on <strong>the</strong> minimum mean residual(0.29 mm/yr), which is obtained for a value <strong>of</strong> 0.256°/Myr (Fig. 3). This option gives moreweight to <strong>the</strong> GOUG datum than to NKLG, which may be justified by <strong>the</strong> longer GPS timeseries for <strong>the</strong> former (Table 2).Somalia Angular VelocityThe site location data (smaller solid symbols) and antipodal locations <strong>of</strong> <strong>the</strong> geocentred sitevelocity vectors (larger open symbols) are shown for Malindi, Kenya (MALI, square), and LaMisere, Seychelles (SEY1, diamond) in a sou<strong>the</strong>rn hemisphere stereogram (Fig. 4 upper). Asonly two directions are involved, <strong>the</strong> antipode (45.7°S 69.9°E) <strong>of</strong> <strong>the</strong> SM-ITRF2000 Euler pole(large target symbol) is in this case equivalent to a simple vector cross-product <strong>of</strong> <strong>the</strong> MALIand SEY1 unit vectors, which are separated by a ~20° angle <strong>of</strong> arc on <strong>the</strong> common greatcircle (solid line).The scalar rate <strong>of</strong> rotation is obtained by graphical analysis <strong>of</strong> <strong>the</strong> site residuals (opensymbols) and mean residual (solid circles) over <strong>the</strong> range <strong>of</strong> values 0.33-0.41 mm/yr (Fig. 45


