Economics of Growing Trap Crop Radish Grazing Lambs
Economics of Growing Trap Crop Radish Grazing Lambs
Economics of Growing Trap Crop Radish Grazing Lambs
You also want an ePaper? Increase the reach of your titles
YUMPU automatically turns print PDFs into web optimized ePapers that Google loves.
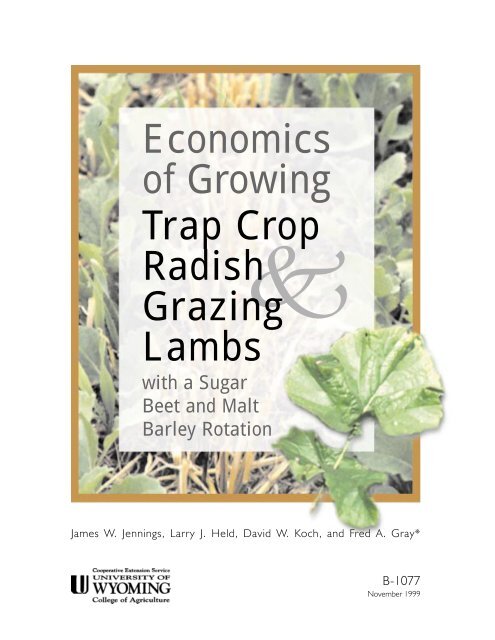
<strong>Economics</strong><strong>of</strong> <strong>Growing</strong><strong>Trap</strong> <strong>Crop</strong><strong>Radish</strong><strong>Grazing</strong><strong>Lambs</strong>with a SugarBeet and MaltBarley RotationkJames W. Jennings, Larry J. Held, David W. Koch, and Fred A. Gray*B-1077November 1999
*Authors:Former Graduate Research Assistant James W. Jennings and Pr<strong>of</strong>essor Larry J. Held,Department <strong>of</strong> Agricultural and Applied <strong>Economics</strong>Pr<strong>of</strong>essor David W. Koch and Pr<strong>of</strong>essor Fred A. Gray,Department <strong>of</strong> Plant SciencesEditor: Diana Marie Hill-Chavez, College <strong>of</strong> Agriculture, Office <strong>of</strong> Communications and TechnologyGraphic Artist: Tana Stith, College <strong>of</strong> Agriculture, Office <strong>of</strong> Communications and TechnologyTrade or brand names used in this publication are used only for the purpose <strong>of</strong> educational information. The information given herein is suppliedwith the understanding that no discrimination is intended, and no endorsement information <strong>of</strong> products by the Agricultural Research Service,Federal Extension Service, or State Cooperative Extension Service is implied. Nor does it imply approval <strong>of</strong> products to the exclusion <strong>of</strong> otherswhich also may be suitable.Issued in furtherance <strong>of</strong> Cooperative Extension work, acts <strong>of</strong> May 8 and June 30, 1914, in cooperation with the U.S. Department <strong>of</strong> Agriculture.Glen Whipple, Director, Cooperative Extension Service, University <strong>of</strong> Wyoming, Laramie, Wyoming 82071.Persons seeking admission, employment, or access to programs <strong>of</strong> the University <strong>of</strong> Wyoming shall be considered without regard to race, color,religion, sex, national origin, disability, age, veteran status, sexual orientation, and political belief. Persons with disabilities who requirealternative means for communication or program information (Braille, large print, audiotape, etc.) should contact their local UW ExtensionOffice. To file a complaint, write the UW Employment Practices/Affirmative Action Office, University <strong>of</strong> Wyoming, P.O. Box 3434, Laramie,Wyoming 82071-3434.
IntroductionSugar beets are an important crop inWyoming’s economy. In 1997, sugar beetscomprised 29.1 percent <strong>of</strong> total cashreceipts for Wyoming crops ($57.6 <strong>of</strong> $198million) and 15.5 percent <strong>of</strong> the total value<strong>of</strong> Wyoming’s crop production ($57.6 <strong>of</strong>$372.1 million). Total value <strong>of</strong> crop productionincludes feed crops marketedthrough livestock. Nationally, Wyomingranks seventh among the states that producesugar beets (Wyoming Agricultural Statistics,1998). Sugar beets are a high-valuecrop, costing an average <strong>of</strong> $804 per acre(USDA ERS, 1998). Astute management iscritical to maintain favorable pr<strong>of</strong>it margins,particularly from the standpoint <strong>of</strong> effectiveweed and pest control.The sugar beet cyst nematode (SBCN),Heterodera schachtii, a microscopic roundworm,is among the most damaging andwidely occurring pest problems faced byWyoming sugar beet growers. A survey <strong>of</strong>fields in Washakie County showed that 95percent were infested with nematodes and72 percent were above the estimateddamage threshold <strong>of</strong> 2.8 eggs and/orjuveniles per cm 3 (Gray, 1995). Sixty-fivepercent <strong>of</strong> fields in long-term sugar beetproduction are infested with nematodes.This level <strong>of</strong> infestation is typical in areaswhere sugar beets have been grown intensivelyfor 50 years or more. Nematodes cancause poor seedling emergence, poorstands, stunted plants, low sugar content,and up to 50 percent crop loss.One traditional form <strong>of</strong> nematode controlis crop rotation, consisting <strong>of</strong> five or moreyears without sugar beets on the sameground. Survey results showed that 54percent <strong>of</strong> sugar beet fields in WashakieCounty had only one year between sugarbeet crops. Forty-one percent had twoyears, 5 percent had three years, and none<strong>of</strong> the surveyed fields had four years ormore between sugar beet crops (Gray et al.,1995). These rotations were too short toadequately control even moderate nematodepopulations, and they have causednematode populations and other soilpathogens to build up.Sugar beet growers have relied heavily onpesticides to control nematodes, so theycould maintain relatively short (two to threeyear) rotations. Temik® (aldicarb) is anematicide/insecticide that has been used onapproximately 30 percent <strong>of</strong> Wyoming’ssugar beets (Legg et al., 1992). Counter®15G (terbufos) also has dual activity and isused to control low to moderate nematodepopulations, and Telone® II (1,3-dichloropropene) is a soil fumigant used totarget nematodes (Gray and Koch, 1997).These chemicals are costly. The full labelrate <strong>of</strong> Temik® (27 pounds per acre) costs$90 per acre; a full label rate <strong>of</strong>Counter®15G (27 pounds per acre) costs$48 per acre; and a full label rate <strong>of</strong> Telone®II (17.3 gallons per acre) costs approximately$190 per acre.Many <strong>of</strong> these pesticides are classified as“restricted use,” as they represent a significantenvironmental risk to air and water, aswell as a health risk to applicators. Temik®has been found in Wyoming’s groundwaterand Telone II® has been found in surfacewater throughout the state. Availability <strong>of</strong>these pesticides is uncertain, and possible1
chemical use cutbacks or elimination couldseriously threaten the livelihood <strong>of</strong>Wyoming’s sugar beet industry. Sugar beetpr<strong>of</strong>itability, the prevalence <strong>of</strong> nematodes,and the price <strong>of</strong> conventional nematodecontrols (nematicides and rotations) havegenerated a need to find safe and economicalalternatives to nematicides for controllingthe sugar beet cyst nematode.To address these concerns, studies wereconducted in Wyoming to evaluate thebiological effectiveness <strong>of</strong> growing trapcrops for nematode control. Special varieties<strong>of</strong> radish, Raphanus sativus, and mustard,Sinapis alba, have been planted insugar beet fields one year prior to plantingsugar beets. A trap crop effectively cleansesthe soil by first attracting nematodes toenter its roots, and then it becomes anantagonistic host by preventing the nematodesfrom multiplying and reproducing(Koch, Gray, and Krall, 1995).<strong>Crop</strong>s are categorized as being nematodesusceptible (soil population <strong>of</strong> SBCN isincreased through the roots), neutral (soilpopulation is unaffected), or resistant (soilpopulation is reduced due to limited or noreproduction). Susceptible plants includesugar beets, other selected root crops, andcertain weeds. Neutral plants include smallgrains and grasses, dry beans, corn, andalfalfa. Resistant plants include the specialforms <strong>of</strong> trap crop radish and mustard,originally developed in Europe in responseto nematicides being removed from themarket due to groundwater contamination(Cooke, 1991). Currently, one cultivar <strong>of</strong>radish and one <strong>of</strong> mustard is commerciallyavailable in the United States.Studies conducted in northwest Wyominghave shown that trap crops can reduceSBCN populations up to 75 percent,resulting in as good or better sugar beetyields as those attained from chemicallytreated acres (Koch and Gray, 1997).<strong>Radish</strong> must be established early in the yearas a spring-sown full-season crop or in lateJuly to early August as a secondary cropfollowing barley (or other early harvestedcrops) to allow for sufficient radish growth.Only limited success has been achieved byplanting radish as a second crop followinglate harvested crops, such as corn or drybeans, in southeast Wyoming (Koch, Gray,and Krall, 1998). <strong>Trap</strong> crops plantedfollowing malt barley have proven to bebiologically effective; however, less isknown about their economic potential as asubstitute for nematicide.ApproachAn economic analysis <strong>of</strong> a representativeirrigated sugar beet and malt barley operationin Wyoming’s Big Horn Basin wasconducted. The model farm was originallydeveloped by a panel <strong>of</strong> farmers for DougAgee, pr<strong>of</strong>essor <strong>of</strong> agricultural economics,and was updated by James Jennings,graduate research assistant.The economic analysis compared a typicalnematicide control treatment with two trapcrop alternatives <strong>of</strong> a 720-acre farm (seeFigure 1). These alternatives includedgrowing radish either as a spring-sown fullseasoncrop or as a secondary summer crop2
following malt barley. A whole-farm analysiswas initiated by updating sugar beet andmalt barley budgets (Agee, 1986) andconstructing additional budgets for fullseasonand second crop radish to includecosts <strong>of</strong> operating inputs (seed, fertilizer,pesticides, and labor), as well as charges formachinery and management (Jennings,1998).One benefit <strong>of</strong> growing trap crop radish isits potential to supply late season forage forgrazing lambs, as opposed to simply plowingradish down before planting sugar beets(see Figure 1). Studies <strong>of</strong> lambs grazing trapcrop radish in northwest Wyoming havebeen very promising (Koch et al., 1999,and Yun, 1997). Specifically, lambs haveshown late season gains, ranging from 0.28to 0.39 pounds per day, as a result <strong>of</strong>consuming trap crop radish. In addition,trap crop radish produced per acre gains <strong>of</strong>at least 200 pounds and over 500 lambgrazing days per acre. Also, grazing radishesdoes not adversely affect nematodecontrol or sugar beet yields.To estimate the economic contributionfrom grazing lambs, enterprise budgets forpurchasing lambs at an average weight <strong>of</strong>85 pounds in early October and thenselling fed lambs weighing between 140.2and 143.2 pounds in early March weredeveloped (see Figure 1).If lambs are grazed when trap crop radish isnot part <strong>of</strong> the rotation, approximately3,400 head can be maintained on 240 acres<strong>of</strong> beet tops and barley stubble through3
mid-November (Rule et al., 1991, andAgee, 1983). (See Figure 1; 1b.) After thistime, lambs are placed in a feed lot toreceive free choice alfalfa and corn for anadditional 105 days to achieve a targetweight <strong>of</strong> 143.2 pounds. An overall averagedaily gain (ADG) <strong>of</strong> 0.388 pounds iscalculated as the following weighted average:[(30 percent x 0.29 ADG) + (70 percent x0.43 ADG)]. These numbers are based on:30 percent or the initial 45 days from earlyOctober to mid-November <strong>of</strong> the 150-dayperiod spent grazing beet tops for an ADG<strong>of</strong> .29 pounds (Rule et al., 1991 ) and theremaining 70 percent (105 days <strong>of</strong> 150)spent in the feed lot receiving a free choice<strong>of</strong> alfalfa (67 percent) and corn (33 percent)for an ADG <strong>of</strong> 0.43 pounds (Yun, 1997).If lambs are grazed with trap crop radish inthe rotation, growing 240 acres <strong>of</strong> radishextends the grazing season by at least 28days for the 3,400 lambs (see Figures 1; 2band 3b). These figures are based on anaverage radish production <strong>of</strong> 2,583 poundsper acre for grazing, an average forageutilization rate <strong>of</strong> 69 percent (Koch et al.,1999), and an average daily feed consumption<strong>of</strong> 4.5 pounds per head (NationalAcademy <strong>of</strong> Sciences, 1975). An extendedgrazing season <strong>of</strong> 28 days is calculated as:radish production and lamb utilization[(2,583 pounds per acre) x (240 acres) x(69 percent utilization)], divided by totalfeed consumption [(3,400 head) x (4.5pounds per head)].Adding another 28 days <strong>of</strong> grazing providessubstantial cost savings, as lambs enter thefeed lot later in mid-December, rather thanmid-November. This method requires only77 days, compared with 105 days, <strong>of</strong>feeding purchased corn and alfalfa. With thisextension, the grazing season comprisesanother 18.7 percent, or another 28 <strong>of</strong> 150days, <strong>of</strong> the total feeding period. Therefore,the percentage <strong>of</strong> the total season dedicatedto grazing increases from 30 percent to 48.7percent, and the feed lot phase decreasesfrom 70 percent to 51.3 percent <strong>of</strong> the totaldays on feed. In this case, the average gain iscalculated as a weighted average <strong>of</strong> 30percent <strong>of</strong> the initial 150-day period spentgrazing beet tops, 18.7 percent grazing trapcrop radish, and the remaining 51.3 percent<strong>of</strong> the time spent in the feed lot.With these respective proportions and gains,a weighted average <strong>of</strong> 0.367 was calculated:[(30 percent x 0.29 ADG from beet tops) +(18.7 percent x 0.32 ADG from radish) +(51.3 percent x 0.43 ADG from the feedlot)]. An average daily gain <strong>of</strong> 0.367 over150 days yields a weight gain <strong>of</strong> 55.2pounds or a slightly lower sale weight <strong>of</strong>140.2 pounds.Pr<strong>of</strong>itability <strong>of</strong> Alternative SystemsBudgets showing overall farm pr<strong>of</strong>itability,either with or without lambs, are summarizedfor each <strong>of</strong> the farming systems,including those using nematicide, fullseasonradish, and second crop radish afterbarley (see Tables 1 through 3). Sugar beetsgrown with trap crops use less pesticide (12pounds <strong>of</strong> terbufos, costing $21 per acre).Sugar beets grown without trap crop radishrequire larger amounts <strong>of</strong> pesticides. (12pounds <strong>of</strong> terbufos + 12 gallons <strong>of</strong> 1,3-dichloropropene = $153 per acre).4
<strong>Crop</strong> revenues were calculated as an average<strong>of</strong> yearly historic crop prices and yields asreported in 1985-96 Wyoming AgriculturalStatistics (see Tables 1 through 3). Yearlymargins for lambs also were calculated andaveraged over the same 12-year period. Thiscalculation was based on historic prices forbuying corn and alfalfa and purchasing 85-pound feeder lambs in October and selling140- to 143-pound lambs in March(USDA Agricultural Marketing Service,1997).Annual pr<strong>of</strong>it margins for lambs wereadded to annual net revenue from crops toobtain a 12-year average return to land (seeTables 1 through 3). The dollar return tothe land is the net amount remaining aftersubtracting all costs, except a land charge,from the gross revenue. The percent rate <strong>of</strong>return to farmland is then calculated by dividingthe residual dollar amount by theestimated value <strong>of</strong> irrigated farmland($1,500 per acre).<strong>Crop</strong>s OnlyIs growing trap crop radish for nematodecontrol more pr<strong>of</strong>itable than using nematicide?Table 1a shows the standard 240-acresugar beet and 480-acre malt barley rotation,which requires higher costs for purchasedinputs ($382.70), including nematicide.Tables 2 and 3 show that sugar beetsgrown with trap crops require lower inputcosts ($250.70). Using nematicides generatesa modest return to the land ($41,766or 3.87 percent). The dollar return to theland, in this case, is calculated by subtractingall costs except land ($373,026) fromtotal farm revenue ($414,792), then thedollar return is divided by the value <strong>of</strong> 720acres <strong>of</strong> irrigated farmland ($1,080,000) togenerate the percent rate <strong>of</strong> return (3.87percent).6
Table 2a shows that replacing nematicidewith full-season radish is a poor choice.Replacing nematicide yields a return to theland <strong>of</strong> $10,677 (0.99 percent). This lowreturn is due to the high cost <strong>of</strong> growing240 acres <strong>of</strong> full-season radish ($220.98 peracre), as well as the reduced barley revenuecoming from only 240 acres rather than480 acres. Also, growing barley with fullseasonradish is more expensive because <strong>of</strong>higher per acre machinery ownership costs.Table 3a shows that replacing nematicidewith 240 acres <strong>of</strong> second crop radish,following malt barley, is the most pr<strong>of</strong>itablechoice. This generates a net return <strong>of</strong>$62,962 (5.83 percent) compared with$41,766 (3.87 percent) when using nematicide.The $164.85 per acre cost saving fromeliminating the purchase and application <strong>of</strong>nematicide is shown in Table 3a ($663.05)compared with Table 1a ($827.90). Thisfigure easily exceeds the $73.72 added cost<strong>of</strong> growing second crop radish after barley($438.32 compared with $364.60 in Table3a).The economic advantage <strong>of</strong> using trap cropradish, rather than nematicide, as reported inTables 1 through 3 may be conservative.First, the $132 per acre input cost <strong>of</strong> nematicide(Telone II®) was based on a ratebelow label recommendations (i.e., 12gallons compared with 17.3 gallons per acre)to better represent observed applicationpractices. Second, because <strong>of</strong> measurementdifficulties, no long-term yield advantagewas credited to sugar beets grown after trapcrop radish, although statistically higheryields have occasionally been observed whensugar beets follow trap crop radish (Kochand Gray, 1997).6
<strong>Crop</strong>s and <strong>Lambs</strong>How much extra pr<strong>of</strong>it can be generatedfrom integrating a graze and feed lambenterprise with a farming system? Withouttrap crop radish and the benefit <strong>of</strong> 28 extradays <strong>of</strong> grazing, consolidating lambs withthe farming system increases whole-farmpr<strong>of</strong>itability (see Table 1). However, only amodest amount <strong>of</strong> pr<strong>of</strong>it increase is seen,$41,766 (3.87 percent) to $61,852 (5.73percent).How much extra pr<strong>of</strong>it is generated fromlambs when radish is grown as a full-seasoncrop to treat nematodes? Largely because<strong>of</strong> the extended grazing season and lowerpurchased feed costs ($15.26 comparedwith $20.79), lambs grazing full-seasonradish contribute an extra 3.65 percent tothe overall net return (see Table 2b). <strong>Lambs</strong>grazing without radish only bring an extra1.86 percent to the overall net return (seeTable 1b). This outcome occurs althoughthe average rate <strong>of</strong> gain and sale weight isslightly lower (140.2 compared with 143.2pounds), because extra grazing days replacepurchased feed. However, the higher returnthat results from lambs grazing radish (3.65percent) is insufficient to fully compensatefor poor performance <strong>of</strong> the crop rotationwith full-season radish (0.99 percent). As aresult, an overall farm net return <strong>of</strong> only4.64 percent compared with 5.73 percentfrom grazing lambs without radish is seen(see Tables 1 and 2).What are the results if radish is grown as asecond crop for nematode control? Because<strong>of</strong> the extended grazing season and lowerpurchased feed costs, lambs grazed onsecond crop radish contribute an additional3.67 percent to whole-farm pr<strong>of</strong>itability;moreover, this pr<strong>of</strong>it is added to an alreadyfavorable 5.83 percent rate <strong>of</strong> return generatedfrom growing only secondary cropradish in rotation with other crops (see Table3). <strong>Growing</strong> second crop radish in conjunctionwith grazing lambs is by far the best7
alternative to nematicide because the returnto land nearly doubles from $61,852 (5.73percent) to $102,582 (9.50 percent).Risk Evaluation <strong>of</strong> Alternative SystemsTo consider potential income variability andrisks associated with alternative systems,returns with whole-farm budgets wererecalculated for the 1985-96 time period(see Tables 1 through 3).Table 4shows the resulting yearly and 12-yearaverage net returns for each <strong>of</strong> the designatedfarming systems, as well as selected measures<strong>of</strong> income variability (standard deviation)and downside risk. Downside risk is shownin terms <strong>of</strong> the frequency, or number <strong>of</strong>years in 12, during which annual returnmisses a particular income target ($54,000)and the total amount through all 12 yearsthat annual income misses the same target($54,000).The $54,000 target is the net return necessaryto achieve a 5 percent rate <strong>of</strong> return tothe land. The formula used to calculate thisfigure is: [($54,000)/(720 acres x $1,500/acre)].Replacing Nematicide with <strong>Trap</strong><strong>Crop</strong> <strong>Radish</strong>How attractive is replacing nematicide withtrap crop radish? Table 4 shows that thetraditional 240-acre sugar beet and 480-acre malt barley rotation using nematicidegenerates a return to the land equal to$41,766 (3.87 percent) and misses the$54,000 target in 5 <strong>of</strong> 12 years by a total <strong>of</strong>$245,486. Full-season radish is again shownto be very ineffective, not only from thestandpoint <strong>of</strong> low earnings ($10,677), butalso it misses the $54,000 target in 11 <strong>of</strong> 12years by a total <strong>of</strong> $522,368.In contrast, radish as a secondary crop ismore pr<strong>of</strong>itable than nematicide (5.83percent compared with 3.87 percent) andless risky, as it misses the $54,000 (5 percent)target in only 3 <strong>of</strong> 12 years by a total<strong>of</strong> $150,963.<strong>Trap</strong> <strong>Crop</strong> <strong>Radish</strong> and <strong>Lambs</strong>How is downside risk affected by replacingnematicide with trap crop radish if lambgrazing is part <strong>of</strong> the operation? Table 4shows that growing full-season radish, evenwith the benefit <strong>of</strong> grazing lambs, is still aworse choice than using nematicide.<strong>Growing</strong> full-season radish leads to a loweraverage return ($50,087 compared with$61,852) and misses the $54,000 target bya total <strong>of</strong> $315,957 over the 12-year period.When lambs are part <strong>of</strong> the system, growingradish as a second crop is the bestoption. The return to the land is muchhigher at $102,582 (9.50 percent) whencompared with grazing lambs on only beettops and barley stubble, resulting in$61,852 (5.73 percent). Moreover, thedownside risk is reduced substantially, as the$54,000 (5 percent) target is missed in only2 <strong>of</strong> 12 years. Also, the $54,000 target ismissed by a much smaller amount ($83,168compared with $255,608).8
<strong>Grazing</strong> <strong>Lambs</strong> with or without<strong>Radish</strong>What is the impact on pr<strong>of</strong>itability and riskwhen lambs are added to the farmingoperation? When operations that do notgrow trap crop radish added 3,400 lambs tothe farm, they generated a somewhat modestincrease in the return to the land (3.87percent compared with 5.73 percent). Also,adding lambs increased the risk <strong>of</strong> missingthe $54,000 target from 5 to 7 years in 12years. However, farmers who grew trapcrop radish either as a full-season or as asecond crop for nematode control andadded lambs (with an extended grazingseason due to radish) experienced a tw<strong>of</strong>oldbenefit <strong>of</strong> higher pr<strong>of</strong>it and lower risk.Adding lambs when growing full-seasonradish reduced the chances <strong>of</strong> missing the$54,000 (5 percent) target during a 12-yearperiod (11 to 7 years <strong>of</strong> 12). Similarly,adding lambs to operations with secondcrop radish reduced the frequency <strong>of</strong> missingthe $54,000 target (from 3 to 2 years <strong>of</strong> 12)9
and reduced the total amount lost from$150,963 to $83,168. Adding lambsincreased the overall amount <strong>of</strong> incomevariability (standard deviation) across allthree systems, adding somewhat to theuncertainty <strong>of</strong> predicting future net returns,although most uncertainty was in the form<strong>of</strong> returns exceeding, rather than fallingbelow, the specified target amount.Conclusion<strong>Growing</strong> trap crop radish appears to be aneconomical alternative to using nematicide.Indeed, dual benefits <strong>of</strong> added pr<strong>of</strong>it andlower downside risk are possible if trap cropradish is grown as a second crop afterbarley. <strong>Grazing</strong> radish with lambs furthermagnifies these benefits. Currently, someWyoming, Idaho, and Colorado growersalready have experienced success growingtrap crop radish on a limited basis. Withoutan early harvested crop, such as barley, inthe rotation, the benefit <strong>of</strong> second cropradish is limited due to insufficient growingdays.When compared with growing second cropradish, the economic potential <strong>of</strong> full-seasonradish is questionable because its success ismuch more dependent upon exploitinglivestock grazing to defray full-seasonradish’s high cost. Full-season radish couldbe a better option than shown in thisanalysis, due to possible benefits <strong>of</strong> a haycrop harvested from full-season radishbefore grazing.Utilizing the benefits <strong>of</strong> grazing lambs maybe easier for operations currently integratingcrops and livestock. Yet, some producersprefer to operate on a cash crop basis andmay be less interested in adding livestockbecause <strong>of</strong> high initial management costs.However, some <strong>of</strong> this disadvantage couldbe <strong>of</strong>fset if opportunities for cash cropfarmers to lease out their radish acreage toother livestock producers became available.In addition to its potential to supply valuablefall grazing, trap crop radish also leadsto several other benefits. Reduced groundwatercontamination and improved airquality are some important environmentaladvantages <strong>of</strong> shifting away fromnematicides, which are not factored intothis analysis. <strong>Trap</strong> crop radish can recoverresidual soil nitrates from deeper soilpr<strong>of</strong>iles, thus promoting reduced groundwaterpollution and making additionalnitrogen available for subsequent crops.The final plowing down <strong>of</strong> trap crop radish,whether grazed or not, also increases soilorganic matter. This fact may explain some<strong>of</strong> the increased sugar beet yield advantageobserved from growing trap crop radish inplace <strong>of</strong> using nematicides. Over time,better nematode control also may occur,since increased organic matter and reducednematicide use can promote an increase innaturally occurring antagonists and parasites<strong>of</strong> the sugar beet nematode.10
ReferencesAgee, D.E. (1983). Possible returns from beet tops, a case situation. University <strong>of</strong> Wyoming:Wyoming Cooperative Extension Service Agricultural <strong>Economics</strong> handout series.Agee, D. E. (1986). Costs <strong>of</strong> producing crops, Worland area. University <strong>of</strong> Wyoming: WyomingCooperative Extension Service Bulletin Number 644R.Cooke, D. (1991). Europe goes green to control beet cyst nematode. British Sugar, 59, 44-47.Gray, F.A. (1995). Distribution and incidence <strong>of</strong> sugar beet diseases in the Wind River and BigHorn Basins <strong>of</strong> northwest Wyoming. University <strong>of</strong> Wyoming: Wyoming Agricultural ExperimentStation Bulletin Number 1031.Gray, F.A. and D.W. Koch (1997). Biology and management <strong>of</strong> the sugar beet nematode.University <strong>of</strong> Wyoming: Wyoming Cooperative Extension Service Bulletin Number975R.Jennings, J.W. (1998). <strong>Economics</strong> <strong>of</strong> integrating nematode-resistant radishes and lamb enterpriseswith sugar beet rotations in northwest Wyoming (Master’s Thesis). University <strong>of</strong> Wyoming.Koch, D. W., F.A. Gray, and J.M. Krall (1995). Nematode-resistant trap crops: a new method <strong>of</strong>pest control for Wyoming sugar beet growers. University <strong>of</strong> Wyoming: Wyoming CooperativeExtension Service Bulletin Number 1029.Koch, D.W. and F.A. Gray (1997). Nematode-resistant oil radish for control <strong>of</strong> Heteroderaschachtii I. Sugar beet-barley rotations. Journal <strong>of</strong> Sugar Beet Research, 34, 31-43.Koch, D.W. and F.A. Gray (1998). Nematode-resistant oil radish for control <strong>of</strong> Heteroderaschachtii II. Sugar beet-dry bean-corn rotations. Journal <strong>of</strong> Sugar Beet Research, 35, 63-75.Koch, D.W., F.A. Gray, L. Yun, R. Jones, J. Gill, and M. Schwope (1999). <strong>Trap</strong>-crop radish usein sugar beet-malt barley rotations <strong>of</strong> the Big Horn Basin. University <strong>of</strong> Wyoming: WyomingAgricultural Experiment Station Bulletin Number 1068.Legg, D.E., M. Ferrell, D.T. Taylor, and D.L. Kellogg (1992). Pesticide use in Wyoming, 1990.University <strong>of</strong> Wyoming: Wyoming Cooperative Extension Service Bulletin number RJ-211.National Academy <strong>of</strong> Sciences. (5th ed.) (1975). Nutrient requirements <strong>of</strong> sheep. Washington,D.C.Rule, D.C., D.W. Koch, R.R. Jones, and C.J. Kercher (1991). Brassica and sugar beet foragesfor lambs-growth performance <strong>of</strong> lambs and composition <strong>of</strong> forage and dock-fat fattyacids. Journal <strong>of</strong> Production Agriculture, 4, 29-33.11
U.S. Department <strong>of</strong> Agriculture. (1997). Livestock detailed annual price quotations: FortCollins/direct sheep for 1982-96. Agricultural Marketing Service Livestock and Seed Division.U.S. Department <strong>of</strong> Agriculture. (1998). Sugar beet costs and returns: 1996-97 costs <strong>of</strong> production.Economic Research Service.Wyoming Department <strong>of</strong> Agriculture. (Annual Publication). Wyoming Agricultural Statistics.Cheyenne, Wyoming: Wyoming Agricultural Statistics Service.Yun, L. (1997). Fall grazing <strong>of</strong> trap-crop radishes (Master’s Thesis). University <strong>of</strong> Wyoming.12
APPENDIX AInventory <strong>of</strong> Land and Improvements,Machinery, and Equipment
Table A1. Inventory <strong>of</strong> Land and Improvements.Land Values Estimated Estimatedpresent value present valueItem Acres per acre <strong>of</strong> whole farmLandIrrigated <strong>Crop</strong> Land 720 $1,500 $1,080,000Farmstead, Roads, Waste 20 $375 $7,500Subtotal: Land 740 $1,875 $1,087,500Improvement ValuesCase Farm ImprovementsCost if new Useful life Years Remaining Present SalvageItem Size in 1997 in years used years Annual use value valueImprovement Investment(acres)Labor Houses, Frame (3) 26' x 40' $120,960 40 20 20 720 $75,600 $37,800Labor Houses, Beet Labor 20' x 30' $15,120 40 20 20 240 $10,584 $5,040Shop, Metal 40' x 60' $40,320 40 20 20 720 $27,720 $15,120Machine Sheds, Frame-Pole (2) 40' x 60' $25,200 30 15 15 720 $20,160 $10,080Concrete Ditch 7,040 ft $22,176 40 20 20 720 $17,640 $8,820Fences 4 miles $10,080 30 15 15 720 $5,040 $2,520Grain Bins 20,000 Bu. $25,200 30 10 20 480 $15,120 $7,560Scale 10' x 30' $31,680 30 15 15 720 $17,640 $3,780(head)Corrals and Water System 5000 hd. $12,600 30 20 10 3400 $7,560 $5,040Barn 20' x 30' $11,340 30 15 15 3400 $8,064 $3,780Improvements Subtotal $314,676 $205,128 $99,54015
Table A2. Inventory <strong>of</strong> Machinery and Equipment.Cost if new Useful hours life Years Remaining Annual Present SalvageItem Fuel type Size in 1997 or miles years used years use value valueVehicles(miles)Motorcycle #1 Gas 250 cc. $4,757 25,000 10 3 7 3,264 $2,417 $1,427Motorcycle #2 Gas 250 cc. $4,757 25,000 10 5 5 3,264 $2,074 $1,4274-Wheeler #1 Gas 350 cc. $5,476 25,000 10 6 4 2,630 $2,213 $1,6424-Wheeler #2 Gas 400 cc. $5,969 25,000 10 2 8 2,630 $3,276 $1,790Pickup #1 Gas 1/2 ton $20,854 75,000 15 12 3 1,315 $5,403 $4,352Pickup #2 Gas 1/2 ton $20,854 75,000 15 10 5 1,315 $6,254 $4,352Pickup #3 Gas 1/2 ton $20,854 75,000 15 7 8 1,315 $7,818 $4,352Pickup #4 Diesel 3/4 ton $27,989 75,000 15 5 10 1,315 $12,203 $5,841Truck, Bed and Hoist Gas 2 ton $50,000 80,000 20 16 4 1,560 $9,720 $7,355Truck, Bed and Hoist Gas 2 ton $50,000 80,000 20 11 9 1,560 $13,935 $7,355Truck, Bed and Hoist Diesel Tandem $80,000 100,000 25 11 14 2,712 $31,792 $11,768Truck, Bed and Hoist Diesel Tandem $80,000 100,000 25 6 19 2,712 $38,912 $11,768Vehicle Subtotal: $371,510 $136,019 $63,430Tractors(hours)Front Wheel Assist Diesel 180 hp. $84,010 10,000 12 4 8 284 $43,946 $26,7912-Wheel Drive, Duals Diesel 145 hp. $72,506 10,000 12 4 8 401 $37,928 $23,1222-Wheel Drive, Duals Diesel 135 hp. $64,870 10,000 12 6 6 397 $29,983 $20,6872-Wheel Drive, Duals Diesel 110 hp. $49,530 10,000 12 8 4 405 $20,228 $15,7952-Wheel Drive, Duals Diesel 90 hp. $38,382 10,000 14 10 4 771 $13,852 $10,8162-Wheel Drive, Duals Diesel 70 hp. $28,623 10,000 16 12 4 688 $9,128 $7,127Tractors Subtotal: $337,921 $155,064 $104,338Tillage Equipment(hours)Plow, 2-Way Moldboard 5 - 18's $7,500 2,000 8 3 5 220 $4,379 $3,571Roller Harrow #1 21 ft. $25,160 2,000 6 2 4 71 $15,305 $12,998Roller Harrow #2 15 ft. $15,980 2,000 6 4 2 99 $8,958 $8,255Level (float) #1 16 ft. $10,460 2,000 12 6 6 69 $5,404 $4,230Level (float) #2 12 ft. $8,470 2,000 12 10 2 92 $3,717 $3,425Disk, Tandem 15 ft. $10,664 2,000 12 8 4 110 $5,077 $4,313Planting Equipment (hours)Grain Drill 15 ft. $15,460 1,200 10 2 8 113 $9,404 $6,784Corrugator (Mormon Creaser) 16 ft. $2,756 1,200 10 5 5 55 $1,483 $1,209(Ridger) Bedder-Chemical Boxes 12 row $9,980 1,200 10 6 4 23 $5,156 $4,379Sugar beet (planter) 12 row $22,080 1,200 8 6 2 44 $11,407 $10,512Cultivating Equipment (hours)Sugar beet Cultivator & Tools 12 row $22,430 2,000 10 5 5 94 $12,070 $9,842Harvest Equipment (hours)Sugar beet Defoliator 6 row $11,240 2,000 6 5 1 15 $4,901 $4,543Sugar beet Top Saver 6 row $27,210 2,000 6 3 3 69 $13,825 $10,998Sugar beet Puller (beet digger) 6 row $60,945 2,500 8 6 2 64 $24,634 $21,197Swather, Self-Propelled Diesel 14 ft. $46,643 2,500 10 8 2 37 $13,452 $10,896Combine, SP, 2 Head Diesel 200 hp, 18 ft. $126,409 2,000 10 4 6 105 $61,460 $39,768Balers: Big Square & 4 ft. x 8 ft. $67,037 2,000 10 6 4 54 $26,828 $19,220Round 5 ft. x 6 ft. $19,683 2,000 10 4 6 54 $9,306 $5,64316
Table A2. Inventory <strong>of</strong> Machinery and Equipment (continued).Cost if new Useful life Yrs Remain. Annual Present SalvageItem Fuel type Size in 1997 hr. or miles yrs used years use value valueFeeding and Livestock Equipment(hours)Tub Grinder $13,250 2,000 15 8 7 197 $4,608 $2,765Feed Cart #1 2 ton $10,160 2,000 15 12 3 393 $2,632 $2,120Feed Cart #2 2 ton $10,160 2,000 15 6 9 393 $4,107 $2,120(head)Self Feeders (wood) 16 ft. $504 15 7 8 3400 $194 $71Electric Fence (3 strand) 1/2 mile $1,122 10 5 5 3400 $415 $157Corral Panels (20 panels) 16 ft. $400 2,000 15 10 5 3400 $117 $56Sheep Loading Chute 30 ft. $3,810 2,000 20 6 14 3400 $1,540 $560Spraying Equipment(hours)Sprayer, Trail, 500 gal. 40 ft. $12,580 1,500 8 2 6 47 $6,905 $4,375Sprayer, 3-point Hitch, 300 gal. 21 ft. $7,332 1,500 8 6 2 64 $2,964 $2,550Sprayer, for 4-Wheeler, 300 ga Gas 21 ft. $4,564 1,500 8 4 4 43 $2,148 $1,587Irrigation Equipment(acres)Siphon Tubes (4,000) various $10,240 15,000 10 5 5 720 $3,789 $1,434Gated Pipe (2 miles) various $20,117 15,000 15 5 10 720 $8,984 $2,816Trash Racks various $500 15,000 8 3 5 720 $214 $70Ditch Checks (dams) various $600 15,000 8 4 4 720 $222 $84Moss Catchers (6) $6,750 15,000 6 3 3 720 $2,498 $970Pipe Wagon 35 ft. $3,120 15 10 5 720 $915 $437Miscellaneous Equipment (hours)Ditcher 8 ft. $2,110 2,000 10 8 2 40 $734 $633Blade 8 ft. $3,050 2,000 10 4 6 32 $1,435 $915Manure Spreader 370 Bu. $15,446 2,000 15 4 11 62 $7,269 $3,224Grain Auger, PTO Driven 10". x 50' $5,470 2,000 12 10 2 61 $1,640 $1,417Front End Loader $10,795 2,000 10 6 4 318 $4,363 $3,237(miles)Horse Trailer, Gooseneck 7' x 18' $6,985 2,500 20 5 15 91 $3,045 $1,027(acres)Fuel Tanks (3) 1,000 gallon $4,500 15 8 7 720 $1,596 $630Shop Equipment various $15,000 20 10 10 720 $5,550 $2,100Rotary Chopper (mower) 6 ft. $3,744 2,000 8 6 2 720 $1,333 $1,080Weed Burner (propane tank) Propane $3,250 8 4 4 720 $1,203 $455Equipment Subtotal: $685,666 $307,187 $218,67517
APPENDIX BField Operations and Input ApplicationsandInput Rates and Prices
Table B1. Field Operations, Nematicide (#1).<strong>Crop</strong>s and AcreageSugar MaltTractor Fuel Implement Beets Bly. Total acres Acres per Hours Hours Hours/acreOperation(s) HP Work load Size 240 480 covered 10 hours Tractor Man 1 time overPre-plant Operations:Spread Fertilizer 90 Low custom 1 1 720 153 47 94 0.065Load Manure 110 Med loader 1 480 51 94 94 0.196Spread Manure 135 Low 370 Bu. 1 480 51 94 94 0.196Plow Heavy Draft 180 High 5 - 18's 1 1 720 33 220 220 0.306Tandem Disk 145 High 15 ft. 1 1 720 65 110 110 0.153Roller Harrow: 1st time 145 High 15 ft. 1 1 720 73 99 99 0.138other times 135 Med 21 ft. 1 1 720 102 71 71 0.098Roller Harrow and Spray 110 Med 21 ft. 1 240 102 24 24 0.098Level (float) 145 Med 16 ft. 2 480 70 69 69 0.143Level (float) 135 High 12 ft. 1 480 52 92 92 0.191Apply Soil Fumigant (Telone II) 145 Med 40 ft. 1 240 205 12 12 0.049Plant Operations:Bed (ridge) and apply Nematicide 110 Med 12 - 22 in. 1 240 104 23 23 0.096Plant Sugar beets 90 Low 12 - 22 in. 1.02 245 56 44 44 0.179Drill Grain 70 Low 15 ft. 1 480 64 75 75 0.157Corrugate 90 Low 15 ft. 1 480 87 55 55 0.115Grow Operations:Sprayers: Integral 4-Wheeler 21 ft. 2 480 113 43 0.089Trail 70 Low 40 ft. 1 480 205 23 23 0.049Ditches: Ditcher 110 Low 8 ft. 2 1 960 300 32 32 0.033Blade 90 Low 8 ft. 2 1 960 300 32 32 0.033Spray 70 Low 21 ft. 2 1 960 300 32 32 0.033Gated Pipe, put out & bring in 70 Low Wagon 1 1 720 213 34 34 0.047Tubes, put out & bring in 1 1 720 220 33 0.045Irrigate: Sugar beets, 1st time 1 240 10 240 1.000other sugar beet irrigations 6 1440 33 436 0.303Malt Barley, 1st time 1 480 14 343 0.714other malt barley irrigations 3 1440 40 360 0.250Side Dress (liquid nitrogen): Beets 90 Low Custom 1 240 113 21 21 0.089Cultivate: Sugar beets: 1st time 90 Low 12 row 1 240 64 38 38 0.156other times 90 Low 12 row 2 480 85 56 56 0.117Harvest Operations:Sugar beets: defoliate 135 Med 6 row 0.2 48 33 15 15 0.306Windrow (save tops) 145 Med 6 row 0.8 192 28 69 69 0.357Pull (dig) and Load 180 Med 6 row 1 240 37 64 64 0.268Windrow Malt Barley 14 ft. 0.5 240 64 37 0.155Bale Hay and Straw: big square 145 Med Baler 0.5 240 44 54 54 0.227round 90 Med Baler 0.5 240 44 54 54 0.227Load and Stack Big or Round Bales 110 Med Floader 1 480 90 53 53 0.111Combine Malt Barley Pickup 1 480 46 105 0.218Grain Auger 70 Low 10" x 50' 0.66 317 52 61 61 0.192Total Tractor and Man Hours 1767 3411Vehicle Operation Miles/load Tons/load Total milesTandem 12 to 16 16 12.6 5 54242 Ton 12 to 16 8 12.6 0.2 3120Pickups 9.6 4.8 46084-Wheelers 9.6 4.8 4608Motorcycles 12.8 6.4 614421
Table B2. Field Operations, Full-Season <strong>Radish</strong> (#2).<strong>Crop</strong>s and AcreageFullSugar Malt Seas.Tractor Fuel Implement Beets Bly. Rad. Total acres Acres per Hours Hours Hours/acreOperation(s) HP Work load Size 240 240 240 covered 10 hours Tractor Man 1 time overPre-plant Operations:Spread Fertilizer 90 Low custom 1 1 1 720 153 47 94 0.065Load Manure 110 Med loader 1 240 51 47 47 0.196Spread Manure 135 Low 370 Bu. 1 240 51 47 47 0.196Plow Heavy Draft 180 High 5 - 18's 1 1 480 33 147 147 0.306Tandem Disk 145 High 15 ft. 1 1 1 720 65 110 110 0.153Roller Harrow 1st time 145 High 15 ft. 1 1 480 73 66 66 0.138other times 135 Med 21 ft. 0 1 1 480 102 47 47 0.098Roller Harrow and Spray 110 Med 21 ft. 1 1 480 102 47 47 0.098Field Cultivate 135 High 18 ft. 1 240 102 24 24 0.098Level (float) 145 Med 16 ft. 2 480 70 69 69 0.143Level (float) 135 High 12 ft. 1 1 480 52 92 92 0.191Apply Soil Fumigant (Telone II) 145 Med 40 ft. 0 0 205 0 0 0.049Plant Operations:Bed (ridge) and Apply Nematicide 110 Med 12 - 22 in. 1 240 104 23 23 0.096Plant Sugar beets 90 Low 12 - 22 in. 1.02 245 56 44 44 0.179Drill Grain 70 Low 15 ft. 1 240 64 38 38 0.157Plant <strong>Radish</strong> 70 Low 15 ft. 1 240 64 38 38 0.157Corrugate 90 Low 15 ft. 1 1 480 87 55 55 0.115Grow Operation:Sprayers: Integral 4-Wheeler 21 ft. 2 480 113 43 0.089Trail 70 Low 40 ft. 1 240 205 12 12 0.049Ditches: Ditcher 110 Low 8 ft. 2 1 2 1200 300 40 40 0.033Blade 90 Low 8 ft. 2 1 1 960 300 32 32 0.033Spray 70 Low 21 ft. 2 1 1 960 300 32 32 0.033Gated Pipe, put out & bring in 70 Low Wagon 1 1 1 720 213 34 34 0.047Tubes, put out & bring in 1 1 1 720 220 33 0.045Irrigate: Sugar beets, 1st time 1 240 10 240 1.000other sugar beet irrigations 6 1440 33 436 0.303Malt Barley, 1st time 1 240 14 171 0.714other malt barley irrigations 3 720 40 180 0.250<strong>Radish</strong>, 1st time 1 240 14 171 0.714other radish irrigations 4 960 40 240 0.250Side Dress (liquid nitrogen): Beets 90 Low Custom 1 240 113 21 21 0.089Cultivate: Sugar beets: 1st time 90 Low 12 row 1 240 64 38 38 0.156other times 90 Low 12 row 2 480 85 56 56 0.117Harvest Operations:Sugar beets: Defoliate 135 Med 6 row 0.2 48 33 15 15 0.306Windrow (save tops) 145 Med 6 row 0.8 192 28 69 69 0.357Pull (dig) and Load 180 Med 6 row 1 240 37 64 64 0.268Malt Barley 14 ft. 0.5 120 64 19 0.155<strong>Radish</strong> 14 ft. 1 240 61 39 0.164Bale Hay and Straw: (big square ) 145 Med Baler 0.5 120 44 27 27 0.227(round) 90 Med Baler 0.5 120 44 27 27 0.227Load and Stack Big or Round Bales 110 Med Floader 1 240 90 27 27 0.111Combine Malt Barley Pickup 1 240 46 52 0.218Grain Auger 70 Low 10" x 50' 0.66 158 52 30 30 0.192Total Tractor and Man Hours 1463 3135Vehicle Operation: Miles/load Tons/load Total milesTandem 12 to 16 16 12.6 5 42242 Ton 12 to 16 8 12.6 0.2 3072Pickups 9.6 4.8 4.8 46084-Wheelers 9.6 4.8 4.8 4608Motorcycles 12.8 6.4 6.4 614422
Table B3. Field Operations, Second <strong>Crop</strong> <strong>Radish</strong> (#3).<strong>Crop</strong>s and AcreageSugar Malt M. Bly.Tractor Fuel Implement Beets Bly. & Rad. Total acres Acres per Hours Hours Hours/acreOperation(s) HP Work load Size 240 240 240 covered 10 hours Tractor Man 1 time overPre-plant Operations:Spread Fertilizer 90 Low custom 1 1 2 960 153 63 126 0.065Load Manure 110 Med loader 1 240 51 47 47 0.196Spread Manure 135 Low 370 Bu. 1 240 51 47 47 0.196Plow Heavy Draft 180 High 5 - 18's 1 1 1 720 33 220 220 0.306Tandem Disk 145 High 15 ft. 1 1 1 720 65 110 110 0.153Roller Harrow 1st time 145 High 15 ft. 1 1 1 720 73 99 99 0.138other times 135 Med 21 ft. 0 1 1 480 102 47 47 0.098Roller Harrow and Spray 110 Med 21 ft. 1 240 102 24 24 0.098Level (float) 145 Med 16 ft. 2 480 70 69 69 0.143Level (float) 135 High 12 ft. 1 1 480 52 92 92 0.191Apply Soil Fumigant (Telone II) 145 Med 40 ft. 0 0 205 0 0 0.049Plant Operations:Bed (ridge) and Apply Nematicide 110 Med 12 - 22 in. 1 240 104 23 23 0.096Plant Sugar beets 90 Low 12 - 22 in. 1.02 245 56 44 44 0.179Drill Grain 70 Low 15 ft. 1 1 480 64 75 75 0.157Plant <strong>Radish</strong> 70 Low 15 ft. 1 240 64 38 38 0.157Corrugate 90 Low 15 ft. 1 1 480 87 55 55 0.115Grow Operations:Sprayers: Integral 4-Wheeler 21 ft. 2 480 113 43 0.089Trail 70 Low 40 ft. 1 3 960 205 47 47 0.049Ditches: Ditcher 110 Low 8 ft. 2 1 2 1200 300 40 40 0.033Blade 90 Low 8 ft. 2 1 1 960 300 32 32 0.033Spray 70 Low 21 ft. 2 1 2 1200 300 40 40 0.033Gated Pipe, put out & bring in 70 Low Wagon 1 1 1 720 213 34 34 0.047Tubes, put out & bring in 1 1 1 720 220 33 0.045Irrigate: Sugar beets, 1st time 1 240 10 240 1.000other sugar beet irrigations 6 1440 33 436 0.303Malt Barley, 1st time 1 1 480 14 343 0.714other Malt Barley irrigations 3 3 1440 40 360 0.250<strong>Radish</strong> irrigations 2 480 40 120 0.250Side Dress (liquid nitrogen): Beets 90 Low Custom 1 240 113 21 21 0.089Cultivate: Sugar beets: 1st time 90 Low 12 row 1 240 64 38 38 0.156other times 90 Low 12 row 2 480 85 56 56 0.117Harvest Operations:Sugar beets: Defoliate 135 Med 6 row 0.2 48 33 15 15 0.306Windrow (save tops) 145 Med 6 row 0.8 192 28 69 69 0.357Pull (dig) and Load 180 Med 6 row 1 240 37 64 64 0.268Malt Barley 14 ft. 0.5 0.5 240 64 37 0.155<strong>Radish</strong> 14 ft. 0 61 0 0.164Bale Hay and Straw: (big square) 145 Med Baler 0.5 0.5 240 44 54 54 0.227(round) 90 Med Baler 0.5 0.5 240 44 54 54 0.227Load and Stack: Big or Round Bales 110 Med Loader 1 1 480 90 53 53 0.111Combine Malt Barley Pickup 1 1 480 46 105 0.218Grain Auger 70 Low 10" x 50' 0.66 0.66 317 52 61 61 0.192Total Tractor and Man Hours 1731 3510Vehicle Operation: Miles/load Tons/load Miles/acre Total milesTandem 12 to 16 16 12.6 5 5 54242 Ton 12 to 16 8 12.6 0.2 0.2 3120Pickups 9.6 4.8 6 48964-Wheelers 9.6 4.8 6 4896Motorcycles 12.8 6.4 8 652823
Table B4. Input Rates and Prices.1996 Price per Unit per Malt Malt Barley Full seasonItem Unit unit acre Sugar beets Barley plus <strong>Radish</strong> <strong>Radish</strong>Fertilizers:0 - 0 - 60 K ($180.00/ton) lb. $0.09 lb./acre 50 20 20Side Dress N (32% N, $213.00/ton) lb. $0.11 lb./acre 7011 - 52 - 0 N ($295.00/ton) lb. $0.15 lb./acre 120 70 70 10011 - 52 - 0 P2O5 ($295.00/ton) lb. $0.15 lb./acre 138 46 91Seeds:Sugar beet lb. $28.00 lb./acre 1Malt Barley lb. $0.18 lb./acre 110 110<strong>Radish</strong> ($77.00/50 lb bag) lb. $1.54 lb./acre 20 20Chemicals:Insecticides & Fumigants:Temik 15G ($335.00/cwt.) lb. $3.35 lb./acreLorsban 4E ($50.08/gallon) oz. $0.39 oz./acre 11Sevin XLR4 ($27.60/gallon) pint $3.45 pint/acre 3Telone II ($11.00/gallon) gal. $11.00 gal./acre 0Counter 15G ($177.00/cwt.) lb. $1.77 lb./acre 12Herbicides:Avenge 2S ($45.60/gallon) pint $5.70 pint/acre 3 3Betamix 0.6 x 3E ($91.90/gallon) oz. $0.72 oz./acre 24Prism 0.94 E ($95.00/gallon) oz. $0.74 oz./acre 10RO-NEET 6E ($56.83/gallon) pint $7.10 pint/acre 4Roundup 3S ($51.48/gallon) pint $6.44 pint/acre 1.5 1.5Stinger 3S ($465.07/gallon) oz. $3.63 oz./acre 4Treflan 4EC ($33.00/gallon) pint $4.13 pint/acre 1.52, 4 - D 3.8E ($12.51/gallon) pint $1.56 pint/acre 1.5 1.5Up-Beet 50DF ($42.00/ounce) oz. $42.00 oz./acre 0.333Labor, Operator & Hired: hour $8.00Contract:Weed Beets acre $25.00 times over 1Custom Services:Soil Tests field $27.50Aerial spray (2 gallons/acre) acre $5.50 times over 1Malt Barley per $100 $7.70 times over 2 2Miscellaneous:Bale Twine ($0.0025/foot) per bale $0.38 1 1Bale Wrap ($0.039/foot) per bale $0.78 1 1Interest Rates:Land & Machinery percent 7%Operating Capital percent 9%24
APPENDIX CDetailed <strong>Crop</strong> and Lamb Enterprise Budgetsfor Selected Farming Systems
Table C1. Sugar Beets (from Table 1).27
Table C2. Malt Barley (from Table 1).28
29Table C3. <strong>Lambs</strong> (from Table 1).
Table C4. Sugar Beets (from Table 2).30
Table C5. Malt Barley (from Table 2).31
32Table C6. Full-Season <strong>Radish</strong> (from Table 2).
33Table C7. <strong>Lambs</strong> (from Table 2).
Table C8. Sugar Beets (from Table 3).34
Table C9. Malt Barley (from Table 3).35
Table C10. Malt Barley Plus 2nd <strong>Crop</strong> <strong>Radish</strong> (from Table 3).36
37Table C11. <strong>Lambs</strong> (from Table 3).
APPENDIX DAnnual and 12-year Average (1985-96)Lamb and <strong>Crop</strong> Pricesand <strong>Crop</strong> Yields


