Water Quality for Wyoming Livestock & Wildlife - Coming Soon!
Water Quality for Wyoming Livestock & Wildlife - Coming Soon!
Water Quality for Wyoming Livestock & Wildlife - Coming Soon!

Create successful ePaper yourself
Turn your PDF publications into a flip-book with our unique Google optimized e-Paper software.
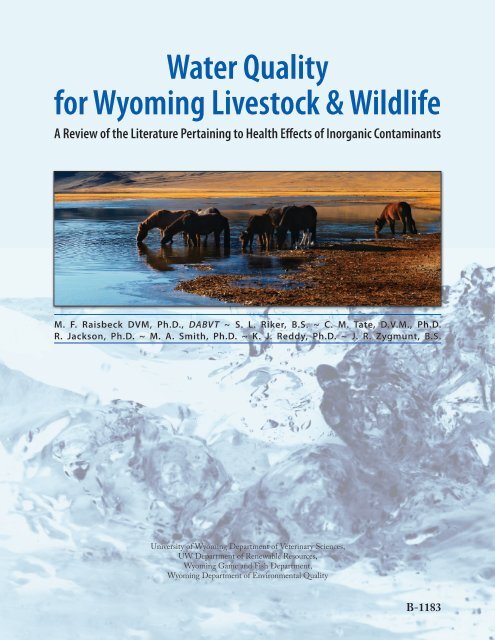
<strong>Water</strong> <strong>Quality</strong><strong>for</strong> <strong>Wyoming</strong> <strong>Livestock</strong> & <strong>Wildlife</strong>A Review of the Literature Pertaining to Health Effects of Inorganic ContaminantsM. F. Raisbeck DVM, Ph.D., DABVT ~ S. L. Riker, B.S. ~ C. M. Tate, D.V.M., Ph.D.R. Jackson, Ph.D. ~ M. A. Smith, Ph.D. ~ K. J. Reddy, Ph.D. ~ J. R. Zygmunt, B.S.University of <strong>Wyoming</strong> Department of Veterinary Sciences,UW Department of Renewable Resources,<strong>Wyoming</strong> Game and Fish Department,<strong>Wyoming</strong> Department of Environmental <strong>Quality</strong>B-1183
AcknowledgementsThe authors would like to thank the <strong>Wyoming</strong> Department of Environmental <strong>Quality</strong> <strong>for</strong> providing the fundingneeded to complete the report and Louise Smithson and Rebecca Dailey from the <strong>Wyoming</strong> State Veterinary Laboratoryand Robert Waggener, editor in the UW College of Agriculture, <strong>for</strong> the many hours they invested in editing. Wethank Bernadette van der Vliet, graphic designer in the College of Agriculture, <strong>for</strong> her work on layout and design. Wewould also like to acknowledge the following colleagues who reviewed the report and offered constructive criticismand suggestions.Michelle Mostrom, D.V.M., M.S., Ph.D., DABVTVeterinary Toxicologist, North Dakota State UniversityJohn C. Reagor, M.S., Ph.D.Head, Diagnostic Toxicology, Texas Veterinary Medical Diagnostic Laboratory, Texas A&M UniversityMichael Carlson, M.S., Ph.D.Toxicology Analytical Chemist and Lecturer, University of Nebraska-LincolnPatricia Talcott, D.V.M., Ph.D., DABVTAssociate Professor of Veterinary Toxicology, Washington State Universityii
AbbreviationsADG – average daily gainAs – arsenicBa – bariumBW – body weightC – CelsiusCNS – central nervous systemCp – ceruloplasminCu – copperDM – dry matterDMA – dimethylarsonous acidDMI – dry matter intakeECF – extracellular fluidECG – electrocardiogramEPA – U.S. Environmental Protection AgencyEU – European UnionF – FahrenheitF – fluorineFDA – U.S. Food and Drug Administrationg – gramG.I. tract – gastrointestinal tractGSH – glutathioneHb – hemoglobinHDL – high-density lipoproteinHg – mercuryH 2S – hydrogen sulfideIV – intravenouskg – kilogramL – literlb – poundLD 50– Dose which is lethal in 50% of the testedpopulationLD 0– Largest non-lethal dose in tested population(theoretical)meq – milliequivalentMetHb – methemoglobinmg – milligrammM – millimoleMMA – monomethylarsonous acidMo – molybdenumMT – metallothioneinN – nitrogenNa – sodiumnAChR – nicotinic acetylcholine receptorNaCl – sodium chlorideNOAEL – no observed adverse effect levelNO 3-– nitrateNO 2-– nitriteNRC – National Research CouncilPEM – polioencephalomalaciappm – parts per millionppb – parts per billion% – percentROS – reactive oxygen speciesS – sulfurSe – seleniumSOLD 50– single oral median lethal doseT 1/2– biological half-lifeTCA – trichloroacetic acidTDS – total dissolved solidsTM – thiomolybdatesUSDA – U.S. Department of AgricultureWSVL – <strong>Wyoming</strong> State Veterinary Laboratoryiii
ContentsAcknowledgements .Abbreviations .Contents .iiiiiV1 Introduction 12 Arsenic 5Essentiality . 5Metabolism . 5Toxicity . 6Summary. 83 Barium 11Essentiality . 11Metabolism . 11Toxicity . 11Summary. 134 Fluoride 15Essentiality . 15Metabolism . 15Toxicity . 15Summary. 185 Molybdenum 21Essentiality . 21Metabolism . 21Toxicity . 22Summary. 246 Nitrate and Nitrite 25Essentiality . 25Metabolism . 25Toxicity . 25Summary. 28v
7 pH 31Function. . . . . . . . . . . . . . . . . . . . . . . . . . . . . 31Metabolism . 31Toxicity . 31Summary. 328 Selenium 35Essentiality . 35Metabolism . 35Toxicity . 36Summary. 389 Sodium Chloride 41Essentiality . 41Metabolism . 41Toxicity . 41Summary. 4310 Sulfur 45Essentiality . 45Metabolism . 45Toxicity . 46Summary. 4711 Total Dissolved Solids (TDS) 49Essentiality . 49Metabolism . 49Toxicity . 49Summary. 5012 Summary 5113 Research Needs 5314 Bibliography 55vi
1 Introduction<strong>Water</strong> is the single most important nutrient <strong>for</strong> livestockand big game wildlife species. It is the most abundantingredient of the animal body in all phases of growth anddevelopment. A calf’s body contains 75 to 80% waterat birth and about 55 to 65% water at maturity. Whileanimals can survive <strong>for</strong> a week or more without food,death is likely in a matter of days without adequate waterintake. <strong>Water</strong> is involved either directly or indirectlyin virtually every physiologic process essential to life.<strong>Water</strong> is the medium in which all chemical reactions inthe body take place. Blood, which contains 80% water,is vital in transporting oxygen to the tissues and carbondioxide from the tissues as well as being the life supportsystem <strong>for</strong> the body. It is the medium <strong>for</strong> transportingnutrients, metabolic wastes, and chemical messengers,such as hormones, throughout the body. It provides thechemical base <strong>for</strong> nutrient digestion and uptake from theGI tract and <strong>for</strong> the elimination of waste products viaurine and bile. <strong>Water</strong>’s physical properties make it animportant factor in the transfer of heat and the regulationof temperature in the body. Due to its high specificheat (the ability to absorb or give off heat with a relativelysmall change in temperature), water is ideally suited as atemperature buffering system <strong>for</strong> the body. A restrictionof water intake lowers feed intake and N retention (i.e.protein), and it increases N loss in the feces. It also resultsin increased excretion of urea in the urine. Animalsmay survive a loss of nearly all the fat and about one-halfof bodily protein, but a loss of about one-tenth of waterfrom the body results in death.Obviously, an adequate supply of clean water is necessaryto the health of all animals, including human beings.Under most management systems, water is the cheapestand most readily available nutrient. Un<strong>for</strong>tunately, andprobably because of this fact, it is also the most overlookednutrient. Sources of water include those obtainedfrom wells or surface runoff, water contained in feedstuffs(lush grass may consist of as much as 75% water) andmetabolic water obtained from the oxidation of fat andprotein in the body. In the arid western United States,good quality water is a scarce commodity, and livestockand wildlife are often <strong>for</strong>ced to survive on what mightbe charitably described as “less-than-perfect” water dueto competition from urbanization, mineral extraction,etc. In most cases, these animals do surprisingly well, butpoor quality water has resulted in acute illness and death.It also robs producers via decreased per<strong>for</strong>mance (growth,reproduction). Thus, awareness of water quality issueshas increased as the competition <strong>for</strong> resources intensifies.Ranchers, wildlife managers, conservationists, veterinarians,cooperative extension personnel, animal owners, andothers need to know whether a particular source of wateris safe. One of the more common questions fielded byour laboratories is “what is X ppm of Y in the water goingto do to my cattle (horses, deer, etc.)?”<strong>Water</strong> consumption is influenced by many factors, includinggenetics (species, breed), age, body size, ambienttemperature and humidity, water temperature, and levelof production. For example, cattle (a species that hasbeen studied extensively) consume an average of 2 to 4kg of water <strong>for</strong> each kg of dry matter consumed and anadditional 3 to 5 kg of water per kg of milk produced;however, this average varies dramatically with temperature,especially when the environmental temperatureexceeds the thermo-neutral range (5-20 C in cattle) makinganimals lose increasing amounts of water via respirationand sweating. For example, a 273-kg (600 lb) feedersteer drinks 22.7 L at 5 C or below; at 21 C (70 F), heneeds 33 L but at 30 C (roughly 86 F) he requires 54 Lor 20% of his body weight per day. 1 At 39 C (roughly102 F), he would require 116 L. 2 Rations high in Na,fiber, or protein also increase water requirements. 1,3 Forexample, horses consume twice as much water while on ahay diet compared to a high concentrate diet at the sametemperature. 4 The level of production is a very importantfactor in water requirements. A lactating beef cow requiresnearly twice as much water (64 L or about 16% ofher body weight) per day at 21 C as the same cow (32.9L, 9% body weight) when dry (not lactating) at the sametemperature, and a high-producing dairy cow of similarsize needs 90 L, or nearly 20% of her body weight underthe same conditions. 1,5 At 32 C, she may drink as muchas 40% of her body weight. 1,6The amount (dose) of any water-borne toxicant ingestedby a given animal is determined by the concentration ofthe substance in water and by the amount of water the1
animal drinks. <strong>Water</strong> intake is technically defined as freedrinkingwater plus the amount contained in feedstuffs;however, <strong>for</strong> purposes of simplicity in this report, wehave assumed animals are consuming air-dried hay orsenescent <strong>for</strong>age with a minimal (10%) water contentand will use the term “intake” to describe the amountof water consumed voluntarily by animals from streams,ponds, etc. The amount an animal drinks is determinedby true thirst and appetite. By definition, true thirst isthe physiologic drive to consume sufficient water to meetminimum metabolic needs; however, most animals alsoexhibit an “appetite” <strong>for</strong> water and consume more than isstrictly necessarily to satisfy thirst. 7 Reasons <strong>for</strong> the latterare many, varied, and do not lend themselves to quantitativeprediction. We there<strong>for</strong>e disregarded appetite incalculating doses from water intake but instead used fairlyconservative estimates of thirst in such calculations bydisregarding <strong>for</strong>age water content. Most calculations ofpotential toxic doses in this report are thus based upon273 kg (600 lb) feeder cattle that drink approximately20% of their body weight, or about 8 L per kg of dietarydry matter, per day, at 32 C (90 F). This may not provideadequate protection <strong>for</strong> high-producing dairy cattle,which drink significantly more under similar environmentalconditions, but is reasonably conservative <strong>for</strong>range livestock (beef and sheep) and weather conditionstypical of <strong>Wyoming</strong>. Higher temperatures would also resultin higher consumption than our “standard” steer, butsustained periods of such weather are not that commonin <strong>Wyoming</strong>. 8 Finally, there is virtually no in<strong>for</strong>mation onwater consumption by the major wildlife species coveredin this report, but it is reasonable to assume that speciesthat evolved in the northern Great Plains would not havegreater requirements than domestic cattle.This report is targeted at domestic livestock and wildlife(beef cattle, horses, sheep, deer, elk, and pronghornantelope) that rely upon wells, ponds, streams, and otherwater sources on <strong>Wyoming</strong>’s ranges. Although we havemade note of data related to swine where we found them,virtually all modern swine are raised in intensive operationsthat draw water from systems (municipal, waterdistrict, etc.) that are maintained according to humandrinking water standards. Similarly, “alternative agricultural”species such as llamas and bison are not included,in part because of a scarcity of data.<strong>Water</strong> quality is commonly evaluated by chemicalmethods that have been designed to be very reproducibleand very specific. As a result, the process of analyzingwater is fairly straight<strong>for</strong>ward, and many tests are readilyavailable, commercially. Un<strong>for</strong>tunately, translating thesevery precise, <strong>for</strong>mal, data to practical recommendations<strong>for</strong> livestock and wildlife is less cut and dried. As notedby Dr. Art Case, the dean of veterinary toxicologists,“sometimes the cow just didn’t read the book.” First,many toxicants in water act additively with the sametoxicant in feedstuffs. In most such cases, the bottomline is not necessarily the water concentration but ratherthe total mg of toxicant ingested per kg of the animal’sbody weight (commonly expressed as “mg X/kg BW”).Throughout this report, we have tried to use realistic estimatesof total dietary concentrations of such toxicants tocalculate the water concentration of the toxicant requiredto potentially cause problems.Second, chemical water quality tests do not usuallymeasure the specific chemical <strong>for</strong>m of the toxicant present.For example, Se as selenite or selenate behaves quitedifferently in the mammalian body than does selenomethionine,but the typical laboratory just reports total Se.Where possible, we have based recommendations uponthe chemical <strong>for</strong>m most likely to be present in typicalsurface waters in <strong>Wyoming</strong> and noted any caveats thatshould be considered if the water source is not “typical”.In the absence of other data, we have assumed the freeion in water is equivalent on a mg/kg BW basis to thesame chemical in feedstuffs.Third, typical chemical tests do not differentiate betweenanimal species. Some substances are more toxic in ruminantsthan monogastrics (simple-stomached animals) asa result of their unique physiology; some are less. Whilewe have tried to identify significant differences wherethey exist, our recommendations are based upon themost sensitive of our species of interest.Fourth, many toxic substances interact with othertoxicants and/or nutrients in the diet. We have tried toenumerate such interactions in the narrative if they arewell documented and, where possible, account <strong>for</strong> themin the “bottom line” calculations of acceptable waterconcentrations.Finally, the rate of exposure influences the potency ofmany toxicants. A bolus dose of nitrate (NO 3), givenvia a stomach tube, is much more toxic than the sameamount spread over an entire day’s grazing. Undersummer range conditions typical of the Great Plains,livestock drink once, or, at most, twice a day. <strong>Wildlife</strong>typically trek to water and drink their fill during themorning and evening twilight. We have, there<strong>for</strong>e,assumed all of the water-borne daily dose of a given2
substance will be consumed during a fairly short period,once or twice a day.<strong>Water</strong> quality constituents in this report were drawn fromcommon water quality guidelines, prioritized accordingto how closely, in our experience, existing <strong>Wyoming</strong>concentrations approached these guidelines and howoften the elements in question caused poisoning in<strong>Wyoming</strong> animals. For example, Hg is much more toxicthan many of the elements we studied, but it is rarelypresent at detectable concentrations in <strong>Wyoming</strong> watersurveys. Copper is a real problem in aquatic organisms,but Cu deficiency is a much bigger problem in livestockthan Cu toxicity. We then worked our way as far downthis prioritized list as time permitted. Obviously, thereare more constituents on our list than we were able toexamine, but we believe we covered those most importantto <strong>Wyoming</strong>.Data used in compiling this report are drawn primarilyfrom scientific literature, including refereed journals,texts, proceedings, abstracts, and theses, with an emphasison material published during the last 20 years. The basicstrategy consisted of 1) searching biomedical databases(e.g. Medline, CAB Abstracts, etc.) <strong>for</strong> reports of toxicityin any species, 2) examining bibliographies of relevantpapers <strong>for</strong> new leads, and, finally 3) <strong>for</strong>ward searching(e.g. Science Citation Index) <strong>for</strong> more recent papers thatcite earlier work on a given topic. We also solicited welldocumentedanecdotal data (i.e. field reports) from colleaguesat other research and/or diagnostic institutions.Where possible, we tried to validate secondary sources(e.g. reviews, texts) by examining primary documentsfrom which they were drawn. If sufficient data existed <strong>for</strong>our principle species of interest (beef cattle, horses, sheep,elk, deer, and antelope) we focused on those reports. Ifnot, we attempted to extrapolate from rodents, humans,etc., being careful to identify the uncertainty factors inherentin such extrapolations. Each source was assigneda rating <strong>for</strong> reliability, with peer-reviewed, experimentalstudies usually, but not always, being considered morereliable.As noted previously, the interaction of water quality andanimal health is considerably more complex than just“X” mg of “Y” per L of water. For example, many factorshave been suggested to influence the palatability of water<strong>for</strong> animals. Decreased consumption due to bad tasteis potentially just as harmful as water deprivation 3 , yetthe state of the art regarding palatability is still largelyqualitative and anecdotal. Acid pH may mobilize toxicmetals from plumbing or soil, but the particular effectof a given pH is obviously very dependent on the localsituation. A sudden transition to pure water after severalweeks on highly saline water may result in so-called “saltpoisoning.” Where adequate, quantitative data exists <strong>for</strong>non-directly toxic adverse effects on health, we have incorporatedthem into the final recommendations. Wherethere is substantial evidence suggesting such effects exist,but no reproducible, quantitative data were available, wetried to mention the existence of such effects but have notfactored them into the final recommendations.Safety margins are a matter of judgment rather thanan exact science. The purpose of safety margins is tocompensate <strong>for</strong> unknown, or unknowable, variables intoxicology data such as genetic variability, sex, life stage,duration of exposure, un<strong>for</strong>eseen interactions with othertoxicants, etc. The standard practice in setting humandrinking water standards <strong>for</strong> non-carcinogens has been todivide the geometric mean of the NOAEL and minimumtoxic dose by 10 to 1,000 depending upon whetherthe data are derived from human exposure, multiplenon-human species, or incomplete data in any species.Another approach used in the past has been to set the safelimit at the upper end of the range commonly reportedin natural waters as was done with Se. 2 Both approaches,while unarguably “safe,” ignore the realities of livestockproduction in the western United States. <strong>Water</strong> that is so“perfect” as to meet these theoretically desirable criteriahas already been taken <strong>for</strong> other uses. In this report wehave taken the approach of presenting our best estimateof the NOAEL (i.e. will not produce any measurabledecrease in per<strong>for</strong>mance in the most sensitive class ofanimal) under a very conservative set of assumptionsappropriate to <strong>Wyoming</strong> and allowing readers to maketheir own judgment regarding “safety” margins.The final report, together with the documents it wasdrawn from, was <strong>for</strong>warded to colleagues at four otheruniversities (Washington State University, Universityof Nebraska, North Dakota State University, and TexasA&M University) <strong>for</strong> peer review. Their comments wereconsidered and incorporated into the final document.Although there are many ways of expressing measurementsregarding water quality and toxicology, we havechosen to use the following conventions. The dose of atoxicant that causes some particular effect is expressed inmilligrams of substance per kilogram of body weight or“mg X/kg BW”. The concentration of a substance in wateris expressed as milligrams of substance per liter of wa-3
ter or “mg X/L”. If the substance is ionized, and the ionis important in terms of toxic effects, it will be describedwith the standard scientific abbreviation <strong>for</strong> the ion, e.g.“NO 3-”. Similarly the concentration of a toxicant occurringin dry feedstuffs will be described in terms of partsper million or ppm. Single elements are abbreviated withthe standard chemical symbol (e.g. “Se” <strong>for</strong> selenium).This report, and the project that created it, was fundedby the <strong>Wyoming</strong> Department of Environmental <strong>Quality</strong>.Although the authors anticipate they will find the in<strong>for</strong>mationuseful, our intended audience is much broaderand includes ranchers, wildlife managers, conservationists,veterinarians, cooperative extension personnel, animalowners, and others. The last concerted ef<strong>for</strong>t in theUnited States to summarize the literature regarding waterquality <strong>for</strong> animals occurred more than 30 years ago 2 ,and there have been many additions to the knowledgebase since that time. We believe this report represents areasonable starting point <strong>for</strong> evaluating the adequacy ofwater quality <strong>for</strong> animals.4
2 ArsenicArsenic (As) is a metalloid that occurs naturally in waterand soil. It is also released from a number of humanactivities including mining, petroleum and natural gasextraction, wood preservation, and burning coal. 9-16Although As is rare in nature as a pure element, both inorganicand organic <strong>for</strong>ms of As are commonly found ina number of different oxidation states, of which two (+3and +5) occur in soil, water, and vegetation. Inorganic<strong>for</strong>ms of As III (e.g. the arsenite ion) may be found underreducing conditions; however, As V (e.g. the arsenate ion)predominates in surface waters containing considerabledissolved oxygen. 17 Organic arsenical compounds havealso been used as herbicides, insecticides, and drugs.Arsenic was one of the first drugs to be used successfullyagainst the syphilis organism in humans. The organicarsenical roxarsone (4-hydroxy-3-nitrobenzenearsonicacid) is still used to control coccidia in poultry and swine.More recently, arsenic trioxide (As 2O 3) has been suggested<strong>for</strong> treatment of promyelocytic leukemia and multiplemyeloma. 18Most of what was known about the toxicity of As priorto the 1980s was based upon the direct cytotoxic effectsof As. 19 More recently, however, chronic consumptionof low-level As-contaminated drinking water hasbecome associated with a variety of chronic maladies inhuman beings, including cardiovascular disease, “blackfootdisease,” diabetes mellitus, spontaneous abortion,and, especially, cancer. 9,20-22 Conversely, some reports 23,24suggest a hormetic (beneficial) effect of As at very lowdoses. So far the majority of the evidence <strong>for</strong> chroniceffects in humans consists of epidemiological studies, butmechanistic, toxicologic explanations are appearing in theliterature. The latter are important because they suggestthese effects (and there<strong>for</strong>e dosages) are not likely relevantto our species of interest (see below <strong>for</strong> details).The nomenclature of the arsenicals is often bewildering.In this text, the following conventions are used: thetrivalent, methylated metabolites (mono)methylarsonousacid, and dimethylarsonous acid will be abbreviated asMMA III and DMA III , the pentavalent metabolites (mono)methylarsonic acid, and dimethylarsinic acid as MMA Vand DMA V , and the inorganic ions such as arsenite andarsenate as iAs III and iAs V .EssentialityAlthough the physiological function(s) of As remainsunknown, experiments with As deprivation in manyspecies suggest As may be an essential element. 25 Forexample, rats maintained on a diet containing 30 ppb Asexhibited decreased growth rate, rough hair coats, anddecreased hematocrit levels when compared to controlssupplemented with 4.5 ppm As. 26 Lactating goatsconsuming a diet containing less than 10 ppb As haddecreased growth rates, decreased milk production, lowerbirth weights, and a higher incidence of mortality. 27Female miniature pigs on a low As diet produced smallerpiglets, and only 62% of pigs were reported to give birthwhen compared to pigs supplemented with 350 ppbAs. 27 The results of experimentally induced deprivationin both in vivo and in vitro experiments suggest As playsa role in the methylation of both proteins and geneticmolecules. 25 Although this and other, similar researchis scientifically interesting, As deficiency has never beendemonstrated in nature, probably because the apparentnutritional requirements are considerably lower thancommon background concentrations.MetabolismIt is commonly accepted that, with the possible exceptionof the trivalent methylated metabolites (MMA IIIand DMA III ), the inorganic <strong>for</strong>ms of As are considerablymore toxic in mammals than organic arsenicals. 20,25,28-30Since the inorganic <strong>for</strong>ms are also by far the most commoncontaminants of water under field conditions andbecause MMA III and DMA III are too unstable to persist<strong>for</strong> any length of time under natural conditions, thisreview will focus upon exposure to the inorganic <strong>for</strong>msof As III and As V . Arsenate is absorbed from the gut by atwo-stage process. First, it is concentrated in mucosalcells then, as binding sites become filled, it moves downthe resulting concentration gradient into the portalcirculation. 25 The absorption mechanism of iAs III is lesscompletely understood, but it is commonly accepted thatiAs III is even more readily absorbed than iAs V , probablybecause of its greater water solubility. 17 Once absorbed,As is transported to various tissues via blood. Distribu-5
tion between the erythrocytic and plasma componentsof blood depends upon the dose of As given, the speciesof animal, and the valence of administered As. Ingeneral plasma concentrations increase relative to red cellconcentrations as the dose increases, and trivalent As hasa higher affinity <strong>for</strong> erythrocytes than As V , resulting inslower clearance. Humans, rats, and mice have highererythrocyte binding than other domestic mammals, alsoresulting in slower elimination. 17,27The metabolism and excretion of As varies significantlybetween species and between genotypes within thehuman species. 27,31-33 These species-specific differencesin metabolism are important in the pathogenesis of Asintoxication in any given species. 17,27 Generally speaking,inorganic As is methylated in vivo via a series ofsequential reduction and oxidative-methylation reactions.Inorganic As V is reduced in a linked reactionwith oxidation of reduced glutathione (GSH) to iAs III ,which is then methylated to MMA V by reaction with S-adenysylmethionine. Monomethylarsonic acid (MMA V )is, in turn, reduced and methylated to DMA V and so<strong>for</strong>th. 22 These metabolites are more readily excreted thaninorganic As. In many, but not all, mammalian species,this process proceeds to DMA V or the trimethyl arsenicmetabolite trimethylarsine oxide (TMAO); however,in human beings, significant amounts of MMA III andDMA III apparently escape methylation and react withcritical tissue components. The rate of methylation andphysiologic site of metabolism are thus important determinantsof the rate of elimination and the potential <strong>for</strong>chronic effects at very low doses. 22,29As interacts with many other dietary factors, resultingin either increased or decreased toxicity. As has beenknown to minimize the toxicity of Se <strong>for</strong> many years. 34-37When As is fed with Se, the excretion of both elementsin feces is enhanced. 37,38 Simultaneous administrationof Zn lessened the toxicity of As-spiked drinking water,possibly by induction of metallothionein, a metal bindingprotein. 22,39 Folate can affect As methylation and bothfolate deficiency and excess As induce fetal mal<strong>for</strong>mationsin rats, thus a dietary deficiency of folate potentiates Astoxicity. 22,40ToxicityThe acute toxicity of inorganic As has been attributedto the generation of reactive oxygen species (ROS) andoxidative stress 18,21,39 , to the denaturation of critical proteinmoieties, and to interfering with phosphate metabolism.17,41 In virtually all models, iAs III is reported to beseveral fold more toxic than iAs V . 28,30,41,42 Trivalent iAs IIIexerts its toxic effects by binding with specific functionalgroups (thiols and vicinyl sulfhydryls) on enzymes, receptorproteins, etc. 10,17,27,43 For example, mitochondrialrespiration is blocked by the reaction between As III andthe dihydrolipoic acid cofactor required <strong>for</strong> substrateoxidation. 41 As cited by Thomas et al. 44 , in 1966 Webblisted more than 100 enzymes that were inhibited byAs III . Pentavalent As V , because of its chemical similaritywith the phosphate ion, displaces phosphate from certainbiochemical reactions, e.g. oxidative phosphorylation,resulting in depletion of ATP 10,41,43-45 , but it may also beconverted to As III in vivo (i.e. in tissues) and in the rumen.45 The clinical signs associated with acute toxicity invirtually all species include diarrhea, vomiting, abdominalpain, weakness, staggering gait, myocardial degeneration,and, in some cases, death. 17,25,30,43,45Most acute As toxicity results from accidental exposureas a result of improper handling, use, and/or storage ofarsenical compounds. 13,15,45 Cattle began staggering andshowing signs of abdominal pain, diarrhea, anorexia, andrecumbency shortly after ingesting <strong>for</strong>age that had beensprayed with sodium arsenite (NaAsO 2). Analysis of thegrass per<strong>for</strong>med several days later revealed it contained 2ppm As, but the author noted concentrations were probablyhigher immediately after spraying. 46 Cows and calvesbecame recumbent and exhibited a rapid weak pulse,intermittent clonic convulsions, and paddling movementsafter drinking fluid from a dipping vat containing 200mg As/L. 47 A herd of approximately 275 cattle allowedto graze a road right of way recently sprayed with sodiumarsenate (Na 2HAsO 4) sickened within hours, and80 died within four days. Samples of grass taken at theonset contained 10,500 ppm As. 14 Selby et al. reported asimilar scenario in Missouri in which the toxic vegetationcontained 440 ppm As. 48 Cattle that consumed watercontaining 6-20 mg As/L and silage contaminated with140 ppm As became progressively weaker, emaciated, andrecumbent, had decreased milk production, and eventuallydied after several days. 49 Nine adult cattle developedacute hemorrhagic diarrhea, and two eventually diedafter consuming a dairy premix containing 5.50 ppm As;however, the As concentration of G.I. contents suggeststhe exposure may have been considerably higher. 50 Heifersbecame weak, recumbent, dysenteric, and died afteringesting vegetation containing approximately 2,000ppm As from herbicide contamination. 51 Approximately12 hours after consuming pellets containing 27,0006
ppm As and 20 ppm metaldehyde, cattle developedataxia, profuse diarrhea, and muscle fasciculations. 52 Theauthors suggested that most of the toxic effects were dueto As because the predominate clinical signs did not fitmetaldehyde.The toxicity of the herbicide, lead arsenate (PbHAsO 4),is thought to be due to the As content rather than Pb. 53-55After licking bags containing PbHAsO 4, cattle exhibitedrapid pulse and respiration, oral mucosal erosions, diarrhea,and decreased milk production. Arsenic toxicitywas confirmed when stomach contents were found tohave 175 ppm As. 53 Yearling cattle exhibited severe colic,diarrhea, and death after consuming an undeterminedamount of a powder containing 39% Pb and 10% As.Rumen contents from the animals contained 478-531ppm As. 56 Five calves began showing signs of lethargy,ataxia, anorexia, decreased heart rates, and diarrhea afterconsuming powder containing 700,000 ppm As 2O 3.Four of the animals eventually died. 57 Cattle receiving67 g As 2O 3and calves receiving 17 g As 2O 3as a topicallyapplied medication became depressed and exhibitedbloody diarrhea and a staggering gait soon after treatment.By 20 hours post treatment, 94 of 101 animalswere dead. 58 Depression, ataxia, weakness, recumbency,diarrhea, abdominal pain, and tachycardia developed in15 cattle that ingested ash from As-preserved wood. Theash was found to contain 780 ppm As. 59 After 260 heiferswere moved to a new pasture containing an abandonedcattle dip, they became restless and belligerent and beganshowing signs of profuse salivation and watery diarrhea.(<strong>Water</strong>y diarrhea is extremely dilute and may even beclear; it’s usually a result of runaway secretory processesin the bowel.) More than 50% of the herd exhibitedconvulsions and became comatose, and 67 eventuallydied. The soil around the dip contained 10-150 ppm Asand 50-500 ppm toxaphene. The authors suggested that,because tissue As concentrations were not diagnosticallysignificant, the combination of As and toxaphene causedthe die-off. 60 Experimentally, four of five cattle diedwithin 10 days of being dosed with 10 mg As V /kg BW/day as monosodium methanearsonate. 61More than 650 of 1,000 sheep developed diarrhea anddied after consuming vegetation that had been sprayedwith a PbHAsO 4solution containing 0.58 % As. 62 Thecondition was reproduced by dosing lambs with 12 mgAs/kg BW. 62 Lambs showed signs of depression, abdominalpain, salivation, and diarrhea after ingesting <strong>for</strong>agecontaining 62-95 ppm As due to contamination witha cotton defoliant; 172 of 923 lambs died. 63 Six doewhite-tailed deer were found dead after eating soil andvegetation contaminated by aerial spraying of an arsenicalherbicide at the rate of 1.6 lbs As per acre. Later analysisof a combined soil and vegetation sample yielded 2.4ppm As, and water samples yielded 0.36-0.48 mg As/L. 64The application rate, however, calculates to a <strong>for</strong>ageconcentration of approximately 368 ppm or a dosage ofapproximately 11 mg As/kg BW in an animal consuming3 % BW daily. The latter numbers are more consistentwith reported tissue concentrations (18-19 ppm As) inthe dead deer than the soil and water analysis.Arsenic poisoning has also been reported in monogastrics.Nine thoroughbred racehorses died after showing signs ofextreme distress, weakness, colic, rapid, weak pulse, hyperemicmucous membranes, and watery diarrhea. It wasdiscovered that roughly 8 oz. of arsenical rat poison hadspilled into their corn bin. Post mortem chemical analysisdiscovered significant amounts of As in the stomach andliver of two horses. 65 Working backward from the numberspresented, we estimate the horses received a dose ofbetween 1-10 mg As/kg BW. Gastrointestinal cramps,vomiting, diarrhea, ECG changes, and liver disruptiondeveloped in a 27-year-old woman after she ingested9,000 mg As 2O 3. 66 Furr and Buck 67 poisoned cats with acommercial ant bait. Doses of As (as Na 2HAsO 4) greaterthan 8 mg/kg BW were lethal; the threshold of toxic signswas 2 mg/kg BW, and the no-effect level was 1.5 mg/kgBW.In swine, arsanilic acid has been frequently used as agrowth promotant and as a treatment <strong>for</strong> swine dysentery.In several cases, excessive doses or prolonged treatmentperiods have resulted in a chronic syndrome characterizedby apparent blindness due to degeneration of the opticnerve and optic chiasma. 68-74 The toxic mechanism andtoxicity of this class of arsenical drugs are quite distinctfrom and less than inorganic As and will there<strong>for</strong>e not beconsidered further.At present, despite convincing epidemiologic evidencethat very low concentrations of As in drinking water cancause chronic disease, especially cancer, in human beings,there are no animal models that reliably duplicate theseparticular toxic effects without resorting to relatively highdoses and/or pharmacologic and genetic manipulationto render them more sensitive. 19,33 The current belief,derived from in vitro studies and specialized laboratoryanimal models, is that small amounts of DMA III andMMA III escape the methylation process in people and,over prolonged periods, cause cellular damage that results7
in diseases such as cancer. 10,20,23,32,33,41,44 Dimethylarsinicacid (DMA V ) and monomethylarsonoic acid (MMA V )are the main urinary metabolites of As excreted in mostmammals; however, the trivalent As metabolites, dimethylarsinousacid (DMA III ), and monomethylarsonousacid (MMA III ) have been discovered in fresh urine of Aspoisonedhuman patients. 20 The glutathione conjugateof DMA III was actually more toxic to cells in vitro thaninorganic As 20 , and DMA III causes single-strand breaks inDNA in vitro. 20,75 These processes are apparently limitedto human beings and specialized laboratory models; thus,based upon known differences in metabolism, this class ofdisease and dosages does not seem relevant <strong>for</strong> livestockand big game animals.Developmental studies of orally administered MMA V andDMA V (the metabolites of inorganic As in most nonhumanmammals) in rats and rabbits determined thethreshold of fetal damage was similar to that <strong>for</strong> maternaltoxicity or about 36 and 48 mg/kg BW, respectively. 76Administration of As by gavage to pregnant rats and micedid not produce morphologically evident teratogenesis atnon-maternally toxic dosages, although there was someevidence of behavioral changes in pups born to damsconsuming drinking water with slightly less As III than thelowest maternally toxic dose. 22 Conversely, Domingo 77reported that As III , via the oral route of exposure, wasmuch less teratogenic in several species. This indicatesthat dietary limits safe <strong>for</strong> a dam should also provideadequate protection <strong>for</strong> her fetus.There are very few reports of chronic toxicity in non-rodentanimals. Due to the rapid excretion of As in cattle,sheep, dogs, etc., these species are able to clear less-thanacutely-toxicdoses of As be<strong>for</strong>e they can cause much ofa problem. 25,78 The reports of chronic toxicity we discoveredinvolved dosages similar to those reported <strong>for</strong> acuteor subacute poisoning. Female beagle dogs fed 4 to 8 mgNaAsO 2(2.3-4.6 mg As)/kg BW per day <strong>for</strong> 183 daysexhibited decreased weight gains due to decreased feedconsumption and slightly elevated liver enzymes. 79 Beagledogs were fed varying concentrations of As as eitherAs III or As V <strong>for</strong> two years. At 50 ppm and less, there wereno measurable effects. At 125 ppm dietary As, the dogslost weight and several died with lesions of inanition. 80Three of four sheep given 88 mg PbHAsO 4/kg BW onceper month died within 24 hours of the seventh dose. Theother sheep in the study, given 22 and 44 mg PbHAsO 4(4.9 and 9.7 mg As/kg BW), survived 11 doses with noclinical signs. 54 One of two lambs dosed with 1.5 mg As/kg BW/day as PbHAsO 4died after 35 days; the othersurvived until the study was stopped at 94 days. 62 Sheepfed a mean daily dose of 1.4 mg As/kg (As species unspecified)<strong>for</strong> three weeks remained in good condition <strong>for</strong>the duration of the study. 81 Bucy et al. 82 fed potassiumarsenite to feedlot lambs at doses as high as 3.26 mg As/kg BW/day <strong>for</strong> eight weeks without adverse effects. In alater study 1.75 mg/kg BW/day was not toxic, but higherdoses caused feed refusal and clinical signs of toxicity. 83Peoples 78 added arsenic acid to dairy rations at 1.25 ppm,a dose of approximately 0.48 mg As/kg BW/day <strong>for</strong> sevenweeks with no effects. Virtually all of the ingested As waseliminated as quickly as it was eaten.It has been proposed 84 that elk in the Madison-Fireholewatershed of Yellowstone National Park have shorterlifespans because of naturally elevated As in water andfeedstuffs. Exposure was estimated to be “greater than1.25 mg/kg BW/day” based upon tissue concentrationsand extrapolation from bovine studies and between “0.01- 6.2 mg/kg BW/day” based upon <strong>for</strong>age and water analysis.The difference in longevity also may be due to otherenvironmental differences between the Madison-Fireholearea and the control site. 84 Forsberg et al. 85 demonstratedslight but measurable inhibition of normal rumenfermentation in vitro with As concentrations as low as 5mg/L of rumen fluid, but they did not provide any dataas to how this concentration related to dietary intake.Assuming <strong>for</strong> the moment that the rumen fluid concentrationis equivalent to the combined concentrations infeed and water, the concentration would be equivalent toa dose of roughly 1 mg As/kg BW.SummaryOur recommendations are based upon the toxicity of inorganicAs III , specifically the arsenite ion. Routine waterquality analysis available to livestock producers does notdistinguish between As species, and, although the lesstoxic pentavalent <strong>for</strong>ms of As are more likely to occurin surface waters, trivalent As is seen frequently enoughin specialized surveys to justify the assumption. 86,87 It issuggested that ruminant animals are less susceptible to Asthan monogastrics. 25,88 With the exception of laboratoryrodents, however, we were not able to confirm this to bethe case, thus we have assumed horses are equally sensitiveto As as ruminants.Chronic poisoning of the type (cancer, “blackfoot disease,”etc.) that prompted lowering the human drinkingwater standard from 0.05 to 0.01 mg As/L does notapparently occur in other animal species, as demonstrated8
y the ongoing search <strong>for</strong> an appropriate animal model tostudy the human condition. The mechanism(s) putativelyinvolved in the pathogenesis of chronic damage inpeople, i.e. chemical attack by methylated As III metaboliteson cellular macromolecules, do not appear to berelevant in livestock and wildlife. In domestic livestock,as opposed to people, most As is excreted via urine asDMA III . 33 This, together with the shorter observed halflifein these species, suggests that relatively little trivalentAs escapes methylation and excretion to cause cancer.Chronic poisoning in livestock species involves mechanismssimilar to acute poisoning and requires dosagesvery similar to acute poisoning.Given the accumulating evidence that As is a humancarcinogen, the question of residues arises. Can foodanimals consuming As from water accumulate dangerousamounts of As in edible tissues without themselvesshowing signs of toxicity? The literature to date suggestscattle, sheep, etc. eliminate As too quickly <strong>for</strong> this to bea concern, and a study completed in 2007 by the Universityof Minnesota 89,90 failed to find any evidence of Asaccumulation in milk or edible tissues from dairy cattlewatered from As-contaminated (140 μg/L) wells.The threshold toxic dose in domestic ruminants appearsto be between 1-2 mg/kg BW. This dose is in generalagreement with the NRC 25 , which recommended 30-50ppm dietary As as a maximum tolerated dose and withother reviews. 88,91-93 It is quite distinct from the EUrecommendation of 2 ppm dietary As, <strong>for</strong> which we havenot been able to discover any justification. Sufficientquantitative data was not found to estimate a similarthreshold <strong>for</strong> horses, but this dose is similar to that reportedin another monogastric species (dogs) 79 , and previousreviews suggest horses are similar to cattle in sensitivityand/or less frequently affected than cattle under similarconditions. 93,94 There<strong>for</strong>e, it seems reasonable that limitssafe <strong>for</strong> cattle should be adequate <strong>for</strong> horses. The verylimited data in wild ruminants suggest they are similar tocattle in sensitivity. There<strong>for</strong>e, our recommendations arebased upon dosage data from cattle and sheep. Assumingneglible As in feedstuffs, 5 mg As/L in drinking water willprovide the minimum toxic dose of 1 mg As/kg BW tograzing animals in warm weather. Obviously, if animalsare receiving any As from <strong>for</strong>age or medications, less willbe required to achieve a toxic dose. Although we werenot able to find any significant studies of As in <strong>Wyoming</strong><strong>for</strong>ages, limited data from our laboratories suggest naturalbackground concentrations seldom exceed a few ppm,except in areas contaminated by geothermal runoff.Assuming a NOAEL of 0.5 mg/kg BW/day and allowing<strong>for</strong> these small <strong>for</strong>age concentrations, we recommenddrinking water <strong>for</strong> livestock and wildlife notexceed 1 mg As/L.9
3 BariumBarium (Ba), an alkaline earth element, oxidizes easilywhen exposed to air, and it is found as the Ba 2+ ionin water. Barium found in surface and ground watersis predominantly derived from weathered rock andminerals. Common naturally occurring Ba minerals areinsoluble barite (barium sulfate, BaSO 4) and somewhatmore soluble witherite (barium carbonate, BaCO 3), whilethe Ba 2+ ion is most common in natural waters. 95 Bariumconcentrations in water will likely be higher near drillingplat<strong>for</strong>ms than natural background concentrations asa result of drilling muds, cuttings, and produced waterdischarge containing Ba. 96 In water, soluble Ba mayprecipitate out of aqueous solution as insoluble salts (e.g.BaSO 4and BaCO 3). At pH activity of 9.3 or below,the <strong>for</strong>mation of BaSO 4limits the Ba concentration innatural waters. Barium has a variety of uses: BaSO 4isused in patients <strong>for</strong> digestive tract imaging and <strong>for</strong> oildrilling, and BaCO 3is used in rodenticides. 96-98EssentialityBarium is not an essential element <strong>for</strong> plants or animals.MetabolismExisting studies indicate Ba absorbed from the G.I. tractis primarily deposited in bones and teeth and excreted viafeces and urine. 99-103 The absorption efficiency of variousBa compounds given orally varies widely (0.7-85%) dependingupon the chemical <strong>for</strong>m, species, age, and fastingstatus of the animal. 104-106 In general, more soluble <strong>for</strong>msof Ba such as barium chloride (BaCl 2) are more readilyabsorbed. Young rats absorb approximately 10 fold moreBaCl 2than adults. 106 Barium disappears from blood andmilk with a half-life (t 1/2) measured in days; 100,102 however,Ba deposited in bone has a t 1/2measured in years, anddisappearance from bone is generally dependent uponbone turnover. 107 These observations, together with thedivalent cationic nature of Ba and the fact Ba is known tobind Ca-dependent enzyme systems in cells, suggest Bametabolism utilizes Ca transport systems in the body.ToxicityBarium is toxic in water-soluble <strong>for</strong>ms such as BaCl 2and,to a lesser extent, BaCO 3. Barium sulfate is insoluble andis not considered hazardous to people or other monogastricanimals. The specific toxic mechanism of Ba isa blockade of passive transmembrane potassium (K + )conductance in excitable cells by the Ba 2+ ion. 97,98,108,109Barium also competes with and/or mimics the functionsof Ca in muscle contraction and in second messengerpathways. 97,108 The characteristic systemic effect of Bapoisoning is “violent contraction of smooth, striated, andcardiac muscle.” 109,110 Clinically, this effect is manifestedas arterial hypertension and premature supraventricularand ventricular contractions, followed by skeletalmuscle contraction, salivation, vomiting, colic, and diarrhea.97,98,108,109,111,112 Subsequently, blood pressure dropsprecipitously and skeletal muscles exhibit flaccid paralysis.Finally, death results from arrhythmias and cardiacfailure. 104,112,113 The hypokalemia seen in Ba poisoningis thought to result from blockade of passive K channelsand intracellular sequestration, as Ba has no proven activityon the Na + K + ATPase pump. 98,109,114Data on the toxicity of Ba in grazing animals is limited.Two ruminally fistulated dairy goats were infused with5mM BaCl 2at a rate of 60 ml/hr. The ruminal fluid Ba 2+ion concentration was estimated to be 0.4 mM assumingno absorption or precipitation occurred. After receivingBa 2+ <strong>for</strong> six hours, the animals exhibited weakness andparalysis, and they died later that night. The resultingoral lethal dose of BaCl 2in the goat was determined tobe less than 4.6 mg Ba 2+ /kg BW. 115 This Ba dosage wouldequate to approximately 23 mg/L in drinking water underconditions outlined in the Introduction. Ba poisoningoccurred during two successive years in cattle thatwere trailed through an abandoned lead/silver mine sitecontaining a Ba-contaminated pond. 116 Affected animalsexhibited protruding tongues, salivation, watery diarrhea,muscle tremors, and paralysis progressing to recumbencyand death. Six of 30 animals died the first year and 16of 20 the second. Liver and kidney tissues from affectedanimals contained elevated Ba concentrations, and othermetals (Pb, As, Se, etc.) were within normal limits. Pondwater contained 2.2 mg Ba 2+ /L; however, clay found in11
oth the abomasum of the dead cattle and in the pondcontained 69,000 ppm Ba. The amount of Ba, if any,absorbed from the clay is presently unknown. X-ray diffractionanalysis of the clay indicated the Ba was presentprimarily as insoluble BaSO 4, with lesser amounts ofBaCa[CO 3] 2and BaCO 3salts. Reagor 117 fed BaCO 3tosteers at 0.4% and 0.8% of the dry matter diet to steers(0.28% and 0.56% Ba respectively). All three receivingthe high dose died after a single day on feed; all three receivingthe lower concentration remained healthy <strong>for</strong> theduration of the experiment. Clinical signs in the steerswere similar to those reported in monogastrics.Malhi et al. 118 investigated the optimum concentration ofBaCO 3<strong>for</strong> a rodenticide and concluded 1.5 g of BaCO 3per 100 g body weight (or 15,000 mg/kg) was the mostefficient rat poison. There was no attempt to determinea minimum lethal dose. Mattila et al. 119 administeredBaCl 2via the marginal ear vein of six rabbits instrumentedwith an electrocardiograph. Three to 5 mg Ba 2+ /kg ofBW caused dysrhythmias with and without convulsions.Rabbits receiving 3 mg Ba 2+ /kg of BW survived, despiteconvulsions. Roza and Berman 112 observed anesthetizeddogs after infusing them with 0.66-2.64 μmol Ba (asBaCl 2)/kg/min to identify mechanisms of Ba-inducedhypokalemia and hypertension and to study the Ba-Kinteraction on the heart in vivo. They found rates greaterthan 4 μmol BaCl 2/kg/min (~362 μg Ba 2+ /kg/min) werefatal within a few minutes due to respiratory paralysis.In humans, most acute oral toxicity data is derived fromsuicide attempts. Gosselin 110 describes the oral lethaldose in humans as “1-15 g.” A research chemist attemptedsuicide by ingesting a teaspoon (approximately 13 g)of BaCl 2. 120 He was rushed to a hospital and survivedafter treatment with MgSO 4and KCl. Seven members ofa family were poisoned with Ba after ingesting fried fishaccidentally breaded with powdered rat poison. 114 Theexact amount of BaCO 3ingested was not determined,but the breading of the fish contained 105,000 ppm ofBa. Three of the family members displayed classic signsof Ba poisoning, while one developed rhabdomyolysis,respiratory failure, and hypophosphatemia. All patientssurvived with treatment. In another instance, a 26-yearoldman consumed one can of “Magic Shave” containing12.8 g of Ba 2+ ion and 3 g of sulfide. 121 Ipecac was givenwithin three hours. He suffered respiratory paralysis,severe respiratory acidosis, and hypokalemia. His conditionimproved after he was given 206 meq of K over 19hours.Several studies have examined the chronic oral toxicityof low concentration BaCl 2in drinking water to peoplebecause of Ba’s recognized cardiac toxicity. Wones etal. 122 concluded that drinking water concentrations of 5and 10 mg Ba 2+ /L did not affect any known modifiablecardiovascular risk factors. Eleven healthy men weregiven BaCl 2in their drinking water <strong>for</strong> six weeks. For thefirst two weeks of the experiment, no BaCl 2was added totheir water. BaCl 2was then added at rates of 2-5 mg/L<strong>for</strong> the next four weeks and 10 mg Ba/L <strong>for</strong> the last fourweeks. The subjects were given 1.5 L of treated drinkingwater per day; any additional drinking water wasdistilled. Diets were controlled as well as other knowncauses of cardiovascular disease. Blood (plasma totaltriglycerides and HDL cholesterol), urine (Na, K, vanillymandelicacid, and total metanephrines), blood pressure,and cardiac function were monitored throughout thestudy. They discovered no apparent changes in modifiablecardiovascular risk factors, but there was a trendtoward slightly increased total blood Ca. Brenniman andLevy 123 conducted an epidemiological study to determineif mortality and morbidity rate were significantlyincreased in human populations drinking elevated Balevels in their drinking water as compared to populationswith little or no Ba exposure. Cardiovascular mortalityrates were surveyed in communities with drinking waterBa concentrations that ranged between 2-10 mg/L. Amorbidity study was also conducted in areas where meanBa concentrations in drinking water were 0.1 and 7.3mg/L. They found higher cardiovascular mortality ratesin elevated Ba communities, but there were also severalconfounding variables. There were no significant differencesin blood pressure, hypertension, stroke, and heartand kidney disease.The single oral LD 50of BaCl 2in rats was estimated to beapproximately 264 mg Ba/kg BW. 124 Short-term (1-10day) oral exposure to BaCl 2at daily doses up to 138 mgBa/kg BW produced no significant adverse health effects.Because of the link with cardiovascular disease in people,most chronic laboratory animal studies focus on cardiaceffects. Barium acetate (Ba(CH 3COO) 2), added todrinking water at 5 mg Ba 2+ /L and fed to rats over theirlifespan had little or no effect on growth, carcinogenesis,or longevity. 125 Rats drinking water with 100 mg Ba 2+ /Las BaCl 2<strong>for</strong> 16 months exhibited significant but varyingincreases in systolic blood pressure. 126 In a similarstudy, the average systolic pressure increased significantlyafter exposure to 100 mg Ba 2+ /L <strong>for</strong> one month and after10 mg Ba 2+ /L <strong>for</strong> eight months. After 16 months, rats12
exposed to 100 mg Ba 2+ /L had depressed heart rates anddecreased cardiac function. 127,128 Another experiment examinedthe effect of BaCl 2in drinking water <strong>for</strong> 92 dayson serum electrolytes, body weight, behavior, and fertilityin rats and mice. 129 The no observed adverse effect level(NOAEL) <strong>for</strong> Ba, based upon depressed body weightgain and renal and lymphoid lesions, was estimated tobe 1,120 mg Ba 2+ /L. Mortality was attributed to kidneydamage. There appeared to be no adverse effects onreproduction and fertility, although there was a marginalreduction in pup weights. Tardiff et al. 130 studied acuteoral and subchronic toxicity of Ba as BaCl 2in rats. Theacute oral LD 50<strong>for</strong> weanling rats was 220 mg Ba/kg BWand <strong>for</strong> adults was 132 mg Ba/kg BW. Drinking 250 mgBa 2+ /L <strong>for</strong> up to 13 weeks resulted in less water consumptionthan controls, but it did not cause any clinical signsof toxicity, nor was body weight affected. McCauley etal. 131 found no significant lesions in rats exposed to up to250 mg Ba/L drinking water <strong>for</strong> 68 weeks, nor were theremeasurable electrocardiographic changes when measuredat five months; however, Ba-exposed rats were more sensitiveto norepinephrine.An anecdotal report of BaCl 2ingestion in a man suggestsBa may damage kidneys, although the kidney lesions werelikely the result of IV therapy with MgSO 4. 120 ChronicBa exposure causes nephropathy in rodents. Male ratsdrinking 5 ppm Ba as the acetate salt in a life-time studydeveloped proteinuria. 125 McCauley et al. 131 identifiedkidney lesions in rodents administered 1,000 mg Ba/Lin drinking water <strong>for</strong> 16 weeks. Dietz et al. identifiedkidney lesions in male and female mice receiving doses of436-562 mg Ba 2+ /kg BW/day via drinking water <strong>for</strong> 92days. Rats receiving the same water drank less, receivingonly about one quarter of the dose and had much milderrenal lesions. 129 In a subsequent two-year cancer bioassay,female and male rats receiving 75 and 60 mg Ba 2+ /kgBW/day, respectively, in drinking water gained less thancontrols but did not exhibit any Ba-related clinical signs.Mice in the same two-year study drank up to 160 (male)or 200 (female) mg Ba 2+ /kg BW/day and had significantlygreater premature mortality due to kidney disease thandid controls. 132Most authorities indicate BaSO 4is the least soluble andthere<strong>for</strong>e least toxic <strong>for</strong>m of Ba. A United Kingdomrisk assessment of BaSO 4described it as a low risk dueto, among other reasons, low solubility. 133 Studies byMaglinte et al. 134 and several decades use of BaSO 4as radiographiccontrast media support the premise BaSO 4isrelatively nontoxic in mammals. 134-137 Ba sulfate-derivedBa was poorly bioavailable in an environmental study andthus did not bioconcentrate between trophic levels in thefood-chain. 138 One exception is a study suggesting 131 Bafrom BaSO 4was nearly as bioavailable as BaCl 2. 139There are a number of reports regarding the toxicity of inhaledBa. 140-143 Since the relationship between the toxicityof inhaled Ba and soluble Ba in feed or water is not fullyunderstood, these studies were not included.SummaryThe acutely toxic effects of Ba are similar in monogastricsand ruminants. This argues that 1) Ba is a valid waterquality concern <strong>for</strong> livestock and wildlife, and 2) subacuteand chronic effects are probably similar, if not identical,between these species. The putative toxic mechanism(s)of the Ba 2+ ion in rodents and human beings involvephysiologic mechanisms that are highly conserved (i.e.very similar) throughout terrestrial mammals; there<strong>for</strong>e,any species-specific differences in toxicity logically derivefrom species-specific differences in the toxicokinetics ofBa. In monogastric mammals, the oral toxicity of Bacompounds correlates with their water solubility. Lesssoluble <strong>for</strong>ms of Ba (notably BaSO 4) are poorly absorbedand are thus considerably less toxic than more solublesalts such as BaCl 2, barium nitrate (Ba(NO 3) 2), or bariumhydroxide (Ba(OH) 2). 105 There is no equivalent data inruminants. Theoretically, reduction of the SO 4salt tosulfide by rumen microflora might result in increasedbioavailability of the Ba 2+ ion. There is some precedent<strong>for</strong> differences in metabolism of Ba between monogastricsand ruminants 144 , but much more needs to be done. Asa practical matter, however, this theoretical effect wouldbe significant only in solid feedstuffs as insoluble <strong>for</strong>ms ofBa (i.e. BaSO 4) will presumably not be present in drinkingwater in any significant concentration.The long-term effects of Ba, especially on reproduction,have been incompletely investigated in any species.A single Russian report of Ba inhalation toxicitydescribes reproductive lesions in both male and femalerats 145 whereas more recent rodent studies did not notealterations in reproductive tissues or reproductive functionfollowing acute-, intermediate- or chronic-durationexposure to Ba. 129,131,132 Kidney damage was observed inlaboratory rodents following two-year exposure to 200mg Ba/kg BW and in long-term (91-day) oral exposure to450 mg Ba/kg BW, but it was not seen after administrationof 250 mg Ba/kg BW <strong>for</strong> 36-46 weeks. 131,13213
The only quantitative data available in cattle indicates 138mg Ba/kg BW, as BaCO 3, in dry feedstuffs was acutelytoxic to steers, whereas 69 mg Ba/kg BW was not. 117 Assumingwater consumption of 20% BW, this translates to690 mg Ba 2+ /L in drinking water as being acutely toxic or345 mg Ba 2+ /L as the NOAEL. This contrasts with thereport of Richards et al. 116 that 2 mg soluble Ba 2+ /L water,plus some undetermined amount of Ba from sediment,was immediately toxic to cows and calves. It is also muchhigher than the toxic dose reported in goats, where 7 mg/kg BW BaCl 2(4.6 mg Ba/kg BW) was lethal. 115 It is likelythat BaCO 3in feed is not as bioavailable as the Ba 2+ ionin water. The acutely lethal dose in the goat study translatesto 23 mg Ba 2+ /L under the assumptions outlined inthe Introduction.Obviously, much more research needs to be donewith Ba in ruminants, but, given the current state ofknowledge, soluble Ba 2+ concentrations should be heldto well below 23 mg/L to avoid acute toxicity. There isabsolutely no data on chronic Ba 2+ ion toxicity in anyof our species of interest. This, plus the limited andconflicting data from chronic studies in other animals,makes it impossible to postulate a long-term “safe”level of the Ba 2+ ion in drinking water <strong>for</strong> domesticlivestock and/or wildlife species with any degree ofcertainty.We do not recommend using water containing morethan 10 mg Ba 2+ /L even <strong>for</strong> short periods. Untilthere is better data, it is impossible to make anyrecommendations regarding chronic exposure.14
4 FluorideFluorine (F) is the most electronegative and reactive ofknown elements. It rarely occurs free in nature, chemicallycombining to <strong>for</strong>m fluorides. Fluorides are widelydistributed throughout the environment in variousanthropogenic and natural <strong>for</strong>ms. Mineral <strong>for</strong>ms of F includecryolite (Na 3AlF 6), fluorite (CaF 2), and fluorapatite(Ca 5(PO 4) 3F). Vegetation can accumulate fluoride fromsoil, water, and the atmosphere. 146 In aqueous environments,F occurs as the free fluoride ion (F - ) and is mobile,especially in alkaline waters. 95 Unless surface waters arecontaminated by a F - source, ground waters tend to havehigher concentrations of F - than surface waters.EssentialityThe NRC 147 describes F - as an “important constituent” ofbones and teeth, and, although essentiality has not beenproven, small amounts have been added to municipalwater supplies to improve dental health <strong>for</strong> decades. Apparently,even if F is essential, the dietary requirement isso small it is easily met by even highly purified diets. Asnoted by Ammerman, 148 “Whether or not it is essential<strong>for</strong> animals may be open to debate… The fact that it istoxic is more easily confirmed.”MetabolismFluoride is readily absorbed by the stomach, rumen, andsmall intestine. The efficiency of absorption dependsupon the solubility of the specific F compound, otherdietary components, and the species, sex, and age ofthe animal. 147,149 Conditions that result in very low pHfavor the <strong>for</strong>mation of hydrogen fluoride (HF), which islipophilic and thus diffuses easily across lipid membranes.The F - ion is absorbed in the small intestine via a pHindependent process. 147 Soluble fluorides, i.e. the F - ionin water, are almost 100% absorbed. Less soluble sourcessuch as F compounds in bone meal are relatively poorlyabsorbed. Ca, Mg, Al, NaCl, and high lipid concentrationsare known to depress F uptake. 147,150Two mechanisms are responsible <strong>for</strong> removal of F - fromthe systemic circulation: renal excretion and depositionin calcified tissues. After absorption, most F - circulatesin plasma as ionic F - . To a lesser extent, it circulates asCaF 2or HF, or it is bound to protein. 150-152 CirculatingF - represents a relatively small portion of the total bodyburden but is the <strong>for</strong>m most easily exchanged with othertissues and/or eliminated via renal filtration. 151,152 Urinaryexcretion is the primary route of elimination andis directly related to urinary pH; thus, factors that affecturinary pH influence how much F- is excreted. 150,153Under “normal” circumstances, roughly 50% of ingestedF - is eliminated immediately, and the remainder is incorporatedinto bony tissues 147 ; however, these percentagesmay be significantly modified by physiologic factors suchas age, sex, or other factors. Calcified tissues such asteeth and bone have a great affinity <strong>for</strong> F - , incorporatingit as fluorapatite in place of hydroxyapatite in the calcifiedmatrix. 147,153 To a certain extent, bone depositionrepresents a <strong>for</strong>m of detoxication by decreasing the F -exposure of other tissues. Fluorapatite crystals, however,are less soluble than the hydroxyapatite they replace andthus 1) persist <strong>for</strong> long periods in bone, and 2) interferewith normal turnover (remodelling) of bone. There<strong>for</strong>e,at higher concentrations, bone F - interferes with normalphysiological processes like growth and healing. Since F -deposition in skeletal tissues is related to the turnover ofbone minerals, young, rapidly growing animals are morelikely to accumulate it. 147ToxicityAnimals can ingest potentially toxic doses of F - from avariety of sources. In the past, <strong>for</strong>ages contaminated byaluminum smelters or grown in naturally high F - soils,rock phosphate fed nutritional supplements, and/or consumptionof naturally high F - water have resulted in F -poisoning. 147,149,154-156 Large doses of soluble F - can <strong>for</strong>mcorrosive HF, interfere with ion gradients in excitablecells, and/or precipitate divalent cations from serum. 157,158Thus, acute fluorosis is manifested as gastroenteritis,cardiac arrhythmias, and/or collapse. 157 Chronic or subchronicexposure to somewhat lower doses results in kidneydamage, 157,159,160 neurologic damage, or reproductivefailure. 161-163 The most sensitive (i.e. occur at the lowestdose) clinical manifestations of F - toxicosis in livestockand wildlife under real-world conditions are tooth andbone de<strong>for</strong>mities. 149,164-169 These bony tissue lesions often15
esult in difficulty grazing, reduced feed intake, ill-thrift,and decreased per<strong>for</strong>mance. 149,166,167 Alternating periodsof high and low F - exposure are more toxic than a continuousintake of the same average amount. Nutritionalstatus and the age when exposed to F - also influencetolerance. 170The effect of F - on behavior and brain development wasexamined in rats by injecting pregnant dams with 0.13mg/kg BW of sodium fluoride (NaF) subcutaneously ongestational days 14-18 or 17-19. 171 Weanlings receivedeither no NaF or NaF in drinking water at 75, 100, or125 mg F - /L <strong>for</strong> six or 20 weeks, and three 3-montholdadults received water containing 100 mg F - /L <strong>for</strong>six weeks. Rats exposed to F - had sex-and dose-specificbehavioral deficits. Males were most sensitive to prenatalexposure; females were more sensitive to weanling andadult exposure. Drinking water containing 125 mg F - /Lresulted in reduced growth, and 175 mg F - /L was lethal.Shan et al. 172 treated rats with differing concentrations ofF to investigate the effect of F - on cognitive processes byexamining its effects on nicotinic acetylcholine receptors(nAChRs) in the brain. Both 30 and 100 mg F - /L in thedrinking water produced subtle brain damage indicativeof oxidative stress. Paul et al. 173 administered NaFby oral intubation daily at 20 or 40 mg/kg BW to adultfemale rats <strong>for</strong> 60 days and measured spontaneous motoractivity, motor coordination, cholinesterase activityin blood and brain, and the protein content of muscle,liver, and serum. Sodium fluoride treatment suppressedspontaneous motor activity and tissue and serum proteinconcentrations in a dose-dependent manner. Wang etal. 174 found decreased total phospholipid concentrationsand ubiquinone in rat livers due to oxidative stress afterseven months of consuming water containing 30 or 100mg F - /L.Rats were offered drinking water containing 225 mgF - /L as NaF <strong>for</strong> 60 days. 175 A second group of rats wasalso gavaged with calcium carbonate (CaCO 3). TheNaF-treated rats exhibited decreased food and waterintake, reduced body weight gain, and impaired nervousfunction. Fluoride-induced dental lesions, inhibitionof acetylcholinesterase and N + K + ATPase activity, anddecreased serum protein improved after NaF withdrawal.Calcium treatment lessened the impact of F by decreasingserum F concentrations. 175 Rats given drinking waterwith either 30 or 100 mg F - /L as NaF <strong>for</strong> seven monthshad decreased kidney proteins and BW gains, and dentalfluorosis. 159 Ten or 30 mg F - /L administered to male ratsvia drinking water <strong>for</strong> three to six months did not causeany overt clinical effects but did produce biochemical indicationsof liver damage. 176 Oral administration of NaFin water at 5 or 10 mg (2.25 or 4.5 mg F - )/kg BW/day<strong>for</strong> 30 days to adult male rats resulted in reduced bodyweight. 163 Testicular cholesterol and serum testosteronelevels were not affected, but sperm motility and countwere decreased resulting in a significant decline in fertility.Heindel et al. 177 studied fetal development in ratsand rabbits fed up to 300 or 400 mg NaF (135 or 180mg F - )/L drinking water, respectively, during gestation.Although there were no teratogenic effects at any dose,dams lost weight after drinking water with concentrationsgreater than 150 mg NaF/L (rat) or 200 mg NaF/L(rabbit).Certain elements are known to interfere with the uptakeof F, a fact some have attempted to exploit therapeutically.Rats received drinking water treated with equivalentamounts of F as aluminum fluoride (AlF 3,0.5 mg/L) orNaF (2.1 mg/L) <strong>for</strong> 52 weeks to evaluate the interactionof Al with F. 178 AlF 3e reduced the neuronal density of thebrain neocortex compared to the NaF and control rats.Brain and kidney Al concentrations were higher in bothAlF 3- and NaF-treated groups than in controls. Rabbitswere fed drinking water containing various combinationsof either F - (1-50 mg/L as NaF) or Al (100-500 mg/L asAlCl 3) <strong>for</strong> 10 weeks. Although none of the treatmentsresulted in significant weight loss, Al treatment decreasedF - accumulation in bone. Surprisingly, F - , by itself, increasedbone Al concentrations, suggesting Al or an Al-Fcomplex play a role in osteofluorosis. 179 Kessibi et al. 180gavaged sheep with 0, 1.9, or 4.7 mg F - /kg BW, with orwithout 13.5 mg Al/kg, <strong>for</strong> 33 months. In all treatedanimals, the general health status declined and osteodentalsigns appeared while F - levels increased in teeth,bones, and organs. In sheep given 4.7 mg F - /kg BW,lesions were observed in kidney and liver. Aluminum sulfate((Al 2(SO 4) 3) alleviated some, but not all, of the effectsof 1.9 mg F - /kg BW.Rats and mice were fed no NaF in drinking water or at11, 45, or 79 mg F - /L <strong>for</strong> up to two years in a carcinogenesisbioassay. 181 Body weights and survival rates ofF - treated rats and mice were similar to controls. Osteosarcomasoccurred in a small, statistically, and historicallyinsignificant number of male rats at the highest dose,while there was no evidence of carcinogenic activity infemale rats or mice of either sex. Rats on the highesttwo dosages also exhibited some increased osteo- anddental fluorosis. 181 Deer mice captured and fed 38,1,065, 1,355, or 1,936 ppm dietary F - <strong>for</strong> eight weeks16
lost weight and many died at the highest dose. 182 Thetoxicological response and metabolism of F - by threespecies of wild mammals (two species of voles and woodmouse) were compared to laboratory mice. 183 Animalswere given no NaF or 40 or 80 mg F - /L as NaF in theirdrinking water <strong>for</strong> up to 84 days. Forty and 80 mg F - /Ltreatments caused mortalities in the voles, probably as aresult of the greater water intake of this species. Severedental lesions were apparent in all animals surviving the80 mg F - /L treatment.Osteo-dental fluorosis was observed in cattle, buffalo,sheep, and goats from several villages in India where themean F - concentration in drinking water ranged between1.5 to 4.0 mg/L. 164 Forage F - concentrations were notmeasured, but the situation described suggests onlybackground concentrations were present. The prevalenceand severity of skeletal fluorosis increased with increasingF - concentration and age. Cattle and buffalo neara phosphate plant in India developed dental and bonylesions due to fluorosis. 184 Lesions were more common inolder animals than younger and in buffalo than in cattle.Environmental F - concentrations were: 534 mg F - /kg infodder, 1.2 mg F - /L in pond water, and 0.5 mg F - /L inground water, which, assuming standard consumptionof <strong>for</strong>age and water, would have provided approximately14 mg F - /kg BW. Two ranches, one with drinking watercontaining up to 10.5 mg F - /L, the other with 3 mg/L,were compared in Argentina. 185 While both had similar<strong>for</strong>age F - values (~15-25 ppm), cattle from the <strong>for</strong>merexhibited excessive dental erosion. Neeley and Harbaugh186 studied a Texas dairy herd drinking 4-5 mg F - /Lbe<strong>for</strong>e and after management changes that resulted inincreased F - intake from 0.52 mg/kg BW to 1.69 mg/kgBW, primarily as a result of increased water consumption.Most animals exhibited dental fluorosis both be<strong>for</strong>e andafter the change, but breeding efficiency and productionincreased after the change, probably as the result ofbetter nutrition and management. Rand and Schmidt 187followed several Arizona herds’ drinking water containing16 mg F - /L and consuming <strong>for</strong>age containing up to 25ppm F - . They concluded 1 mg F - /kg BW can be tolerated<strong>for</strong> 5-10 years with only minor cosmetic effects, but 2 mgF - /kg BW will result in accelerated tooth wear and signsof osteofluorosis. After the Lonquimay volcano eruptedin Chile, animals were exposed to water concentrationsless than 2 mg F - /L and as much as 48 ppm F - in <strong>for</strong>age.Two years later cattle were still developing fluorosis. 188Cattle fed a contaminated supplement that providedbetween 0.7-1.6 mg F - /kg BW/day <strong>for</strong> a year developedbone lesions and dental fluorosis. 189Merriman and Hobbs 190 conducted an extensive five-yearstudy of the interactions between soil and water F - andnutrition in cattle. Cattle on pastures with average <strong>for</strong>ageconcentrations of 143 ppm F developed dental fluorosis.Fluoride in soil, water, and grasses reportedly did notaffect gain, but the experimental design was too small toreliably detect differences in per<strong>for</strong>mance. Suttie et al. 191fed dairy calves 1.5 or 3 mg F - /kg BW, either continuouslyor in a six-month rotation, <strong>for</strong> six years. Bone F -was related to total intake and urinary F - remained highduring the “off” period, but dental lesions were relatedto the F - concentration when teeth were being <strong>for</strong>med.None of the treatments “affected growth or reproduction,”but only a small number of animals was studied.The physiologic effects of <strong>for</strong>age contaminated by fumesfrom an aluminum smelter and NaF-treated <strong>for</strong>age wereexamined in cattle. 192 Gains were significantly less ondiets containing more than 200 ppm F - as NaF. Cattlereceiving 70-100 ppm F - exhibited decreased reproductiveefficiency indirectly attributed to dental fluorosis.Cattle were fed 134 ppm dietary F - as soft phosphate orCaF 2,or 67 ppm F - as NaF <strong>for</strong> 91 days to compare thebioavailability and toxicity of the different sources of F.Feed consumption, average daily gains, and feed conversionwere not influenced by source of F -193 ; however,the study was too short to detect dental effects, and nocontrols were included. Shupe et al. 194 summarized 30years of experimental and observational studies in cattle,sheep, horses, deer, elk, and bison exposed to differingF - concentrations. They concluded that excessive dietaryF - during tooth <strong>for</strong>mation damages teeth, and the abnormalwear of these teeth results in impaired per<strong>for</strong>mance.Offspring from F - -damaged animals showed no signs offluorosis. Short-term exposure of dairy heifers to 2.5 mgF - /kg BW during 13-15 or 16-18 months of age resultedin severe dental fluorosis, even though the total F intakewas not excessive. 195 Eckerlin et al. 196 and Maylin et al. 197described a farm where F - -contaminated concentratecontributed approximately 12.8 to 56 ppm F - to the diet.Cows had depressed milk production, while their calvesexhibited dental and osterofluorosis and had severelystunted growth.Holsteins were raised and maintained <strong>for</strong> 7.5 years on<strong>for</strong>age containing 12, 27, 49, or 93 ppm F - as NaF. 198Initially, F had no effect on feed intake, digestion coefficients,or nutrient absorption. However, after the cowshad been through two lactations, cattle consuming thehigher two F - diets consumed and digested less. The “tolerancelevel” <strong>for</strong> dietary F was concluded to be between17
27-49 ppm of the total diet. McLaren and Merriman 199monitored beef cattle maintained on “high” (125 ppm)or “low” (37 ppm) F pastures and “good” (80-100% ofNRC recommendations) or “poor” nutrition in a 2x2 factorialexperiment. They concluded neither F - concentrationsnor plane of nutrition had any effect on the “generalhealth” of the animals. Sixteen dairy heifers were fed haycontaining 10 or 62 ppm F - or 10 ppm hay supplementedwith CaF 2at 69 ppm F - or NaF at 68 ppm F - , <strong>for</strong> 588days. 200 The F - diets resulted in dosages of 1.14, 1.32, or1.29 mg F - /kg, respectively. Calcium fluoride was lesstoxic than contaminated hay or NaF. Fluoride causedno adverse effects on soft tissues but did cause significantdamage to teeth and bones. Van Rensburg and de Vos 201fed cows 5-12 mg F - /L in drinking water, with or withoutsuperphosphate, through four breeding seasons. By thesecond season the 8 and 12 mg F - /L groups exhibitedprolonged post-parturition anestrus, and fertility declinedin those two groups during the third season. By thefourth season toxic effects were apparent in the 5 mg F - /Lgroup as well.Sheep were maintained on 2, 5, or 10 mg F - /L drinkingwater from natural sources <strong>for</strong> four years. 202 Thehighest dose affected wool production, probably as aresult of limited food consumption caused by dentalfluorosis. Pregnant ewes drinking 10 mg F - /L waterdid not transmit toxic quantities of F - to the fetus or tothe lamb through milk. Sheep fed a commercial, nondefluorinated,rock phosphate lick to provide 2 mg F - /kgBW showed signs of fluorosis. 203 Thirty-seven % of thecommercial flock was affected, as opposed to only 17% ofthe breeding animals of the same age that were in betternutritional condition. Cattle and sheep raised on SouthAfrican farms where water F - ranged from 4-26 mg/L and<strong>for</strong>age from 5.3-22.4 ppm experienced severe osteo- anddental fluorosis. 204 Assuming normal consumption of<strong>for</strong>age and water, the dose received was between 2-4 mgF - /kg BW. A ranch in New Mexico experiencing dentalfluorosis was discovered to have water sources varyingfrom 0.09-3.32 mg F - /L. Interestingly, the higherconcentrations occurred in wells only used during part ofthe year, and a child drinking from the highest well haddental fluorosis as well. 205Horses and swine are believed to be less susceptible tofluorosis than cattle and sheep, but there is little clinicaland no experimental data to support the contention. 147Horses grazed in F - contaminated areas developed similarfluorotic signs as cattle and sheep. 206 Swine received noNaF or were fed 200 or 1,000 ppm dietary F - as NaF<strong>for</strong> 45 days in an experiment to determine the effectsof F - on bone growth. 207 The higher concentrations ofF - produced dose-related decreases in bone growth, feedconsumption, and overall growth. Bones from F - -treatedpigs were less dense and exhibited growth plate abnormalities.Fluoride toxicosis was diagnosed in elk, deer, and bisonon the basis of lesions and F - concentrations in teethand bones collected by hunters in Utah, <strong>Wyoming</strong>, andIdaho. Vegetation and water samples collected fromareas where fluorotic animals were discovered contained5.5-430 ppm F - and 0.5-24 mg F - /L, respectively. 208 Theinvestigators concluded that geographic areas where domesticlivestock have chronic fluorosis are also problematicareas <strong>for</strong> wildlife, which implies wildlife are roughlyequally sensitive to F. Suttie et al. 209 studied deer neara new aluminum smelter where <strong>for</strong>age concentrationsranged from 1-30 ppm F - . All deer had increased dentalF - and some mild cosmetic fluorosis, but none exhibitedexcessive tooth wear. Tissue F - concentrations in deerdiagnosed with fluorosis on the basis of dental lesionsnear an aluminum smelter were similar to those reported<strong>for</strong> cattle. 210 Suttie et al. fed 25 or 50 ppm F - as NaF towhitetail deer fawns. 211 Fluorotic lesions were similar tothose in cattle fed the same amount, but cattle seem todevelop more bony lesions and fewer dental lesions thandeer. Vikoren et al. 212 surveyed several hundred jawbonesfrom moose, red deer, and roe deer near aluminum smelterswhere <strong>for</strong>age concentrations averaged 30 ppm F - , andthey also looked at a small number of sheep in the samearea. Although the overall incidence of fluorosis was low,tissue concentrations were similar in sheep and cervids,and the threshold bone F - concentration <strong>for</strong> disease incervids was similar to what was previously reported indomestic species.SummaryFluoride generates considerable controversy in humanhealth, largely as a result of the common practice offluoridating municipal water supplies. We were not,however, able to find any convincing experimental studiesthat suggested the dramatic effects associated withacute exposure to relatively large doses of F - carried overto low level, long-term exposure. Although there are afew reports of dental fluorosis in people at slightly lowerconcentrations, the current primary drinking water standard<strong>for</strong> human consumption is 4 mg F - /L; the secondarystandard, apparently based upon cosmetic dental effects,is 2 mg F - /L.18
Our search of the literature pertaining to fluorosis inanimals yielded similar results. We were not able to findany reports of toxic effects in livestock or wildlife thatoccurred at lower F - dosages than cause osteo-dentalfluorosis. Thus, as a practical matter, maximum tolerableconcentrations of F - in water <strong>for</strong> livestock and wildlifeshould be based upon dental and osteal effects.The effects of F in feedstuffs and water are additive; whatreally counts is the total dose of biologically available F -ingested by the animal. Most of the reports we reviewed,when reduced to mg F - /kg BW, indicate the thresholddose <strong>for</strong> chronic osteo-dental fluorosis in cattle is approximately1 mg F - /kg BW. This is in agreement withthe NRC, 147 which indicates 30-40 ppm dietary F - (whichtranslates to 0.75-1.0 mg F - /kg BW) is the tolerance level<strong>for</strong> the more sensitive (i.e. during dental development)classes of cattle.Numerous studies have demonstrated the susceptibility ofwild ungulates (deer, elk, etc.) to fluorosis; however, therehas been only one controlled experiment 211 from whichdose-response can be extrapolated. A few other epidemiologicstudies provide sufficient data to <strong>for</strong>m roughestimates of the amount of F - required to produce signs offluorosis in cervids. Taken together, these indicate wildcervids are approximately as sensitive to the toxic effectsof F - as cattle. Sheep seem to be slightly less sensitivethan cattle although one Australian report indicated longtermexposure to as little as 10 mg F - /L drinking waterin Queensland decreased wool production. 202 Giventemperatures in that region, water consumption probablyresulted in 1-2 mg F - /kg BW <strong>for</strong> much of the year. Thesole report that included any data on horses suggestedhorses are two-fold more tolerant than cattle, but it goeson to describe situations in which ruminants and horses,sharing a pasture and water supply, were similarly affected.Assuming <strong>Wyoming</strong> <strong>for</strong>ages normally contain less than10 ppm F -213 , a water concentration of 3.75 mg F - /Lwould be required to achieve the 1 mg F/kg BW necessaryto cause fluorosis in cattle, and water containing lessshould not cause measurable production problems.We recommend water <strong>for</strong> cattle contain less than 2.0mg/L F - . By extension, these waters should also be safe<strong>for</strong> sheep, cervids, and probably horses.19
5 MolybdenumMolybdenum (Mo), an essential trace element required<strong>for</strong> nitrogen fixation and the reduction of nitrate tonitrite in plants and bacteria, is widely distributed innature. 214 Geochemical surveys in England found thatMo content in soil and sediment corresponds closelyto underlying black shales. 215 Other sources of Mo inthe environment include industrial contamination bymetal alloy manufacturing, copper mining, and coalmining. 216-221 Molybdenum occurs predominately asthe molybdate (MoO 42-) ion in natural water sources,and concentrations are typically very low (
elatively stable; however, once unbound, TMs are rapidlyhydrolyzed to MoO 4and SO 4. 246,249,262Since the clinical effects of molybdenosis are in large partdue to secondary Cu deficiency, it is useful to review Cumetabolism. Although Cu is an essential trace element<strong>for</strong> all mammals and deficiency is frequently associatedwith a number of maladies, the Cu ion itself is quitetoxic to cells. Thus, the metabolism of Cu in mammalsinvolves a number of different carrier and storage proteinsthat bind Cu, permitting it to be absorbed, distributed,and eliminated without exposing cells to excessiveamounts of the free ion. Copper is absorbed in theintestine by carrier proteins and stored in mucosal cells asa protein complex. 263 In monogastric species such as rats,horses, and swine, most uptake occurs in the small intestine.In ruminants, there is some evidence significantabsorption also occurs in the large intestine. 245 Copper istransported to the liver bound to albumin and transcuprein,where the proteins and their bound Cu atoms aretaken up into hepatocytes. 263 Within the liver cells, Cuis distributed between various storage proteins, especiallymetallothionein (MT), microsomes, nuclei, lysosomes,and the cytosol. 245,263 Copper is exported from the liverto the rest of the body <strong>for</strong> incorporation into enzymes asa protein complex with Cp.ToxicityDespite the fact Mo is intrinsically (i.e. without metabolismto TM) toxic 245,264,265 , secondary Cu deficiency is themost common pathogenesis underlying molybdenosis.The <strong>for</strong>m of Mo ingested and, more importantly, theCu:Mo ratio are critical determinants of toxicity. 266-268Cu:Mo ratios of 2:1 or less result in clinical signs, and effectsare exacerbated by high dietary S. 267 Various authoritieshave recommended Cu:Mo ratios of 4:1 or greateras the minimum “safe” ratio. 214,267,269 Signs of acute Motoxicity include gastrointestinal irritation, diarrhea, liverand kidney damage, and, ultimately, death. 253,267,270 Diarrheaappears to be a direct effect of Mo on the intestinalmucosal cells, rather than Cu deficiency. 245 In chronicpoisoning, anorexia and weight loss are initial clinicalsigns, followed by diarrhea, anemia, depigmentation ofthe hair coat (achromotrichia), ataxia, and bone and jointde<strong>for</strong>mities. 214,267,271,272 Integumentary lesions and boneand joint de<strong>for</strong>mities are probably due to deficiencies ofseveral Cu-dependent, critical enzymes, as well as possiblydecreased P in bone. 267,273,274 Decreased reproductivefunction, including decreased libido and fertility, has alsobeen associated with molybdenosis. 266,275-278Acute to subacute toxicity has been demonstrated experimentallyand occurs naturally in cattle, buffalo, and muledeer. The accidental addition of Na 2MoO 4at the rate of19,000 ppm (estimated Mo concentration 7,400 ppm) tocattle rations resulted in decreased feed intake, hind limbataxia, profuse salivation and ocular discharge, diarrhea,liver and kidney damage, rough hair coat, and death. 270Feeding 1.36 g Mo per head per day to five cows <strong>for</strong> anunspecified amount of time produced extreme scouringand loss of condition in three animals. 279 After consuminga ration containing 10.5 ppm Cu and 140 ppm Mo<strong>for</strong> three to four days, Holstein-Friesian lactating cowsand steers developed hemorrhagic diarrhea and frontlimb lameness, and they died. 280 Contaminated grazingpastures with <strong>for</strong>age Mo concentrations between 16-24ppm and 6-11 ppm Cu resulted in acute diarrhea, lossof condition, and posterior stiffness in cattle. 221 Feeding2,000 ppm Mo as (NH 4) 6Mo 7O 24<strong>for</strong> three days resultedin diarrhea and feed refusal in cattle. 281 After grazing apasture contaminated with used motor oil containingmolybdenum bisulfide <strong>for</strong> two weeks, cattle exhibiteddiarrhea, anemia, decreased milk production, achromotrichia,and hind limb weakness. 282 Four male buffalo weregiven 5 mg Na 2MoO 4(2.35 mg Mo)/kg BW/day <strong>for</strong>180 days; by two weeks, clinical signs included diarrhea,decreased weight gains, incoordination, swelling of hindfetlocks, and irregular hoof wear. 283 Including 2,500 ppmMo as Na 2MoO 4(equivalent to approximately 62.5 mgMo/kg BW) or more in the diets of mule deer <strong>for</strong> 33 daysresulted in diarrhea and feed refusal; whereas, smallerdoses were without apparent effect. The authors concludedthat deer are relatively resistant to Mo, comparedto cattle. 284Relatively few studies of molybdenosis have been conductedin monogastrics. Most of these involve relativelylarge doses of Mo and don’t seem to involve Mo-Cu-Sinteractions. 233,285-288 Rats given a diet containing 1,000mg Na 2MoO 4/kg BW <strong>for</strong> five weeks gained significantlyless than controls, and 50% developed mandibular exostoses.289 Feeding rats 1,200 ppm Mo as Na 2MoO 4<strong>for</strong> sixweeks resulted in decreased weight gains, and skin, tailrings, and femurs all required much less <strong>for</strong>ce to breakcompared to control tissues. 290 Six hundred ppm Mofed to rats <strong>for</strong> three weeks caused a depression in nutrientutilization and decrease in gain. 286 Rats consuming800 ppm Mo <strong>for</strong> five weeks showed a 36% depression ingrowth; adding 0.29% SO 4largely prevented this effect.233 Male rats given 1,200 ppm Mo as Na 2MoO 4<strong>for</strong>four to five weeks showed a 53% reduction in growth as22
well as reduced feed intake, followed by death. 285 Onethousand ppm dietary Na 2MoO 4resulted in weight loss,diarrhea, hair changes, palpable mandibular nodules, andother bone and joint abnormalities in rats. 291 Rats fed20 ppm Mo and 5 ppm Cu showed significant reductionin gains and depigmentation of hair. 275 Rabbits consuming1,000 ppm Mo as Na 2MoO 4in a diet with 16.4ppm Cu developed anorexia, alopecia, slight dermatosis,and anemia, and they died after four weeks. 273 Feedingrabbits 4,000 ppm Na 2MoO 4(roughly 55 mg Mo/kgBW) <strong>for</strong> four weeks resulted in anemia, abnormal bonedevelopment, and degeneration of myocardium andskeletal muscles. 292 Ponies fed up to 102 ppm Mo withnormal (9 ppm) dietary Cu remained asymptomatic <strong>for</strong>50 days. 293 Similar results were reported in colts fed 50ppm dietary Mo. 287 Four horses fed 20 ppm dietary Moas 99 Mo did not exhibit any signs of molybdenosis or derangedCu metabolism. The radioactive label in plasmawas bound to the MoO 4ion rather than TM, as seen inruminants. 288Chronic toxicity has been investigated both in field studiesand experimentally in cattle, sheep, and ruminantwildlife. Forage containing 24-28 ppm Cu and 14-126ppm Mo that had been contaminated by a metal alloymanufacturing plant resulted in emaciation and diarrheain cattle beginning four weeks after introduction to theaffected pasture. 219 Cattle grazing pasture contaminatedby aluminum alloy plants at a concentration of 77.5 ppmMo exhibited severe scouring, loss of condition, decreasedmilk production, and achromotrichia. 220 Cattle grazingpastures containing 1-20 ppm Mo exhibited diarrhea,listlessness, and abnormal hair color compared to animalsgrazing pastures containing < 1 ppm Mo with no clinicalsigns. 218 Feeding two male calves, with average bodyweights of 460 pounds, 4.0 g Na 2MoO 4/day resultedin diarrhea, discolored hair, weight loss, anemia, anddecreased libido. 266 Cattle consuming a diet containing4 ppm Cu and 5 ppm Mo exhibited decreased weightgains, decreased feed intake, and abnormal hair textureand color after 16-20 weeks. 264 Pastures containing 25.6ppm Mo produced severe diarrhea, emaciation, anemia,faded hair color, salt craving, and death in grazingcattle. 294 Yearling steers given 1.5 mg Mo/kg BW <strong>for</strong> 150days and grazed on pasture containing 0.32% S developeddiarrhea, inflammation of the sheath, rough haircoat, and anemia. 295Grazing <strong>for</strong>age containing 4-14 ppm Cu and 95-460ppm Mo and drinking water with 14 μg Cu/L and 7,200μg Mo/L <strong>for</strong> 11 weeks resulted in watery diarrhea, roughhair coats, and a stiff shuffling gait in 50% of cow-calfpairs. 296 Forage contaminated with 2-220 ppm Mocaused diarrhea, roughening and discoloration of thehair coat, and weight loss in grazing cattle. 297 Forageconcentrations of 16.5-23.5 ppm Mo and 2-25 ppm Curesulted in diarrhea, weight loss, and achromotrichia incattle. 298 Feeding 100 ppm Mo to heifers <strong>for</strong> 11 monthsresulted in anemia, scouring, achromotrichia, and weightloss. Five of 16 died two weeks after termination of theexperiment. 299 Heifers receiving diets containing 100ppm Mo and 0.3% S as SO 4became emaciated anddiarrheic after one month at this treatment level. Heifersgiven 5-20 ppm Mo with 0.3% S or 50 ppm Mo withoutadded S did not exhibit any signs of illness, but theydid have decreased tissue Cu compared to controls. 300Weight loss and scouring were evident in cows ingesting173 ppm Mo <strong>for</strong> two months. Diets containing53 and 100 ppm Mo did not produce clinical signs butdid interfere with Cu metabolism. 301 Forage containing6-36 ppm Mo resulted in emaciation in cattle with severediarrhea, anemia, achromotrichia, and swollen genitals. 302<strong>Water</strong> containing 50 ppm Mo induced signs of secondaryCu deficiency in five-week-old calves. 303 Moose inSweden have been reported to exhibit signs of molybdenosissimilar to cattle, including diarrhea, emaciation,achromotrichia, sudden heart failure, and osteoporosis;however, no levels of Mo in the <strong>for</strong>age or water sourceswere reported. 304Sheep grazing pastures containing 5.5-33.5 ppm Moand 6.0-8.7 ppm Cu <strong>for</strong> 76 weeks developed hemorrhagingaround the femoral heads, tuber sacrales, andpsoas muscles. Exostoses were frequent on humeri andfemurs, and the periosteum appeared to have lifted fromthe bone surface. 225 Feeding ewes 1 kg commercial grasscubes with 5 ppm Cu and supplemented with Na 2SO 4and (NH 4) 6Mo 7O 24to provide 10 g SO 4and 50 mg Mo,respectively, until one month prior to lambing resultedin incoordination of front and hind limbs and a markedataxia in lambs within 60 days of birth. 305 Sheep grazingpastures with 20 ppm Mo and 5-7 ppm Cu developedconnective tissue lesions including lifting of the periosteumand hemorrhaging in periosteum and muscle insertions.306 Drenching (i.e. dosing by stomach tube) goatsdaily with (NH 4) 6Mo 7O 24to provide 50 ppm dietary Mo<strong>for</strong> 235 days caused general debility, depigmentation ofhair coat, and weight loss. 307Notwithstanding other work, several studies have failedto produce any adverse health effects after Mo ingestion.Grazing cattle on pastures containing 13 ppm Mo and23
supplementing with 17 ppm Cu <strong>for</strong> six months resultedin no signs of adverse effects. 308 Cattle grazing a reclaimedmine tailing site containing 21-44 ppm Mo and13-19 ppm Cu <strong>for</strong> three consecutive summers exhibitedno signs of Mo toxicity. 217,309,310 No adverse effects werenoticed in a cannulated steer consuming sun-cured haycontaining 49.68 ppm Mo and 19.09 ppm Cu. 311 Ineach of these studies, low S in both the diet and waterwas offered as being a possible explanation <strong>for</strong> the lack ofclinical signs observed.SummaryHorses, like most monogastric animals, are very resistantto the effects of Mo as compared to ruminants. Cattle arecommonly cited as slightly more susceptible to molybdenosisthan sheep, and limited quantitative data suggestmule deer are relatively resistant compared to cattle.There<strong>for</strong>e, drinking water Mo concentrations that are safe<strong>for</strong> cattle are probably also safe <strong>for</strong> horses, other classesof livestock, and wild cervids. Although there is quite abit of variability in the reports summarized above, andsome (large) amount of dietary Mo may cause poisoningregardless of Cu status, the bottom line seems to be thattotal dietary Cu:Mo ratios of less than 2-4 can result inchronic toxicity and decreased production in cattle, especiallyif dietary S is higher than absolutely necessary.As with many substances, the effects of <strong>for</strong>age and waterMo concentrations are additive, and, in some areas of thewestern United States, <strong>for</strong>age Mo concentrations are alreadytoxic or very nearly toxic. Under these conditions,any additional Mo intake contributed by drinking wateris potentially dangerous. In these areas, however, producersare likely already aware of the problem and feedingsupplemental Cu. A more normal situation wouldbe cattle grazing “typical” <strong>Wyoming</strong> <strong>for</strong>age containing 7ppm Cu (or supplemented to that level) and negligibleMo (~1 ppm). Under these conditions the critical safe4:1 ratio would be exceeded whenever drinking watercontains 375 μg Mo/L.We recommend that, in the absence of other data,drinking water <strong>for</strong> livestock and wildlife containless than 0.3 mg/L. If dietary Mo is higher, which isnot unusual in this region, water Mo concentrationsshould be adjusted downward accordingly.24
6 Nitrate and NitriteThe nitrate (NO 3-) and nitrite (NO 2-) ions are intermediatesin the biological nitrification cycle and the primarysource of nitrogen (N) <strong>for</strong> plants in the soil. Plants accumulateNO 3-from soil to synthesize protein via a multistepprocess; excessive NO 3-accumulation as a result ofthis process may cause poisoning of grazing animals. 312Nitrate or NO 2-may contaminate water as a result ofcontact with natural minerals (e.g. niter), agriculturalrunoff (fertilizer, manure) or industrial processes. 312-314Nitrate is the more stable of the two N species and there<strong>for</strong>emore common in surface waters. 315 Nitrite (NO 2-)usually results from biological reduction of NO 3-, but itmay also be an industrial contaminant or exist in groundwaters where pH and redox potential prevent oxidationto NO 3-. 315 Both ions are extremely water-soluble andthere<strong>for</strong>e water-mobile.EssentialityAlthough N is an essential macro element <strong>for</strong> mammals,NO 2and NO 3are not essential per se.MetabolismWhile the NO 3-ion is readily absorbed in the upper gastrointestinal(GI) tract and possesses intrinsic toxicologicproperties such as vasodilation, the condition referred toas “nitrate poisoning” actually depends upon reduction ofNO 3-to NO 2-in the upper GI tract. 312,316-318 This processoccurs in human infants 319,320 , and it is the basis of currenthuman drinking water standards, but nitrate toxicityis primarily a problem in ruminant species, as the rumenmicroflora are well-suited to catalyze NO 3-reduction.Radiotracer studies indicate that NO 2-, <strong>for</strong>med fromNO 3-in the rumen, may either be further reduced andincorporated via NH 3into amino acids or reduced vianitric oxide to N and expelled. 321 Un<strong>for</strong>tunately, neitherof the latter pathways (i.e. amino acids or N) is as fast asthe initial reduction to NO 2-, and dangerous NO 2-concentrationsaccumulate in the GI tract when assimilatorypathways are overloaded. 321-323 Under the proper dietaryconditions (mainly adequate carbohydrates) the assimilatorypathways can adapt to high NO 3-concentrations,and very little NO 3-or NO 2-escape the rumen. 314,322,324-327Sustained exposure to moderately high NO 3diets resultsin induction of the assimilatory pathways, and this abilitymay be acquired by transfer of GI flora from one ruminantto another. 322,323 Once absorbed into the bloodstream,the NO 3-ion is rapidly distributed throughoutthe body water and excreted via urine and saliva, whereasthe NO 2-ion is oxidized to NO 3-via a coupled reactionwith hemoglobin and eliminated as NO 3-. 316,318,328,329Other differences between ruminants and monogastricsin the metabolism of the NO 2-and NO 3-ions, whilenot directly tied to the ruminal metabolism of NO 3-,probably reflect evolutionary pressure of the constantbackground of NO 2-ruminants receive from ruminalmetabolism. The blood t 1/2of NO 2-is similar in monogastricsand ruminants, but the elimination of NO 3-fromblood is much slower in monogastrics 316 and the normalbackground metHb concentration is higher in monogastrics.330 In ruminants only a small portion of an oral doseof NO 3is eliminated in the urine, whereas in monogastricsmost ingested NO 3is eliminated via urine. 314Some sources suggest the NO 3-ion is more bioavailablein water than feedstuffs. 312-314 The experiments thisconclusion was drawn from, however, were based uponaqueous NO 3-administered directly into the stomach vs.contaminated feedstuffs offered ad libitum. 314 The mostimportant determinant of NO 3toxicity seems to be howrapidly a given dose of NO 3-is administered, rather thanwhether it is in feed or water. 314,331,332 For example, thesingle oral median lethal dose (SOLD 50) of NaNO 3incows was reported to be 328 mg/kg BW when given atonce, but when the same dose was spread over 24 hours,the LD 50increased to 707-991 mg/kg. 331ToxicityAlthough the most common source of NO 3poisoning inlivestock is contaminated feedstuffs, NO 3--contaminateddrinking water has poisoned people and animals. 320,333-336The mechanism of poisoning involves GI microbialreduction of the NO 3-ion to NO 2-, which is absorbedinto the bloodstream where it oxidizes the ferrous ironatoms (Fe +2 ) in hemoglobin (Hb) to the ferric (Fe +3 )state, resulting in methemoglobin (metHb), which can-25
not transport oxygen from the lungs to the rest of thebody. The exact mechanism by which Hb is oxidized isthe subject of some controversy but is currently thoughtto be a multi-step autocatalytic process involving severalfree radicals. 328 The end product of this reaction is NO 3-,which is eliminated via urine and saliva. As might beexpected, the clinical signs of acute NO 3poisoning (cyanosis,hyperpnea, muscle tremor, weakness, collapse, anddeath) reflect the effects of anoxia on critical organs suchas the brain and heart. Pregnant animals that surviveepisodes of acute NO 3poisoning during the latter partof pregnancy may abort within one to two weeks. 333,337-340Poisoning during earlier pregnancy does not usually resultin abortion. 313,331,333,341As might be expected from the toxic mechanism, monogastricanimals (with the exception of human infants)seem to be relatively resistant to the effects of NO 3compared to ruminants. Textbooks suggest NO 3isapproximately 10-fold more toxic in ruminants thanmonogastric animals. 317 Burwash et al. 342 fed six mareshigh NO 3(1.7-1.85%) oat hay <strong>for</strong> 13 days. Althoughthe serum NO 3-concentration increased significantly,there was no change in metHb concentration, no effectson blood chemistry parameters, and no clinical signs ofpoisoning. They concluded it is safe to feed horses dietscontaining 2% NO 3and “likely much higher” concentrations.Mice exposed to drinking water containing 1,000mg NO 3-/L <strong>for</strong> 18 months excreted more ammoniumion than controls early in the study and may have diedslightly sooner (17.5 months vs. 18 months) but did notshow any signs of poisoning. 343 Seerley et al. 344 fed watercontaining 1,465, 2,900, or 4,400 mg NO 3-/L as NaNO 3to weanling pigs <strong>for</strong> 84 days with no effect upon rate ofgain, water consumption, or clinical signs of toxicity. Thedifference in toxicity between animal species is not nearlyas pronounced <strong>for</strong> NO 2. 317 Although rare, monogastricanimals have been acutely poisoned by the NO 2-ion fromwater 335 and feedstuffs. 345Wright and Davison 346 reviewed the literature andconcluded the LD 50of NO 3in ruminants was between700-985 mg NO 3/kg BW when fed as dry feed. Experimentally,sheep have been acutely poisoned by NO 3dosesas low as 300 mg/kg BW 323,325,329,347 ; however, doses aslarge as 800 mg/kg BW have been fed without measurableeffects. 323,326,327,340,347,348 Field reports have incriminatedfeedstuffs containing as little as 2% ppm dietaryNO 3(which would provide about 500 mg NO 3/kg BW)as causing acute lethality in sheep . 349,350 Experimentally,3.4% dietary NO 3, fed as pigweed or oat hay killedtwo of five ewes. The lethal dosages, calculated fromconsumption data, were 660 and 730 mg NO 3/kg BW,respectively. Campagnolo et al. 351 reported the accidentalpoisoning of several animals, including sheep, by watercontaining 6,000 mg NO 3-/L at a county fair; however,the water contained several other substances that mightalso have been toxic.Cattle have been experimentally poisoned by 520 mg/kgBW or more NO 3incorporated into feedstuffs 341,346,352,353 ,and as little as 200 mg/kg BW may be toxic if givenby gavage. 354 Several investigators 324,354,355 consistentlyproduced sublethal toxicity with 200-300 mg NO 3/kgBW in order to test various protective strategies. Otherinvestigators 322,356,357 failed to demonstrate toxicity at dietaryconcentrations as high as 0.9% (approximately 225mg NO 3/kg BW), although one 322 reported that sustainedexposure enhanced the ability of the rumen microflorato degrade NO 3-and NO 2-. Calves were experimentallypoisoned by drinking water containing 2,500 mg NO 3-/L (250 mg/kg BW), but none were affected by 2,000or less. 338 Older texts and reviews variously describe theminimum toxic dose in cattle as 169-500 mg NO 3/kgBW. 313,317,358There are numerous anecdotal reports of acute NO 3poisoning in cattle associated with contaminated feedstuffs.O’Hara and Fraser 359 summarized 10 episodes ofacute NO 3poisoning in New Zealand in which mortalityvaried from less than 1% to almost 50%. Forage concentrationsassociated with these cases ranged from 0.3-5.3%NO 3(mean = 3.3%) with variations of 1-2% NO 3betweensamples from the same premise. In one extensivelyinvestigated case, 23 of 50 calves turned into a ryegrasspasture containing 6.6-8.9% KNO 3(4-5.3% NO 3) diedwithin a 12-hour period. 359 In another instance, calvesdied if left on a ryegrass pasture containing 3.6% NO 3<strong>for</strong> more than one hour. 360 A dose of NO 3, later calculatedto be 170 mg NO 3/kg BW, from contaminatedhay killed seven of 200 heifers. The herdsman triedto dilute the toxic hay in half and killed seven more. 361The authors speculated that concurrent overfeeding ofmonensin enhanced ruminal reduction of NO 3-to NO 2-,thus potentiating the toxicity of the hay. Harris andRhodes 362 , summarizing the experience of farmers duringa severe drought in Victoria, Australia, reported severalhundred animals were killed by plants containing “over1.5% NO 3.” Three cows fed hay containing 1% NO 3died within 30 minutes. 353 Eleven cows aborted, and 73of 153 died when fed sudax hay containing 1.1-3.1%NO 3. 363 McKenzie summarized several cases with acute26
mortalities of 16-44% on button grass (2.4-7.2% NO 3)grown in N-rich soil in Queensland, Australia. 349 Animalsgrazing the same grass in adjacent paddocks withoutthe extra N were unaffected.Although not as common as poisoning from feedstuffs,contaminated water has resulted in acute poisoning,including abortions and death. Seven of 12 cows diedshortly after drinking water containing 2,790 mg NO 3-/L. 336 Several authors reported lethality as a result offertilizer-contaminated water ( 1,000-6,000 mg NO 3-/L). 333,351,364 Contaminated liquid whey, fed in additionto water and containing 2,200-2,800 mg NO 3-/L, killed17 of 360 cattle. Whey containing only 400-800 mgNO 3-/L did not kill any animals, but it did result in 26of 140 cows aborting. 333 Yong et al. 334 reported that water,contaminated with 4,800 and 7,000 mg NO 3-/L as aresult of blasting water holes, killed 16 of 100 and fourof 90 cows in two separate incidents in Saskatchewan,Canada.It is known the NO 2-ion may react with secondaryamines (common in many foodstuffs) under conditionstypical of the adult human stomach (pH 1-4) to<strong>for</strong>m nitrosamines. 365-367 Many nitrosamines are potentanimal mutagens and carcinogens. Bacterial reductionof NO 3-to NO 2-does not occur under the acid conditionsnecessary <strong>for</strong> nitrosamine production, or vice versa,but it is theoretically possible NO 2-excreted in salivaor ingested in water might cause cancer in people. Inpractice, however, salivary secretion contributes much lessNO 2-than other sources such as vegetables, and attemptsto link nitrosation, mutagenesis, and/or cancer withdrinking water NO 3consumption have been negativeor only equivocal. 365-371 This, together with the fact mostherbivores have GI conditions that are even less proneto nitrosamine <strong>for</strong>mation than humans, suggests canceris not a likely sequella of NO 3exposure in our species ofinterest. Elevated NO 2is a potential acutely toxic hazard,however. Four of four sows were killed by drinking1,940 mg NO 2/L water. 335 Nitrite is reported to be 2.5times more toxic than NO 3in ruminants and 10 timesmore in monogastrics 317 , and the minimum toxic dose isreportedly between 20-90 mg NO 2/kg BW in pigs and90-170 mg NO 2/kg in cattle and sheep. 313,358Chronic NO 3poisoning is another area of controversy.Mice exposed to 1,000 mg NO 3-/L in drinking water <strong>for</strong>18 months (life time) died prematurely starting at 17.5months. The result was of only marginal statistical significance,and no possible mechanism <strong>for</strong> the result wasproposed. 343 Mice exposed to 100 mg NO 3-/L showed noeffects in any parameter measured (liver function, kidneyfunction, serum protein, etc.). Seerley et al. 344 fed breedinggilts NaNO 3in water to provide 1,320 mg NO 3-/L<strong>for</strong> 105 days with no effect. Similar results were reported<strong>for</strong> weanling pigs. 372,373 Fan et al. 374 reviewed the veterinaryliterature on chronic NO 3toxicity and concluded it“failed to provide evidence <strong>for</strong> teratogenic effects attributableto NO 3or NO 2ingestion.” A retrospective epidemiologicstudy of pregnant women in the Mt. Gamblerregion of Australia indicated a “statistically significantincrease in risk of bearing a mal<strong>for</strong>med child” in womenwho drank water with more than 66 mg NO 3-/L, but itdid not take into account other factors associated withthe water wells. Bruning-Fann et al. 375 surveyed waterfrom 712 swine operations in the United States andfound no differences in litter size or piglet mortality attributableto well-water containing NO 3-(1-443 mg/L).After a widespread drought in the American Midwest inthe mid-1950’s, several authors summarized the experienceof multiple field investigations. 376-378 Purportedly,feed concentrations greater than 0.5% NO 3or watersupplies containing more than 500 mg NO 3-/L werehazardous to cattle fed “poor quality” rations. Case 377was first to propose that NO 3interfered with vitamin Ametabolism. The results of many controlled experimentssince then have rendered this theory “questionable”. 312Sheep fed 2.5% NaNO 3(approximately 1.75% NO 3)diets <strong>for</strong> 135 days had slightly lower liver vitamin Aconcentrations than controls, and gains were depressed.A second replicate of the same experiment did not exhibitdecreased vitamin A nor was there an increase in metHbor signs of toxicity in either group. 348 Fourteen yearlingsteers were divided into seven groups and treated withvarious combinations of NO 3-in drinking water, NO 2-in drinking water, E. coli, and a “thyroid depressant.”Creative use of statistics demonstrated depressed caroteneutilization, but there were no other effects. 379 On theother hand, heifers fed various amounts of NO 3up to0.9% NO 3in diets containing 20% or 40% concentratedid not exhibit any difference from controls in caroteneconversion or hepatic retinol concentrations. 356 Feedlotcattle fed 0.81% dietary NO 3as NaNO 3exhibited poorgains as a result of decreased feed consumption. Gainswere not improved by supplementing with 12,000 IUvitamin A. 357 Emerick 380 reviewed the literature and concludedthat chronic effects involving vitamin A, thyroidfunction, and other hypothetical chronic mechanismsonly occurred at doses that were nearly toxic due tometHb <strong>for</strong>mation.27
Winter and Hokanson 381 fed varying amounts of NO 3(330-690 mg/kg BW) to dairy heifers as part of their rationto maintain metHb levels at either 25-30% or 50%<strong>for</strong> the last six months of pregnancy. One animal aborted,possibly as a result of NO 3intoxication and two diedof acute poisoning after a diet change, but no chroniceffects could be ascertained. Crowley et al. 332 in what, todate, has been the most rigorous experimental attempt toproduce chronic NO 3poisoning in dairy cattle, fed highNO 3-water (384 mg NO 3-/L) <strong>for</strong> 35 months with no effectson conception rate, twinning, stillbirths, abortions,retained placenta, or a variety of production parameters.The only statistically significant effect was a slightly lowerfirst-service conception rate in the NO 3group. Theauthors concluded that, in a herd fed a balanced ration,“water containing up to 400 ppm NO 3should not causeany serious problems.” 332 Ensley 382 attempted an epidemiologicapproach to the question of high NO 3water<strong>for</strong> dairy cattle. In a survey of 128 Iowa dairies withwater concentrations from 1-300 mg NO 3-/L, he foundwater NO 3concentrations were positively correlated withservices per conception, which agrees with the results ofCrowley et al., but several other potentially confoundingfactors such as the size of the farm and other contaminantsin the water were also positively correlated withNO 3concentrations.Other attempts to produce chronic NO 3poisoning inruminants have been unsuccessful. Sinclair and Jones 327dosed ewes with 15 g KNO 3(similar to 1.5% in <strong>for</strong>age)<strong>for</strong> two months and then sprayed the same dose of NO 3on the daily hay ration <strong>for</strong> another seven weeks. Eweswere fed diets containing 0.2-2.6% NO 3as NaNO 3orfrom natural sources <strong>for</strong> 12 weeks with no effects onhealth or pregnancy. 340 Despite elevated serum NO 3-concentrations,there were no effects on metHb, body condition,or reproduction in the treated group. Whethersfed NaNO 3in drinking water to provide 1,465, 2,900,or 4,400 mg NO 3-/L <strong>for</strong> 84 days did not differ fromcontrols in gain and water consumption, and only modestincreases in metHb concentrations were seen at thehighest dose. 344 Feeder lambs fed 3.2% dietary KNO 3(1.9% NO 3) until slaughter differed from controls onlyin “carcass quality 326 .” Emerick 380 reviewed the literaturein 1974 and concluded that feeds containing less than0.44% NO 3and water with less than 440 mg NO 3-/Lwere “well within a safe range <strong>for</strong> all classes of livestock.”SummaryThere is no question NO 3contamination of drinkingwater can result in acute death and/or abortion in ruminantlivestock. Cattle are usually reported to be moresusceptible than sheep, with monogastrics such as horsesand swine being relatively resistant. Surprisingly, we wereable to find only one report of NO 3poisoning (fromfeedstuffs) in wild ruminants 383 , but, given the physiologicalsimilarities with domestic animals, it is reasonable toassume deer, antelope, and elk are also susceptible.The chronic toxicity of very low doses of NO 3is controversial.Despite repeated attempts (and failures) toreproduce vitamin A deficiency, hypothyroidism, or otherchronic <strong>for</strong>ms of NO 3toxicity, experimentally it does notseem that dietary concentrations significantly less thanthose required <strong>for</strong> acute intoxication cause measurableill-effects in domestic ruminants. While there is no questionNO 3can produce abortions in ruminants, the doserequired appears to be very near that required <strong>for</strong> acutetoxicity. The most scientifically rigorous examination ofchronic NO 3toxicity to date 332 concluded that water concentrationsless than 400 mg/L (the concentration tested)should not pose any hazard to a well-managed herd.The lowest toxic dose of NO 3in cattle in the experimentalstudies we reviewed is somewhat less than 200 mgNO 3-/kg BW, although there were several experimentsthat failed to produce any effect at considerably higher (asmuch as 800 mg/kg BW) doses. Clinical (i.e. anecdotal)reports, in particular those of Yeruham et al. 384 and Slenninget al. 361 , push the minimum toxic dose down to near100 mg NO 3/kg BW. There are some uncertainties associatedwith these two reports. Yeruham did not specifythe amount of toxic whey consumed (we assumed 20%BW when figuring a dose as it occurred in a hot climate),and there was a two-fold variation in analytical resultsbetween samples. Slenning et al. suggested other factors,notably overfeeding an ionophore, might have potentiatedthe toxicity of NO 3. The next lowest concentrationreported to be acutely toxic was 1% NO 3in Chenopodiumhay, which would provide approximately 250 mgNO 3/kg BW in cattle under the assumptions outlined inthe Introduction. Nitrate in water is additive with NO 3in feedstuffs, with a given dose in water being somewhatmore potent than in feed because it is consumed morerapidly.28
Assuming negligible <strong>for</strong>age NO 3concentrations, a waterNO 3concentration of 500 mg NO 3-/L (measured asNO 3-ion) would provide 100 mg/kg BW, which wouldprovide a two-to-three fold margin below the 200-250mg/kg BW dose above. If <strong>for</strong>age concentrations arehigher (not a rare occurrence in the Great Plains) thepermissible water concentration should be adjusteddownward.The NO 2-ion is commonly described as approximately2.5-fold more toxic than the NO 3-ion in ruminants(10-fold more toxic in monogastrics), which implies asafe threshold of about 200 mg/L. We were, however,unable to find sufficient experimental studies or welldocumentedfield investigations upon which to base anyconclusion about maximum safe concentrations. Thisis probably due to the fact NO 3-is the more stable <strong>for</strong>mof the two in surface waters and feedstuffs, and NO 2-isonly rarely present in negligible concentrations. Garnerdescribes the minimum lethal dose of NO 2in swine (themost sensitive species) as 40 mg/kg BW 358 , which translatesto 200 mg NO 2-/L in drinking water under veryconservative assumptions. Intravenous administration(the most potent route of exposure <strong>for</strong> most toxicants) of12 mg NO 2-/kg BW to cattle and 17.6 mg NO 2-/kg BWto sheep did not produce any reported toxic effects.Obviously, this is an area that needs further research,but we believe, based upon the existing knowledge base,100 mg NO 2-/L (as the nitrite ion) should not causepoisoning in livestock.29
7 pHpH is defined as “the negative log of the hydrogen ion(H + ) activity,” although “concentration” is often substituted<strong>for</strong> “activity” in a working definition. 385 In otherwords, if the pH is 7.0, the H + concentration ([H + ]) is10 -7 moles per L; if the pH is 3, the concentration is 10 -3 .<strong>Water</strong> with a pH below 7 is “acidic,” and water with a pHabove 7 is “basic” or “alkaline.” The definition of “normal”water pH varies between authorities, but it is usuallydescribed as somewhere between 5.5-6.5 and 8-9. Bycomparison, vinegar is pH 3, colas are between 3-4, beeris between 4-5, and milk is around pH 6.4. A relatedmeasurement, alkalinity, is based upon the capacity ofa water sample to resist a change in pH and is usuallyreported as mg/L of CaCO 3. The pH controls solubilityand concentrations of elements in water. For example,many metals precipitate out of alkaline water, whereasmany dissolve in acidic water.<strong>Water</strong> pH impacts the effectiveness of various watertreatments and its palatability <strong>for</strong> animals. For example,the effectiveness of chlorination is reduced at a high pH.Low pH may precipitate or inactivate medications commonlydelivered in drinking water. Sulfonamides are aparticular concern in this respect as precipitated medicationmay leach back into the water after treatment hasended, contributing to potential drug residues in foodanimals. Acidic water tends to have a sour taste; basic isdescribed as metallic. The taste threshold <strong>for</strong> hydrochloricacid is as low as 0.0001 mol/L. 385 Acid water also tendsto dissolve metals from plumbing and soil it contacts,further impacting palatability.FunctionIn the body, extracellular fluid (ECF) is normally maintainedwithin a very narrow range centered around pH7.4. 385,386 A number of critical physiological processesare pH-dependent, thus any significant departure from“normal” may be harmful to the organism. 386MetabolismThe acid-base balance in mammals represents a dynamicequilibrium between metabolic acid production and itselimination. As such, it is influenced by a number ofinterdependent processes, especially respiration and urineproduction, chemical buffering by bone and other tissues,and several dietary elements. A comprehensive review ofthese processes is beyond the scope of this report, but,in brief, a decrease in plasma pH from normal (acidosis)stimulates increased respiration, decreasing the bloodconcentration of CO 2that would otherwise react withwater to <strong>for</strong>m carbonic acid (H 2CO 3). It also stimulatesthe kidney to produce urine that is more acidic. It doesthis by increasing elimination of the H + ion. The netresult is an active elimination of acid and an increase inplasma pH back towards normal. 385,386 The H + ion mayalso react chemically with buffering molecules in bone,minimizing the magnitude of any pH change. 387,388Certain nutrients, referred to as “strong ions,” while notacidic or basic in the chemical sense, influence animals’acid-base balance by shifting the equilibrium of internalhomeostatic processes to enhance or inhibit the eliminationof H + from the body. For example, diets rich in Na +and K + tend to “push” the body in the alkaline direction,whereas Cl - , as ammonium chloride (NH 4Cl), is usedclinically to move the balance in an acidic direction.Dairy nutritionists compound rations on the basis of the“strong ion difference” equation ((Na + +K + )-(Cl - +S 2- )). 386Diets with a negative strong ion difference produce mildacidosis shortly be<strong>for</strong>e lactation, which decreases theincidence of milk fever. 389-391ToxicityExcessively acid or basic drinking water can theoreticallyaffect animals in four ways. First, extremes of pH mayresult in tissue damage to the mouth and oropharynx,causing irritation and refusal to drink. Second, unusualextremes of pH may dissolve materials from pipes,ditches, etc., which are toxic or impart an unpleasanttaste to the water. For example, Cu, Fe, and Pb concentrationshave all been shown to increase in acidic wateras a result of leaching the metals from plumbing. 392-395Consumption of acidic drinks may dissolve dental enameland weaken teeth. 396,397 Finally, consumption of a largeamount of excessively acid or basic water could theoreticallyshift the body’s acid-base balance.31
We were unable to find any reports detailing acute toxicityas a result of drinking extremely acid or basic water,although co-author Merl Raisbeck has investigated fieldcases in which cattle drank extremely basic solutions(pH 12-14) resulting in erosions and hemorrhage in themouth and esophagus.“Acid rain,” precipitation rendered acidic by atmosphericpollution, is a well-recognized problem in aquatic organismsbecause toxic elements, especially Al, are leachedfrom solids that come in contact with the acidic water.It is especially problematic in poorly buffered surfacewaters of northeastern North America. 398 Mammals areconsiderably less sensitive to the effects of dissolved metalsthan fish, but acidic water supplies have been suggestedas contributing to the presence of Pb and Cu indomestic drinking water, a possible concern <strong>for</strong> humanhealth. 392,393,395 Even if not present at toxic concentrations,many elements impart a repellent taste to water.Despite the hypothetical potential of acidic (pH < 5.5)water to cause acidosis in animals, water systems inlaboratory animal colonies and, to a lesser extent, swinefacilities, are commonly acidified to minimize bacterialinfections. 396,399-401 It is thought the acidified environmentprotects the intestinal epithelial barrier from bacterially-mediateddisruption as well as reducing bacterialcontamination in the water itself. 399Some effects have been observed in ruminants andmonogastrics due to the ingestion of acidic feed andwater. Acidogenic rations are fed to dairy cattle duringlate pregnancy to prevent milk fever. For example, theaddition of NH 4Cl and ammonium sulfate ((NH 4) 2SO 4)at 98 g apiece/head/day to the diet of lactating dairy cowslowered blood pH, increased blood calcium (Ca 2+ ), andincreased excretion of urinary Ca 2+ and the ammoniumion (NH 4+). 390 The same amount of these salts added todrinking water would result in a pH of approximately5.5. Mineral acids (HCl and H 2SO 4) have been fed toprevent milk fever. 402 Dairy cows given rations containing0.65% or 1.8% hydrochloric acid (HCl) (equivalentto pH 2-3, respectively, if added to drinking water) hadincreased blood Ca 2+ , a small (0.05) decrease in bloodpH, acidic urine, and a decreased incidence of milkfever. 391 Rats given water acidified to pH 2.0 with HClor H 2SO 4<strong>for</strong> six weeks exhibited somewhat decreasedfeed intake and water intake, and weight loss comparedto those fed pH 2.5 or pH 7.0 water; however, stomachpH values were not statistically different amongst treatmentgroups. 403 Rats consuming water acidified to pH2.5 with HCl <strong>for</strong> six to 11 months showed no changes inweight and “negligible” damage to tooth enamel. 397 Ratsdrinking water with pH 2 <strong>for</strong> 21 weeks drank slightlyless than controls, while those consuming pH 3 watershowed no measurable effects in any health parameter. 404<strong>Water</strong> with a pH of 2.5 given to rats <strong>for</strong> 30 days resultedin decreased water intake, while water with pH 3 given torats produced no growth deficits. 396 Rats drinking waterwith a pH of 1.4-3.5 <strong>for</strong> 42-84 days showed acceleratederosion on the tooth surface; however, oral cavity pH wasunchanged. 405 Mice consuming acidified water (pH 2.0)<strong>for</strong> 120 days had slightly decreased reticuloendothelialclearance rates when compared to controls, possibly asa result of decreased growth and smaller spleens. 406 Itis questionable if the physiologic effects in these reportsare a direct result of acidic water on systemic acid-basestatus, per se. Even a study that reported some relativelysubtle effects (decreased gains) in rats at pH 2.5 or less,gastric pH was unchanged, 403 and rats and rabbits fed pH2.3-2.5 water <strong>for</strong> seven months maintained normal bloodpH. 401Several experiments reported no effects when acidic waterwas fed, and it is commonly believed that acidifyingwater to approximately pH 3 is beneficial in rodent colonies.Rats consuming water with pH of 2.5 gave birth toand weaned more pups than control animals. 407 Rats andrabbits ingesting water at pH 2.3-2.5 <strong>for</strong> seven monthsshowed no affect on health as measured by growth andmultiple blood parameters. 401SummaryExisting human drinking water standards (pH 6.5-8.5)were established decades ago <strong>for</strong> aesthetic reasons (especiallytaste) and to protect plumbing from corrosion,rather than upon health-based criteria. 392,408 Althougha number of Cooperative Extension Service Web sitessuggest water below this range will produce pathologicacidosis in cattle, none we examined offered hard evidence.Nor were we able to find any references to directhealth effects of moderately acidic or basic water in animals.There are a number of references to the beneficialeffects of acidifying laboratory animal and swine waterwith mineral acids to pH 3. The only adverse effects inthese reports were relatively subtle and occurred at pH
<strong>for</strong> basic drinking water. From a purely pathophysiologicalstandpoint, it seems unlikely that water with apH between 3.0 and 7.0 would cause health problemsin otherwise normally managed animals. An exceptionmight be feedlot ruminants, which are often marginallyacidotic as a metabolic consequence of the high solublecarbohydrate rations they receive. In this case, acid watermight be sufficient to trigger a crisis.The other potential adverse effects of basic or acidic waterinvolve mobilization of potentially toxic substances (e.g.metals) from plumbing or soils. While it seems unlikelythe amounts mobilized would be sufficient to actuallycause poisoning under most conditions, it is quite probablethey would be large enough to cause water refusal.Because the effect of any given pH on palatabilitydepends upon what the water contacts, there is no way tomake any wide-reaching recommendation in this regard.We suspect the commonly touted acceptable ranges<strong>for</strong> drinking water pH (a low of 5.5-6.5 and a highof 7.5-9.0) are excessively conservative from a strictlyanimal health standpoint, at least on the acid side, butthere are not sufficient experimental and/or clinicaldata to offer a specific alternative.33
8 SeleniumSelenium (Se), a metalloid that shares many chemicalproperties with S, is predominantly present in cretaceousrocks, volcanic material, seafloor deposits, and glacialdrift in the Great Plains. 409 It can be present in soil atlevels sufficient to cause toxicity or low enough to resultin deficiency in grazing animals. Either outcome canresult in serious economic losses to livestock producersand illness and/or death in wildlife. Normal soil concentrationsrange from 0.1 to 2.0 μg total Se per gram ofsoil; however, in seleniferous areas such as <strong>Wyoming</strong>, soilscan contain as much as 30-324 μg Se per gram of soil. 410Plants grown on such soils tend to accumulate Se and,depending upon the species, may, in fact, bioconcentrateSe to concentrations in excess of 10,000 ppm.<strong>Water</strong> in contact with seleniferous rocks and soils (e.g.irrigation wastewater) may also accumulate Se. 411,412 Themost common <strong>for</strong>m of Se in <strong>Wyoming</strong> surface watersis the selenate (SeO 42-) ion. “Normal” surface water isdescribed as containing less than 2 μg Se/L 411 , and it isthus not normally a major source of Se <strong>for</strong> livestock andmammalian wildlife; however, poisoning as a result ofseleniferous water has occurred in horses and sheep. 413-415Dissolved Se becomes concentrated in successive levels ofthe aquatic food chain and is a major concern <strong>for</strong> waterfowlthat depend upon aquatic biota <strong>for</strong> food 411,416,417 ;however, aquatic bioconcentration does not pose a hazardto large herbivores (e.g. cattle, elk) under normal conditionsas their intake of algae and aquatic organisms isvery small. Interestingly, bioaccumulation of Se in theaquatic food chain actually removes Se from the watercolumn, 411,418 thus decreasing the risk to large mammals.Forages irrigated with seleniferous water containelevated Se concentrations and can pose a risk to grazinganimals. 411,412,418 While each of the preceding sources isimportant, this report is concerned specifically with thehazard posed to livestock and wildlife by Se in drinkingwater and will focus upon that source.EssentialitySelenium is an essential trace element. Most authoritiesagree that, worldwide, deficiency is a more commonproblem than toxicity, and, thus, <strong>for</strong> the last 40 years,much more research has focused upon the effects ofinadequate dietary Se than too much. This research maystill be useful <strong>for</strong> its insight to Se metabolism. Within thebody, Se is a component of several enzyme systems, mostinvolved in catalyzing oxidation-reduction reactions. 419,420The Se-requiring system thought to be most responsible<strong>for</strong> damage in deficiency situations is glutathione peroxidase.410,421 Selenium supplementation decreases the incidenceof white muscle disease, a degenerative conditionin muscle resulting from oxidant stress. 421-423 The FDApermits 0.3 ppm Se (total ration) as a feed additive, up to0.7 and 3 mg Se per head per day as a feed supplement<strong>for</strong> sheep and beef cattle, respectively, and in <strong>for</strong>tificationmixtures up to 90 and 120 ppm Se <strong>for</strong> sheep and cattle,respectively. 424 Deficiency is rarely a problem in <strong>Wyoming</strong>and northern Great Plains states. 425,426MetabolismSelenomethionine is the main <strong>for</strong>m of Se in common<strong>for</strong>ages, even though it is not a major component of accumulatorplant species. 427-429 It constitutes the majorityof ingested Se, however, as accumulator plants arehighly unpalatable and are usually avoided to the pointof starvation. 430 <strong>Water</strong>borne Se, usually selenite (SeO 32-)or selenate (SeO 42-) ions, normally comprises a relativelysmall portion of large herbivores’ total exposure; however:1) water concentrations sufficient to cause poisoninghave been recorded in <strong>Wyoming</strong> 431,432 ; 2) poisoning hasoccurred in livestock as a result of Se contamination associatedwith mineral extraction; and 3) Se-contaminatedwater has the potential to add to the already high background<strong>for</strong>age concentrations common to many parts ofthe Great Plains.Dietary Se is absorbed from the small intestine in bothruminant and monogastric species. Selenocysteine andselenomethionine are transported across the intestinalepithelium by active amino acid transport mechanisms. 433Selenite is absorbed passively by simple diffusion, butSeO 42-is accumulated via a Na-mediated carrier withsulfate (SO 42-). 419,434,435 To date, there is no evidence <strong>for</strong>homeostatic control of Se absorption as neither dietary Seconcentration nor bodily Se status influences absorption35
efficiency. 436,437 Absorption of Se is influenced by animalspecies and the <strong>for</strong>m of Se ingested. Selenomethionine,the predominant <strong>for</strong>m of Se in <strong>for</strong>age plants, is absorbedmore efficiently than inorganic <strong>for</strong>ms of Se, at least whenthe comparison is based upon tissue concentrations. 4382-Selenate is better absorbed than SeO 3, at least in laboratoryrodents, and both are more efficiently absorbedthan elemental Se. 419 Ruminants reduce Se to unabsorbableselenides in the rumen and are there<strong>for</strong>e, to somedegree, protected against poisoning. It is not unusual tosee selenosis in pastured horses, while cattle on the samepasture remain unaffected. 426 Because the reduction ofSe by rumen microflora is heavily influenced by otherdietary factors, ruminants also exhibit greater variation inSe absorption than monogastrics. 415,439Following absorption, Se becomes associated with plasmaproteins, mainly albumin and selenoprotein-P, <strong>for</strong> transportto tissues. 440 Selenomethionine is non-specificallysubstituted <strong>for</strong> methionine in protein 437 and only becomesavailable <strong>for</strong> either toxicity or nutrition as the proteinturns over. Other <strong>for</strong>ms are incorporated into essentialselenoproteins and/or methylated to dimethylselenideand the trimethylselonium ion <strong>for</strong> elimination. 441 Bothelimination and protein incorporation appear to involvemetabolic activation to a reactive intermediate, which,when cellular defenses become saturated, is responsible<strong>for</strong> most of the toxic effects of Se. 419 Under normalconditions trimethylselonium is eliminated via urineand, to a lesser extent, bile, but as tissue concentrationsincrease to toxic levels an increasing percentage is eliminatedvia respiration as dimethylselenide. 419 Increased(i.e. potentially toxic) dietary Se also results in a shift ofthe distribution of Se between various proteins and bodycompartments 411,438,442 although both the physiologic andtoxicologic significance of this observation is yet to beelucidated.Selenium interacts with a number of other commondietary constituents, primarily at the pharmacokinetic(uptake, distribution, and elimination) level. Theseinteractions modulate both the nutritional and toxicproperties of Se. Arsenic (As) decreases Se toxicity bydecreasing tissue Se concentrations. 35,38,443 Mercury decreasesthe toxicity of Se in birds 37,435 and possibly marinemammals. 411 Sulfur is thought to alleviate Se toxicity. 444When sheep were given 2 mg of Se as sodium selenate(Na 2SeO 4), sheep receiving 0.05% dietary S showed agreater degree of Se toxicity when compared to sheepgiven 0.11, 0.17, or 0.24% S, mostly as added SO 4. 445Dietary SO 4decreased the Se balance in dairy cows fedNa 2SeO 4, reduced the true availability of nutritionallevels of Se, and increased its excretion via feces in dairycattle. 446 This interaction is hypothesized to occur as aresult of S decreasing ruminal pH, altering Se metabolismto unavailable <strong>for</strong>ms, as well as reducing the incorporationof dietary Se into ruminal bacteria. 445,447 Ruminalinteractions, however, are not the only explanation <strong>for</strong> theinhibitory effect of S on Se toxicity. Added dietary SO 4(0.29%) resulted in a 20% growth increase in rats fed10 ppm Se; 0.58% SO 4caused a 40% growth increase;and 0.87% SO 4slightly prevented liver damage due toSe intoxication. 448 The interaction between SO 4and Seis not universal, however. Three thousand mg SO 42-/Lin drinking water failed to alter the uptake of sub-lethaldietary concentrations of sodium selenite (Na 2SeO 3) orselenomethionine in mallard ducks, 449,450 and more researchis needed to elucidate the conditions under whichthe protective interaction occurs. Cyanogenic glycosidesblock uptake of Se and ameliorate Se toxicity 242,451 andhave been investigated as a means of protecting livestockagainst selenosis. Copper and Cd have also been shownto reduce Se toxicity, though the mechanisms are notknown. 37,452 Increased dietary protein has been suggestedto reduce the severity of poisoning. 453 The type of feedstuff(alfalfa vs. grass hay) may influence the bioavailabilityof Se. 242 Even being Se deficient predisposes animalsto Se toxicity. 454ToxicityAlthough essential, Se exhibits a very narrow marginof safety. Toxic effects have occurred in livestock atdietary concentrations only 40-100 times larger thandeficiency. 421 The <strong>for</strong>m of Se administered influencestissue accumulation and thus toxicity. 455-460 The chemicalspecies most common in water are the inorganic ionsSeO 32-and SeO 42-. Selenium toxicity can be manifestedin two <strong>for</strong>ms, acute or chronic. Acute toxicity usuallyresults in GI, liver, kidney, and heart damage, shock, andsudden death. 430,459,461 Selenium has also been implicatedas a cause of hypertension and cardiac damage. 462 Reproductivedeficits, including teratogenesis and embryonicmortality, occur in avian species 411,417,456,463 ; however, thereis no evidence Se is teratogenic in mammals. 464-466 Seleniummay compromise reproduction in mammals. 467,468Chronic selenosis (“alkali disease”) in ungulates is manifestedmost obviously as epithelial damage (hair loss andcracked hooves) as a result of necrosis of the keratinocytes450,469 and ill-thrift.36
A single subcutaneous dose of 2 mg Se/kg BW given topigs caused death after four hours. 470 Three hundredseventy six of 557 calves injected with a Na 2SeO 4solutionthat contained 100 mg Se (0.5 mg/kg BW), ratherthan the 12 mg Se that was intended, died within fiveweeks. 471 Intramuscularly injecting 2 mg Se/kg BW asNa 2SeO 3into four calves caused shock within three hoursand death in 12 hours. 472 Ewes injected intramuscularlywith doses from 0.4-1.0 mg Se/kg BW exhibited dyspnea,anorexia, colic, and a seromucoid nasal discharge.Doses less than 0.6 mg/kg BW were not lethal within192 hours. The calculated LD 50was determined to be0.7+/-0.035 mg/kg. 473 Injecting sheep intramuscularlywith 0.68 mg Se/kg BW as Na 2SeO 3produced deathwithin 20 hours. Smaller doses took longer to be lethal,or they only caused reduced feed consumption and transientsigns of intoxication. 473 Ninety μg Se/kg BW, givenintramuscularly as Na 2SeO 4, produced no clinical signsin ewes. Three hundred fifty μg Se/kg BW was lethal insome ewes. Barium selenate (BaSeO 4), given similarly atrates of 0.225, 0.454, 0.908, 1.816, or 4.9 mg/kg BWproduced no signs other than irritation at the injectionsite. 474Selenium fed as Na 2SeO 3at rates of 22.3, 33.5, or 52.1ppm dietary Se to rats <strong>for</strong> 359 days resulted in the deathsof five of nine, eight of nine, and all nine rats in the threetreatment groups, respectively, as well as decreased fertilityand anemia in the population as a whole. 475 An experimentfocused on Se as a causative factor of tooth decayoffered drinking water containing 3 mg Se/L as Na 2SeO 3to rats <strong>for</strong> four weeks. Two of 15 rats died, and the otherssuffered significantly reduced feed consumption, waterintake, and body weights. 476 Rations containing 6.4ppm Se, as seleniferous wheat or Na 2SeO 3,resulted insignificantly decreased growth and enlarged spleens inrats. Lower concentrations were without measurable effects.Higher concentrations resulted in decreased organweights and anemia and were lethal in some rats. 477In one of the earliest controlled studies of Se doseresponse,Miller and Williams 478 reported the single oral“minimum fatal doses” (which they defined as a doselarge enough to kill 75% of the test group) were 0.68 mgSe/kg BW <strong>for</strong> horses and mules, 1.1-2.2 mg Se/kg BW<strong>for</strong> cattle and 2.2-3.6 mg Se/kg BW <strong>for</strong> swine, all givenas Na 2SeO 3. Although the experimental protocol was notup to modern standards, more recent reports in cattle andhorses usually agree within two- to five-fold. Depression,anorexia, hind limb ataxia, and sternal recumbency developedin 256 pigs in a commercial piggery after the pigswere exposed to feed containing 84 ppm Se. 479 Feed containing8.1 ppm Se resulted in decreased feed consumptionand paralysis in 54 feeder pigs. 480 Rations containing14.75 ppm and 26.65 ppm selenium caused hair loss,reddening of skin, and hind limb ataxia in 80 of 160pigs. Higher concentrations resulted in feed aversion. 481Porcine diets <strong>for</strong>tified with approximately 25 ppm Se asNa 2SeO 3resulted in hair and hoof lesions and weightloss. Higher concentrations produced feed aversion andpoliomyelomalacia. 482 Corn, naturally contaminatedwith 10 ppm Se, fed <strong>for</strong> five months, resulted in two offive pigs developing alopecia and hoof lesions. 483 Pelletedrations containing 26.6 or 31.7 ppm Se, fed as Na 2SeO 3or the Se-accumulator A. bisulcatus, respectively, and fed<strong>for</strong> several weeks, resulted in reduced feed consumption,alopecia, cracked hooves, and paralysis in pigs. 457A single dose of 5 mg Se/kg BW, given orally as Na 2SeO 3,was acutely toxic in lambs. 484 Drenching 190 lambs with6.4 mg Se/kg BW resulted in the death of 180 within 15days. 485 Twenty lambs, four to 14 days of age and averaging4.5 kg, were mistakenly given 10 mg Na 2SeO 3(2.2mg Se/kg BW) orally to prevent white muscle disease;seven died within 17 hours, and eight more experienceddiarrhea as a result of acute toxicosis. As a follow-upexperiment, an additional ewe was injected with 0.45 mgSe/kg BW, which resulted in death within eight hours. 486Glenn et al. 464 fed ewes increasing dosages of Na 2SeO 4<strong>for</strong> 100 days and concluded the “minimum lethal” dosewas 0.825 mg Se/kg BW/day. One of a group of 12 adultewes and their lambs, pastured in an area of seleniferous<strong>for</strong>age and water, died following 14 days; other animalswere unaffected when removed after four weeks. Theexposure from the combination of contaminated <strong>for</strong>ageand water was calculated to be 0.26 mg Se/kg BW/day. 413Sheep were lethally poisoned by grazing high Se <strong>for</strong>age(
significantly impaired in the same dose groups. 488 A doseof 0.15 mg/kg BW (approximately 5 ppm Se in diet), fedas either selenomethionine or Na 2SeO 3, and 0.28 mg/kgBW as Na 2SeO 3in the same experiments were withoutmeasurable effects. 458,488 Dosing calves with 0.25 mg Se/kg BW as Na 2SeO 3via bolus <strong>for</strong> 16 weeks resulted in hairand hoof lesions typical of selenosis and indications ofincreased oxidant stress. 489 Decreased growth and anemiaoccurred in pre-ruminant calves fed 10 ppm as Na 2SeO 4<strong>for</strong> 40 days, but no measurable effects occurred in calvesfed 0.2-5.0 ppm Se. 490There is a relative paucity of quantitative data in horses,although horses are the species most commonly diagnosedwith selenosis at the <strong>Wyoming</strong> State VeterinaryLaboratory. Ponies dosed via stomach tube with 6 or 8mg Se/kg BW as Na 2SeO 3developed signs of acute selenosiswithin six hours; ponies given 2 or 4 mg Se/kg BWremained clinically normal <strong>for</strong> the 14-day experiment. 452A 4-year-old gelding accidentally given 25 mg Se (0.055mg Se/kg BW) orally as Na 2SeO 4<strong>for</strong> five consecutive daysdeveloped a straw-colored exudate on its lips, prepuce,and anus. Within three weeks, its hooves had separatedfrom the coronary band, and alopecia was present on themane and tail. 491 This report did not investigate the Secontent of the rest of the diet. Chronic Se toxicosis wasdiagnosed in seven horses consuming hay containing between0.49 and 58 ppm Se (mean 22 ppm) in combinationwith a mineral supplement that contained 1.9 ppmSe. 492,493 Eight of 20 horses developed alkali disease afterbeing fed alfalfa hay that contained 5.9-17 ppm (mean= 11.9 ppm) Se <strong>for</strong> several weeks. 494 Several horses werediagnosed with alkali disease in southeastern Idaho afterbeing turned into a pasture where the only water supplycontained approximately 0.5 mg Se/L. 495 Assuming waterconsumption of 10% BW, this works out to 0.05 mg/kg BW, but there was probably some additional Se from<strong>for</strong>age in the pasture. Feeding horses oats containing96 ppm added Se (19.2 ppm of total ration) as Na 2SeO 3<strong>for</strong> several months resulted in listlessness, loosening ofhair, softening of the horny wall of hoof, and, ultimately,death. 496 A 9-year-old gelding developed a swollen prepuce,vesicles on its nostrils and mouth, and hoof lesionsof alkali disease after receiving 153.4 mg Se per day in hisfeed (16.4 ppm DM) <strong>for</strong> several days. 497 In Queensland,Australia, horses and sheep were diagnosed with chronicand acute Se toxicity after grazing areas with vegetationcontaining 200-3,038 ppm Se and corresponding soilconcentrations of 64-128 ppm Se. 498In goats, daily oral doses of 5-160 mg Se/kg BW administeredvia capsules were uni<strong>for</strong>mly lethal within31 days. Daily doses of 0.11-0.45 mg Se/kg BW weregiven <strong>for</strong> 225 days with no toxic effects. 499 Elevatedlevels of selenium in the soil (1.45-2.25 ppm Se) and<strong>for</strong>age (40.32-80.64 ppm Se) in West Bengal, a statein India, have been blamed <strong>for</strong> a gangrenous condition(“Deg Nala”) in grazing buffaloes exhibiting hoof cracks,malaise, abdominal pain, laminitis, and edema on thetails and ear tips. 500 Feeding captive pronghorn antelopegrass hay that contained 15 ppm Se <strong>for</strong> 164 days did notresult in any overt clinical signs but did decrease primaryantibody response to a challenge with hen egg albumin. 501The <strong>for</strong>egoing notwithstanding, feeding steers seleniferouswheat, seleniferous hay, or a control diet withsupplemental Na 2SeO 4to supply 12 ppm dietary Se (65μg Se/kg BW/day) <strong>for</strong> 100 days did not produce anyobvious evidence of selenosis. 442,502 Ellis et al. 503 fed adultHolstein cows up to 50 mg Se/head/day (approximately87 μg Se/kg BW/day) as Na 2SeO 3<strong>for</strong> 90 days, followedby 100 mg Se/head/day (approximately 175 μg Se/kgBW/day) <strong>for</strong> another 28 days with no apparent healtheffects. Ewes tolerated 24 ppm dietary Se from Na 2SeO 3or 29 ppm Se from A. bisulcatus <strong>for</strong> 88 days 504 or 10-15ppm dietary Se through two pregnancies. 505 Cristaldi etal. 506 fed wether lambs Na 2SeO 3at dietary Se concentrationsup to 10 ppm <strong>for</strong> one year with no effect on rateof gain, serum enzymes, or pathology and concluded“≤10 ppm dietary Se as selenite is not toxic.” The sameresearch group fed 4, 8, 12, 16, and 20 ppm dietary Se asNa 2SeO 3to adult ewes <strong>for</strong> 72 weeks with no effect uponbody weight nor other evidence of poisoning. 507SummaryAlthough the NRC 421 suggests that horses are about assensitive to oral Se as cattle, sheep, and goats, our researchindicates that species sensitivity is horses > cattle > sheepand goats. Experience at several regional diagnostic labsindicates horses may be poisoned while ruminants usingthe same <strong>for</strong>age and water remain unaffected. 426,508,509With the exception of one study in antelope, there isinsufficient dose-response data upon which to base safetyrecommendations in large mammalian wildlife. Thatsaid, there are reports of elk and deer sharing pastureswith horses, sheep, and cattle, where the horses developedalkali disease, without any measurable ill-effects in the elkand deer. 510 Thus, water that is safe <strong>for</strong> horses should be safe<strong>for</strong> other livestock and ruminant wildlife species.38
The effects of water-borne Se are, like many other elements,additive with feed content. The chemical <strong>for</strong>mof Se in surface waters is predominately SeO 32-or SeO 42-,which is <strong>for</strong>tunate as these ions are the <strong>for</strong>ms mostthoroughly researched. In theory, relatively small concentrationsof Se in water may be sufficient to push animalson moderately high Se <strong>for</strong>ages over the edge of toxicity.Un<strong>for</strong>tunately, the Se content of <strong>for</strong>age and hay in thisregion varies from marginally deficient to downrighttoxic, and other dietary factors such as protein, vitaminE, or cyanogenic glycosides may modify the effects of agiven concentration of dietary Se. For purposes of thisreport, we assumed a “typical” <strong>for</strong>age containing 1 ppmSe (mostly as selenomethionine), normal protein, vitaminE, and other trace element concentrations. The threshold<strong>for</strong> chronic poisoning in horses from the literature is0.05-0.1 mg/kg BW/day. This agrees with unpublishedobservations from our laboratories. Thus, water thatcontains 0.25 mg Se/L, consumed at a rate of 10% BW,combined with “average” Se <strong>for</strong>age, would constitute apotentially hazardous dose. In extremely hot weather,working horses drinking 20% BW of 0.125 mg Se/Lwater (a very conservative assumption) would receive ahazardous dose.In areas where <strong>for</strong>age Se concentrations are higher, orif horses are receiving dietary supplements that containSe, safe water concentrations will have to be adjusteddownward, but under normal conditions, 0.1 mg/Lshould not cause problems.39
9 Sodium ChlorideSodium chloride (NaCl), or salt, was one of the firstnutrients to be identified as essential to life. In ancienttimes, city locations were based upon the availability ofsalt, water, and food. 511 Although ocean water containsapproximately 2.68% NaCl and animals utilizing thisenvironment face the challenge of coping with excessivesalt, most terrestrial animals find it difficult to obtainadequate dietary salt and have developed methods toconserve NaCl. 512-514 Due to the relative scarcity of saltin typical pastures, thousands of metric tons of NaCl areproduced each year <strong>for</strong> use in mineral supplements. 511Sodium (Na) and chlorine (Cl) are rarely found in elemental<strong>for</strong>m in nature; however, most of the toxic effectsof NaCl are due to Na. When appropriate, articles thatmention one or the other separately will be cited.EssentialityBoth Na and Cl are essential elements <strong>for</strong> practically all<strong>for</strong>ms of life. Sodium (Na + ) is the major extracellularcation while Cl - is the major extracellular anion; together,they are responsible <strong>for</strong> maintaining acid-base balanceand regulating the osmotic pressure of bodily fluids. 515,516Excitable cell membranes (e.g. nerve and muscle cells)depend upon tightly regulated Na + and Cl - concentrationsin cells and the extracellular fluid (ECF). Blood, aspecialized <strong>for</strong>m of ECF, consists of approximately 0.9%NaCl. 514 Sodium chloride is reportedly the only mineralanimals truly crave and will actually seek out. 514,517 Thedietary NaCl requirement of swine is between 0.10 and0.14%, and 0.18% Na is needed to achieve optimalper<strong>for</strong>mance. 518-521 Similarly, the optimal dietary Na concentrationin horses is 0.16-0.18% DM 515 and <strong>for</strong> cattleis 0.08-0.1%. 522 Under extreme conditions, such as hightemperatures, lactation, or hard work, these requirementsincrease due to increased excretion of both Na + andCl - . 523,524 The clinical signs of sodium chloride deficiencyare polydipsia (extreme thirst), polyuria (extreme urination),salt hunger, pica (licking <strong>for</strong>eign materials), weightloss, and decreased milk production. 525,526 Chloride deficiencieshave been produced by feeding diets with 0.10%Cl or less and present as anorexia, weight loss, lethargy,decreased milk production, polydipsia, polyuria, andcardiopulmonary depression, etc. as clinical signs. 527-529MetabolismOnce ingested, 85-95% of Na and Cl are absorbed in theGI tract, particularly the small intestine. Large amountsof Na and Cl are recycled into the intestinal tract viasalivary, pancreatic, and intestinal epithelial secretions,as well as bile. The high intestinal Na + concentrationis required to transport glucose, amino acids, and othernutrients across the mucosa. Chloride is also secretedinto the intestine to aid in creating the low pH environmentneeded <strong>for</strong> proteolysis. These secretions must thenbe reabsorbed further down the GI tract to conserve theelements. 514 It has been suggested that elevated dietaryNaCl can increase protein digestion. Hemsley 530 discoveredthat increased NaCl in the diet increased the rate ofpassage of solid digesta from the rumen, which decreasedmicrobial degradation within the rumen and increasedthe amount of protein available in the small intestine.Altered ruminal fatty acid concentrations have also beenrelated to dietary NaCl. 531-533 Dietary Na + and Cl - inexcess of physiologic requirements are usually efficientlyeliminated from the body via the kidneys. 534Potassium is the main intracellular cation, Na is the mainextracellular cation, and Cl - is the main extracellular anion.The relative concentrations of these three elementscreates an electrochemical gradient across cell membranesthat is essential <strong>for</strong> nutrient transport, nerve conduction,muscle contraction, and energy generation, and theyindirectly aid in maintaining pH balance. Imbalancesof these elements result in a variety of disorders fromdecreased gains to acute death. 535-537ToxicityThe toxicity of NaCl is intimately related to the availabilityof water and is sometimes referred to as “sodiumion toxicity-water deprivation syndrome;” however, if thedose of Na + is high enough, Na is toxic regardless of waterintake. 538 If adequate water is present, most animals cantolerate relatively large doses by increasing Na + excretion.534,539-542 If sufficient water is not available, acutetoxicosis results in dehydration, blindness, incoordination,convulsions, recumbency, and death. 205,538,543,544 The41
normal physiological response to elevated dietary NaClis increased water intake; however, if the water containshigh NaCl concentrations, drinking results in even moreNaCl intake and increases the risk of receiving a toxicdose. 542 Even when sufficient potable water is available toeliminate excess dietary Na, every gram of NaCl excretedrequires producing at least 5 ml of urine 545 at a finitemetabolic cost. Thus, slight to moderately elevated Na +may impact growth and per<strong>for</strong>mance. 542,546,547The mechanisms underlying acute toxicity are related tocellular dehydration, or “tissue shrinking,” and edema.When extracellular Na + concentrations become elevated,water is drawn out of the cell down the concentrationgradient, resulting in shrinking. 514,548 Eventually intracellularNa + concentrations adjust to a new equilibrium withthe extracellular fluid (ECF), and cells return to theirnormal volume. By two to three days of exposure to elevatedNa + , neurons have replaced the increased intracellularNa + with “idiogenic osmoles,” hydrophilic, organicmolecules that compensate <strong>for</strong> the attraction of extracellularNa + <strong>for</strong> water. 549 Tissue shrinkage due to elevatedECF Na + results in damage to the small blood vesselsthat supply the superficial portions of the brain. Later,after animals have adapted to elevated extracellular Na +concentrations (whether from excessive dietary Na intakeor water deprivation) and are allowed free access to water,the extracellular fluid becomes diluted and water is drawnback toward the elevated osmolarity inside the neurons,resulting in cellular swelling and damage. In either case,clinical signs result from cerebrocortical (brain) damage.Acute toxicity has been observed in cattle, pigs, dogs, andrats after ingestion of extreme concentrations of NaCl.Ninety-one cattle developed muscular weakness, musclefasciculations, and sternal and lateral recumbency, andthey subsequently died, as a result of drinking water froma tank and lagoon that contained 4,370 and 21,160 mgNa + /L, respectively. 205 Cattle consuming water containing5,850 mg Na + /L experienced a 13.7% reductionin body weight, with corresponding reductions in feedand water intakes. 550 <strong>Water</strong> containing 6,726-6,826 mgNa + /L resulted in a loss of condition, scouring, and deathin 15 of 220 cattle. 551 Six cattle began showing signs ofCNS disruption four hours after consuming 50 kg of asupplement containing 50,000 ppm NaCl (19,500 ppmNa), despite drinking water immediately afterward. 538 Apig owner replaced free-choice NaCl as a salt block withtwo “handfuls” of loose trace mineral salt in 30 gallons ofwater. Within six days, four pigs began champing jaws,frothing at the mouth, and convulsing, and two ultimatelydied. 552 Abruptly switching gilts to a diet containing13,600 ppm NaCl resulted in feed refusal and waterydiarrhea lasting several days. 553 Dosing an 11.3-15.9 kg(25-35 lb) pig with approximately 178.6 g NaCl (69.6g Na + ) in 500 ml water resulted in death within 15minutes. 554 A female dog became blind, convulsed, andeventually died after consuming seawater (26,800 mgNaCl/L) on a hot summer day. 544 Three female Bostonterriers became ataxic, convulsed, and later died afterdrinking water contaminated with brine and containingapproximately 100,000 mg NaCl/L. 555 A male Airedaleterrier began having seizures and eventually died afteringesting a bolus of a salt-mixture clay. The concentrationof NaCl in the clay was not reported; however, itwas stated a minimum of 20 g NaCl still remained in thedog’s stomach. 548 The minimum toxic dose in canineswas estimated at 2,000 mg NaCl/kg BW (780 mg Na/kgBW). 556 Rats refused to drink water containing 25,000mg NaCl/L; death occurred after several days of waterrefusal were followed by gorging on water. 557Chronic toxicity has been investigated under both fieldand experimental conditions. Cattle consuming watercontaining 12,000 mg NaCl/L (4,680 mg Na + /L)throughout the summer months did not become clinicallydehydrated, but they did exhibit diarrhea, a 28.2%reduction in feed intake, and a 69% increase in waterintake. 558 Cattle ingesting water containing 2,500 mgNaCl/L (975 mg Na + /L) <strong>for</strong> 28 days showed increasedwater intake, decreased milk production, and diarrhea. 547Steers fed diets containing 50,000 ppm NaCl (19,500ppm Na) <strong>for</strong> up to 175 days gained less weight andutilized organic matter less efficiently than controls. 531Steers fed high grain diets containing 70,000 ppm NaCl(27,300 ppm Na) <strong>for</strong> 126 days showed increased waterintake, decreased feed intakes, and altered digestionpatterns. 559 Feeding lactating cows low fiber diets inconjunction with concentrate containing 60,000 ppmNaCl resulted in a 6.9% decrease in organic matterconsumption and a 22% increase in water intake, butthese diets had no effect on milk production. 560 Lactatingheifers supplemented with 136 g NaCl/day, beginning42 days prepartum and continuing until 10 dayspostpartum, showed an increased incidence of udderedema. 561 <strong>Water</strong> containing 15,000 mg NaCl/L resultedin decreased feed consumption, decreased body weight,and increased water intake in sheep. 546 Drinking watercontaining 10,000-13,000 mg NaCl/L resulted inneonatal mortality and distress at parturition when givento twin-bearing pregnant ewes. 562 Sheep drinking water42
containing 15,000 mg NaCl/L <strong>for</strong> 21 days consumed lessfeed and more water than controls. 542 Sheep consumingwater containing 20,000 mg NaCl/L <strong>for</strong> three daysexperienced a sharp decline in feed intake. After fivedays drinking the water, the animals’ feed consumptioneventually recovered, suggesting an adaptive response. 563Lambs given 2 g NaCl/kg BW from an early age hadsignificantly lower growth rates, reduced feed intakes, anddiarrhea in comparison to controls. 564 Pigs consuming15,000 mg NaCl/L water <strong>for</strong> 30 days became stiff leggedand nervous, and they had reduced water intakes. 565Hypertension has been produced in rats by offering watercontaining 10,000-25,000 mg NaCl/L <strong>for</strong> six monthsor longer. 566-568 Feeding trials determined the chronicoral LD 50of NaCl fed to rats <strong>for</strong> 100 days was 2.69 g/kgBW. 569Toxicity has also been shown to occur when elevateddietary NaCl is coupled with water restriction. Feeding60 3-year-old steers a supplement containing 4.5 kgNaCl one day prior to withholding feed and water (toobtain fasting body weights) resulted in blindness, incoordination,knuckling of fetlocks, and recumbency in fiveanimals. 543 Goats offered diets containing 30,000 ppmNaCl <strong>for</strong> 30 days showed a 20% decrease in feed intakewhen water was freely available and a 43% reductionwhen water was restricted. 570 Pigs fed NaCl at the rateof 2.4 g/kg BW with restricted water showed “extremesigns” of NaCl toxicity and ultimately died. 571 Sodiumchloride poisoning was diagnosed in a herd of pigs thatexhibited convulsions, an unsteady gait and muscletwitching,blindness, and rapid breathing. The pigs hadbeen without water <strong>for</strong> an undetermined amount of time,and no levels of dietary NaCl were given. 572 Swine beganhaving convulsions and were exhibiting head pressingwithin three days of being purchased at an auction. Itwas determined the clinical signs developed as a resultof the pigs receiving a high salt diet prior to the sale andthen receiving no water during the auction. 573There are several reports that indicate at least some Nacan be tolerated. Offering cattle water containing 4,110mg NaCl/L resulted in increased water intake and diuresis;however, no other effects on animal health were noticed.574 Cattle consuming water with 5,000 mg NaCl/L(2,000 mg Na + /L) appeared clinically normal throughoutthe course of two 30-day experiments. 539 Steers consuming192-193 g NaCl/day <strong>for</strong> 84 days showed noobservable negative effects when ingesting a roughagediet; however, when fed a corn silage diet, the animalsconsuming the high Na diet had reduced weight gainsand feed efficiencies. Roughage diets tend to increasewater intake, potentially diluting NaCl and decreasing itseffects. 532 Sheep consuming water containing 13,000 mgNaCl/L <strong>for</strong> up to 16 months increased their water intake,but they exhibited no other adverse health effects. 540,575-580Rations with a NaCl concentration of 91,000 ppm fed tosheep caused no significant effects on breeding, gestation,lambing, or wool production. 581 Swine consuming 5,150mg NaCl/L water had a drastic increase in water intake;however, no other adverse effects were noticed. 582The limited data available regarding Cl - in water seemsto indicate it is primarily a palatability factor. The EPA’ssecondary water standard <strong>for</strong> human consumptionsuggests that more than 250 mg Cl - /L imparts a “salty”taste. 583 <strong>Water</strong> containing 5,000 mg CaCl 2/L offered tocattle resulted in water refusal despite lack of any otherwater sources. <strong>Water</strong> containing 3,000 mg/L resulted inincreased water consumption and urinary acidificationbut no measurable effects on per<strong>for</strong>mance or health. 584The SO 42-ion was less palatable to beef heifers thanthe Cl - on an equimolar basis. 585 Rats drinking watercontaining 10,000 mg CaCl 2/L were unable to producenormal litters, and 15,000 mg CaCl 2/L reduced growthrates. 586 Conversely, in another study, rats consuming15,000 mg CaCl 2/L adapted, grew normally, reproduced,and were able to suckle their young. 557SummaryThe effects of Na and Cl are difficult to separate sinceneither exists in its pure state in nature, and the elementsusually occur together in water. It is also difficult to separatethe chronic effects of NaCl from those attributed toTDS in the literature, as the Na + and Cl - ions are majorconstituents of salinity under natural conditions. Nevertheless,it is the Na + ion that seems to be responsible <strong>for</strong>most of the recognized effects of “salt” poisoning. 583 Atpresent, there is not sufficient data to make any specificrecommendations regarding Cl - in drinking water <strong>for</strong>livestock or wildlife.The toxic effects of Na are very dependent upon the availabilityof fresh water. If abundant, good quality drinkingwater is available, animals can tolerate large doses of Na.This fact notwithstanding, at some point excess dietaryNa exceeds the ability of the organism to excrete Na + , andacute poisoning results, regardless of water intake. Thethreshold <strong>for</strong> acute toxicity seems to be approximately1g Na/kg BW <strong>for</strong> swine, with cattle equal or slightly lesssensitive and sheep considerably less sensitive (roughly43
2.5 g Na/kg BW). Most animals will limit their consumptionof NaCl to approximately 400 mg Na/kg BW/day, if possible. Beyond this dose, feed intake, waterconsumption, and productivity decline. We couldn’t findsufficient equine-specific data to nominate a toxic dose,but most reviewers indicate horses are roughly similar insensitivity to cattle and swine. Similarly, there is virtuallyno quantitative data on wild ungulates, but there is noreason to suspect wild ruminants are significantly moresensitive than cattle.If the only water available is also the major source ofdietary Na, long-term impacts will occur at lower dosages.Chronic health effects, mainly decreased production,have been reported at water concentrations as lowas 1,000 mg Na + /L in dairy cows; however, other studieswith beef heifers in cooler climates reported only minimaleffects at 1,600-2,000 mg Na + /L. Interestingly, the actualdoses of Na consumed by the cattle in all of these studies(250-400 mg Na + /kg BW) were similar. Dosages greaterthan 800 mg Na/kg BW resulted in effects ranging fromweight loss and diarrhea to death.It is theoretically possible animals maintained on high-Na + water <strong>for</strong> prolonged periods will, if suddenly exposedto low-Na + water, develop acute Na + ion intoxication, andanecdotal reports suggest that such has happened underfield conditions. We were unable, however, to discoversufficient quantitative in<strong>for</strong>mation to make any recommendationsother than animals should be transitionedfrom high to low Na + water sources gradually.Assuming water consumption typical of a rapidly growingsteer (see Introduction) and only background feedNa concentrations, the no-effect level would be about1,000 mg Na + /L or 2,500 mg NaCl/L. Serious effects,including death, become likely at 5,000 mg Na + /L. Werecommend keeping drinking water Na concentrationsat less than 1,000 mg/L, although short-term exposureto concentrations up to 4,000 mg/L should be welltolerated.44
10 SulfurSulfur (S) occurs in nature as free S or combined withother elements in sulfides and sulfates. The most common<strong>for</strong>m in water is the sulfate (SO 42-) ion, althoughsome sulfurous wells may contain relatively high concentrationsof dissolved sulfides. The latter do not persist<strong>for</strong> long under surface conditions but may contribute tohealth problems while they are present. Sulfides in igneousand sedimentary rock are oxidized to sulfate (SO 4)during the weathering process. The resulting sulfate saltsare leached from soils by runoff and may be concentratedby evaporation in playas. Some aquifers are naturallyvery high in SO 42-. Once SO 42-is dissolved in water itcannot be removed unless it is reduced to sulfide by anaerobicorganisms and precipitated in sediments, releasedas hydrogen sulfide (H 2S) or incorporated into organicmatter. 587 Reverse osmosis, distillation, and ion exchangemay be used to remove SO 42-from water; however, noneof these processes is cost-effective <strong>for</strong> livestock undernormal conditions. Sulfur may also be present in organiccompounds synthesized by aquatic biota; however, this<strong>for</strong>m is usually a relatively minor component of the totalwater S content. In 1997, 11.5% of 454 <strong>for</strong>age/waterpairs collected from around the United States yieldeddietary S concentrations potentially hazardous <strong>for</strong> cattle.Thirty-seven % of these elevated pairs originated from thewestern United States, including <strong>Wyoming</strong>. 588EssentialitySulfur is essential <strong>for</strong> health and, in fact, comprisesabout 0.15% of the total body in mammals, where it isa constituent of the amino acids methionine, cysteine,cystine, homocysteine, cystathionine, taurine, and cysteicacid. It is also a component of biotin, thiamin, estrogens,ergothionine, fibrinogen, heparin, chondroitin, glutathione,coenzyme A, and lipoic acid. 589 Calves deprived ofdietary S had smaller livers, spleens, and testes, and largerbrains and adrenals than controls. 590 Lactating dairy cowsrequire between 0.17% and 0.20% total dietary S toremain in positive balance, as S constitutes an estimated0.78% of milk proteins. 591 The nutritional S requirementof monogastric mammals must be provided as two aminoacids – methionine and cystine. Ruminants can useeither pre<strong>for</strong>med amino acids or synthesize S-amino acidsfrom inorganic S; however, the efficiency of the latterprocess varies with other dietary conditions. 592-594MetabolismThe first step in ruminal synthesis of S-amino acids frominorganic S is reduction of the latter to H 2S. 595 Not surprisingly,SO 4is converted to H 2S more efficiently thanpre-<strong>for</strong>med S-amino acids. Halverson et al. 596 examinedsulfide production from various S sources and foundmethionine produced one third the amount of sulfide asSO 4. Under normal circumstances, the reactive sulfideion is combined with carbon by rumen microflora tocreate methionine, homocysteine, cystathionine, cysteine,and other S-amino acids. Under conditions of excessive Sintake, however, significant quantities are reduced to H 2S,and the very toxic gas escapes from the rumen into thesystemic circulation resulting in poisoning. 597-601Excess rumen sulfide may also interact with certaintrace elements, especially Cu, decreasing bioavailabilityand possibly resulting in serious nutritional deficiencies.241,447,602-604 In ruminants, S combines with Mo to<strong>for</strong>m thiomolybdates. These, in turn, <strong>for</strong>m unabsorbablecomplexes with Cu, which irreversibly bind to the solidphase of the digesta, resulting in Cu deficiency. 241 It hasalso been suggested that thiomolybdates interfere postabsorptivelywith Cu incorporation into the enzymessuperoxide dismutase and cytochrome oxidase, compromisingmitochondrial integrity and cell function. 230,241,605Finally, it has been theorized that some of the effects ofexcess dietary Mo are actually due to Mo toxicity per seand not to hypocupremia. 241 Of the three elements, Cu,Mo, and S, S provides the most variation in nutritionaloutcomes due to its multiple metabolic pathways fromthe rumen. Sulfur exits the rumen principally as sulfide,but it can also leave as undegraded protein S or be incorporatedinto microbial protein. Inorganic S from diet,saliva, or degraded protein is the only <strong>for</strong>m of S that willinteract with Mo and Cu. Several factors affect proteindegradation to S, including the supply of degradablenitrogen, the rate of ingestion, the specific population ofrumen microbes, and the availability of readily fermentablecarbohydrates. 24145
Dietary S may also antagonize Cu metabolism in theabsence of excessive Mo. Copper deficiencies occurredin cattle fed 0.3% total dietary S 606 , and 500 mg S/Lwater was hypothesized to cause secondary deficiency asit raised dietary S to 0.35%, both in the absence of excessMo. 230 Sulfur inhibits the uptake of Zn. The interactionbetween Zn and S is further magnified if animals arefed a high fiber diet. 603 Sulfur also decreases the uptakeof dietary Se. 445,607 High dietary concentrations of S arethought to reduce rumen pH, favoring the conversionof Se to biologically unavailable selenide. 445,608 Sulfurmay also reduce incorporation of dietary Se into ruminalbacterial protein. 447 Interestingly, S has been shown toprotect against Se intoxication under some circumstances.445,448Monogastric animals lack the ability to produce S-aminoacids from inorganic S and are thus somewhat less sensitiveto the above-mentioned toxic effects of the sulfideion. For example, the NRC “maximum tolerable” Sconcentration <strong>for</strong> range cattle is 0.5%, whereas 0.69% ofdiet is optimal in rats. 589 Although it is possible <strong>for</strong> a monogastricto generate toxic concentrations of H 2S followingingestion of elemental S, the dosage required is muchgreater than in ruminants. To illustrate this, 14 horseswere mistakenly fed between 0.2-0.4 kg of flowers of S(99% S) resulting in a dose between 333-666 mg/kg BW(corresponds to 11-22% dietary dry matter). The horsesbecame ill within 12 hours, and two died after 48 hours.Post mortem examination of the two deceased animalsrevealed cranioventral consolidation of the lungs, hemorrhagingthroughout the heart and GI, and congestion ofthe liver. 609 Toxic effect(s) of inorganic S salts (e.g. SO 4)in monogastric species are usually related to abnormalitiesin water balance in the GI tract, explaining why clinicalsigns differ between monogastric and ruminant mammals.In swine, toxic effects are generally manifested aswatery feces and have been shown to occur when ingestingwater with concentrations as low as 600 mg SO 42-/L,but they more commonly occur in water containing1,600 mg SO 4/L or higher. 610-612ToxicityAs with all poisons, toxicity depends on dose, route ofexposure, and <strong>for</strong>m of the element. In this report, we aremost interested in ingestion (oral exposure) and SO 42-,as that is the <strong>for</strong>m of S commonly found dissolved inwater. Between 0.3-0.5% of dietary dry matter is therecommended maximum tolerable limit <strong>for</strong> total dailyS intake <strong>for</strong> ruminant animals. 589 The amount of S thatwater contributes to the diet depends on the amount ofwater an animal drinks as well as the concentration of Sin the water. This varies drastically with environmentaltemperature, type of feed, and condition of the animal.In one published example, the amount of S contributedby 1,000 mg SO 42-/L in drinking water varied from0.1-0.27% under different conditions. 613Toxic S concentrations have been shown to reduce thefeed intake, water intake, growth, and per<strong>for</strong>mance ofanimals. Cattle given water containing 1,219 mg SO 42-/Lin conjunction with a diet containing 0.16% S (0.29%total S intake), exhibited depressed dry matter intake(DMI). 614 Adding 0.72% SO 4(0.24% dietary S) to cattlediets reduced weight gains by 50% after the first twoweeks. 615 Concentrations of 0.35% or more dietary S resultedin diminished DMI in lactating dairy cows. 591 <strong>Water</strong>containing 5,000 mg sodium sulfate (Na 2SO 4)/L andgrass hay containing “0.75% SO 4” reduced water intakeby 35% and feed intake by 30% in cattle. 574 Decreases inaverage daily gain (ADG), feed efficiency, and dietary netenergy were seen when heifers were fed 0.25% S as ammoniumsulfate ((NH 4) 2SO 4). 616 Supplying heifers withwater containing 2,814 mg SO 4/L and hay containing“0.55% SO 4” reduced hay intake by 12.4% during thesummer months. 617 <strong>Water</strong> containing 3,087 mg SO 4/Lreduced ADG by 27%, DMI by 6.2%, and water intakeby 6.1 L in steers, and it increased the incidence of polioencephalomalacia(PEM). 618 Cattle on a low plane ofnutrition decreased their water intake when consumingwater with 1,000 mg SO 4/L, and cattle on a high plane ofnutrition had a slight decrease in feed intake when consuming2,000 mg SO 4/L. 619 Concentrations of S greaterthan 0.4%, added as elemental S or Na 2SO 4, decreasedgains in feeder lambs. 594 Approximately 0.5% S addedto rations as calcium sulfate (CaSO 4) or Na 2SO 4resultedin reduced feed intake and daily gains of 163 g/day and191 g/day, respectively, compared to control lambs thatgained 251 g/day. 620On the other hand, when 0.75% S was added as CaSO 4to the concentrate portion of the diet (0.477% totaldietary S) of six Here<strong>for</strong>d cattle, no statistically significantchanges in serum enzyme activity, Se concentrations,weight gains, or general health were noticed. 621 The study,however, was designed to look at S-Se interactions andlacked statistical power to examine growth, ADG, orother measures of per<strong>for</strong>mance, and one of the animalsdied of PEM at the end of the experiment. Cattle offeredwater containing 2,500 mg SO 4/L showed no changes46
in feed or water consumption. The animals consumedan average of 3.9 kg of hay, 3.1 kg concentrate, and 33.1kg water per day, suggesting this level as a safe tolerablelimit. 585 As with the previous study, the number of animalstested was very small. Sublimed S added to the dietof steers <strong>for</strong> 10 weeks at 0.42% did not affect feed intakebut did at 0.98%. 622 Qi et al. 623 added various amountsof CaSO 4to the diet of goats and concluded that optimumfeed per<strong>for</strong>mance occurred between 0.2-0.28%S. 623 Pendlum et al. 624 fed up to 0.3% elemental S tosteers without adverse effects.The most dramatic manifestations of S toxicity in ruminantsare sudden death, with no lesions, and/or PEM.Polioencephalomalacia is a neurological disease of cattleand sheep, resulting in seizures, ataxia, blindness, andrecumbency as the main clinical signs. It is usually fatal.Seven hundred of 2,200 ewes grazing a pasture previouslysprayed with elemental S began showing signs ofabdominal discom<strong>for</strong>t within two hours of exposure, and220 ewes died within five days. Lesions of PEM werefound only in the sheep that had survived <strong>for</strong> five days. 625Animals ingesting water with 4,564 mg SO 4/L and feedcontaining 0.17% S had a 47.6% incidence of PEMand a 33% mortality rate. 626 Six of 110 cows drinking7,200 mg Na 2SO 4/L water developed PEM. 627 Eighteenof 21 herds fed supplements containing 2% inorganicSO 4developed PEM. This supplement provided approximately0.16% S beyond what was in the rest of thediet. 628 <strong>Water</strong> containing 2,000 mg SO 42-/L producedPEM in one of nine steers. 597 Three of 21 steers fed 3,780mg SO 42-/L developed PEM and died. Feeding thiamindid not prevent S-toxicity. 629 Four steers died of PEMon a feedlot in Alberta, Canada, after consuming waterwith 5,203 mg SO 4/L while the temperature was 30 C. 630Four of 40 animals developed PEM after ingesting haywith 0.39% S and water containing 2,250 mg SO 4/L. 631All 10 experimental animals offered water with 5,540mg S/L or 7,010 mg S/L showed signs of PEM. 632 Theincidence of death from PEM in a beef feedlot varieddramatically with environmental temperature, from nonein the winter to 0.8% per month in the summer. Theincrease also corresponded with a 2.4-fold increase inwater intake as a result of summer weather, raising totaldietary S intake to 0.67%. 633 Cows in Canada werestricken with PEM when exposed to 3,400 mg SO 42-/Lwater; no new cases occurred after the water was replaced.634 Sixty-nine animals were affected with PEMafter ingesting a protein supplement containing “1.5%organosulfate” and water containing 1,814 mg SO 4/L. 205Experimentally feeding 0.477% total dietary S resulted inone of 12 heifers developing PEM three days after terminationof the experiment. 621 Polioencephalomalacia hasbeen diagnosed in wild ruminants. 635,636 Tests were notconducted to confirm SO 4as the cause of these cases, butsurface waters in the area where the animals were foundare naturally high in SO 4, and exposure to these waterswas considered likely. 637Sulfate waters are quite unpalatable, and, when given achoice, animals will discriminate against them. A tastetest was conducted between waters containing 1,450mg/L and 2,150 mg/L SO 4and tap water. The cattlediscriminated against the water containing 1,450 mg/Land rejected the water containing 2,150 mg/L, opting<strong>for</strong> tap water instead. 617 Despite the unpalatability, if noother water is available, animals will reluctantly drink waterwith higher SO 4concentrations resulting in potentialtoxicity.SummaryIn ruminants, high dietary S may cause acute death,PEM, trace mineral (especially Cu) deficiencies, and/or chronic, as-yet-poorly-defined ailments that decreaseproduction efficiency. All dietary sources of S (water, <strong>for</strong>age,concentrates, feed supplements) contribute to total Sintake and thus to potential toxicity. The S contributionof water, usually as the SO 42-ion, varies dramatically withenvironmental conditions as water consumption goes upand down.From a strictly theoretical standpoint, the NRC maximumtolerable dose of S <strong>for</strong> cattle is 0.5% of the totaldiet (0.3% <strong>for</strong> feedlot animals). 589 <strong>Wyoming</strong> grasses arereported to contain between 0.13%-0.48% S. 638 Assuming<strong>for</strong>age S concentrations of 0.2% and water consumptiontypical of young, rapidly growing cattle at summertemperatures (30 C), a water SO 4concentration of 1,125mg/L will meet or exceed the NRC’s maximum tolerancelimit <strong>for</strong> S in cattle. Adult bulls, which consumehalf as much water, could theoretically be impacted by2,250 mg/L, and lactating cows would fall somewhere inbetween. In practice, water SO 4concentrations as lowas 2,000 mg/L have caused PEM and/or sudden death incattle. This observation is supported by many field casesinvestigated by the WSVL and other regional diagnosticlabs since 1988. It seems to be contradicted by some ofthe early studies mentioned above, notably Digesti andWeeth 585 , but both probability and the morbidity of poisoningincrease with progressively larger SO 4concentra-47
tions; thus, studies with small numbers of animals easilyoverlook marginally toxic doses. Anecdotal data also indicatecattle are able to adapt to elevated S concentrationsif introduced gradually to potentially toxic waters over aperiod of several days to weeks. The details (i.e. how rapidlydietary S can change) of this process and the effect(s)of other dietary factors such as energy and protein on theprocess are still a matter of conjecture.<strong>Water</strong>borne SO 4is reported to decrease Cu uptake atconcentrations as low as 500 mg S/L as SO 42-. 602,606Whether overt Cu deficiency results depends upon thedietary concentration of Cu, and excess dietary Cu maycompensate <strong>for</strong> some or all of the effect of SO 42-. 308Un<strong>for</strong>tunately, most <strong>Wyoming</strong> <strong>for</strong>ages are marginally todrastically deficient in Cu <strong>for</strong> cattle. Elevated dietary Salso interferes with the uptake of Zn and Se. Trace elementdeficiencies are multifactorial diseases that do notnormally manifest themselves unless animals are exposedto other stressors such as bacterial pathogens, bad weather,shipping, etc. There<strong>for</strong>e, it is difficult, if not impossible,to settle upon a single number that consistentlyresults in deficiency or guarantees safety; however, theNRC recommends “the sulfur content of cattle diets belimited to the requirement of the animal, which is 0.2%dietary sulfur <strong>for</strong> dairy and 0.15% in beef cattle andother ruminants.” 589Relatively low S concentrations (equivalent to 500-1,500mg SO 42-/L in water) have also impacted per<strong>for</strong>mance(e.g. ADG, feed efficiency) in feedlot and range cattlevia a variety of mechanisms not completely understood.614,616,639,640 Loneragan et al. 597 suggested thatH 2S produced from SO 42-, eructated and then inhaled,resulted in pulmonary damage and increased susceptibilityto respiratory infections. Elevated SO 42-also resultsin decreased water intake under experimental conditions.Finally, it is possible some, as yet unrecognized, interactionswith other dietary components result in decreasedutilization and feed efficiency. These effects have obviousimplications <strong>for</strong> animal health, but they are difficult toquantify under field conditions.Monogastrics, such as horses, are at less risk of S effectsthat involve ruminal generation of sulfide. In these species,the principle effect of elevated drinking water SO 4seems to be diarrhea resulting from the osmotic attractionof water into the gut. The relative contributions ofthe SO 42-ion and its associated cation are unclear, butthe literature indicates the effect 1) is transient and notlife-threatening and 2) probably only occurs at concentrationsconsiderably in excess of those toxic in ruminants.There<strong>for</strong>e, concentrations that are safe in ruminantsshould provide adequate protection <strong>for</strong> horses.Assuming normal feedstuff S concentrations, keepingwater SO 42-concentrations less than 1,800 mg/L shouldminimize the possibility of acute death in cattle. Concentrationsless than 1,000 mg/L should not result inany easily measured loss in per<strong>for</strong>mance.48
11 Total Dissolved Solids (TDS)Total dissolved solids (TDS) is defined as all inorganicand organic substances contained in water that canpass through a 2 micron filter. In general, TDS is thesum of the cations and anions in water. Ions and ioniccompounds making up TDS usually include carbonate,bicarbonate, chloride, fluoride, sulfate, phosphate,nitrate, calcium, magnesium, sodium, and potassium, butany ion that is present will contribute to the total. Theorganic ions include pollutants, herbicides, and hydrocarbons.In addition, soil organic matter compounds such ashumic/fulvic acids are also included in TDS. There are avariety of ways to measure TDS. The simplest is to filterthe water sample, and then evaporate it at 180° C in apre-weighed dish until the weight of the dish no longerchanges. The increase in weight of the dish represents theTDS, and it is reported in mg/L. The TDS of a watersample can also be estimated fairly accurately from theelectrical conductivity of the sample via a linear correlationequation dependent upon specific conductivity.Finally, TDS can be calculated by measuring individualions and simply adding them together.Total dissolved solids is a non-specific, quantitative measureof the amount of dissolved inorganic chemicals butdoes not tell us anything about its nature. TDS is notconsidered a primary pollutant with any associated healtheffects in human drinking water standards, but it is ratherused as an indication of aesthetic characteristics of drinkingwater and as a broad indicator of an array of chemicalcontaminants.EssentialityAlthough many essential elements may contribute toTDS, the measurement technique does not, itself, differentiateessential from toxic elements.MetabolismSince TDS represents an undifferentiated collection ofjust about everything dissolved in a water sample, it isimpossible to speak of the “metabolism” of TDS.ToxicityInterestingly, early epidemiologic studies suggested that“moderately high” TDS concentrations (“high” in thiscontext being less than 1,000 mg/L) protected peopleagainst cancer and heart disease. 641-644 Although themechanism(s) underlying these early observations are notcompletely understood, it was first narrowed down to“hardness” as opposed to TDS. It now appears certainconstituents of TDS, notably Mg, interfere with the<strong>for</strong>mation of thrombi in arteriosclerosis. 641,645 Another hypothesis<strong>for</strong> the protective effect is that some componentsof hardness decrease leaching of toxic elements fromplumbing. 644 The inclusion of other cardiac risk factors,such as Na, in the total TDS of earlier studies probablyaccounts <strong>for</strong> the conflicting results in the older literature.Saline waters may adversely impact animal health byseveral possible mechanisms. One of the most importantbiological functions of water in mammals is as asolvent <strong>for</strong> nutrients, waste products, etc. The presenceof extraneous solutes decreases the ability of water toserve this function by decreasing its ability to dissolveadditional solutes. A similar, related factor is plasmaosmolarity. Solutes exert an attraction on water acrossmembranes, and inappropriate water movement is disastrousto cells and tissues. An extreme example of thiseffect is water intoxication that results in death, as wasthe case with a young woman in Cali<strong>for</strong>nia. 646 Mammalsexpend a considerable amount of energy maintainingthe osmolar concentration of various body compartmentswithin a fairly narrow range. The presence ofexcessive solutes in drinking water adds to this burdenand consumes resources that would otherwise be used<strong>for</strong> growth, milk production, or fighting off disease. It iswell-accepted that extreme drinking water TDS concentrationsin the 1.5%-3% range are incompatible withlife 546,551,557,586,647,648 ; however, the effects of lower TDSconcentrations are too multifactorial, involving species,age, sex, diet, pregnancy, lactation, environmental conditions,etc., to lend themselves to simple all-or-nothingresults. Also, the fact animals may “tolerate” (in otherwords, survive) a particular concentration is not the sameas proving they remained productive on it.49
Elevated TDS adversely affects the palatability of water.In humans, taste panels rated the palatability ofwater with 300 mg/L as “excellent,” 300-600 mg/L“good,” 600-900 mg/L “fair,” 900-1,200 mg/L “poor,”and greater than 1,200 mg/L “unusable.” Earlier criteria<strong>for</strong> human health were based upon this fact. 649 Inlivestock, decreased palatability is well-recognized asan important determinant of water consumption and,indirectly, feed consumption and per<strong>for</strong>mance. Cattlegiven water containing 6,000-15,000 mg/L TDS exhibiteddecreased water intake, feed intake, and average dailygain (ADG). 550,618,626,650-652 Five thousand mg/L decreasedfeed intake and gain of cattle on a high roughagediet. 653 Dairy cows given 2,040 mg/L water consumedless water and produced less milk when the peak ambienttemperature was 32.1 C than cows given desalinatedwater. 654 Similar decreases in milk production attributedto consuming saline water were seen in Arizona. 547,655Swine subsisting on water containing 10,000-15,000mg/L drank less, ate less, and per<strong>for</strong>med more poorlythan controls. 565 Sheep seem to be more tolerant of salinewaters than most domestic species and will drink themif introduced to the saline water over a period of severalweeks. 540,541,575-580,656,657 The two references regardingsaline waters in horses indicate they are reluctant to drinksuch water 551 , and it has been alluded they can be maintainedon water containing up to 9,500 mg/L TDS. 658Limited studies with farmed deer in Australia indicateTDS concentrations as high as 4,000-6,000 mg/L are toleratedwithout any reduction in feed or water consumption.659,660 We were unable to find any reports addressingthe effects of salinity on wild deer.Even when animals drink more in an attempt to compensate<strong>for</strong> poor water quality, the increased metabolicload imposed by high solute water may result in impairedper<strong>for</strong>mance. <strong>Water</strong> containing 1.5% NaCl (15,000ppm) and given to cattle <strong>for</strong> less than a week resulted in a13.7% reduction in weight, as well as decreasing feed andwater-intake, and marked hypernatremia. 550 In a similar,short-term experiment at cool temperatures, cattle given15,000 mg/L TDS water drank more, ate and grew less,and showed clinical signs of dehydration. 558 Five-thousandmg/L TDS <strong>for</strong> 51 days decreased gain in heifers. 651Total dissolved solids in drinking water serves as a verypoor predictor of animal health. As noted above, TDS isa measure of all inorganic and organic substances dissolvedin water. These individual solutes range in toxicityfrom relatively non-toxic substances, such as Ca 2+ , toextremely toxic (Hg 2+ , Se +4 ), but tests of TDS do notdifferentiate between them. Several early studies suggestno significant effects in sheep at TDS concentrations upto 13,000 mg/L or cattle and swine up to 5,000 mg/L,and the NRC 661 accepted larger concentrations as tolerable“<strong>for</strong> older ruminants and horses,” yet the authorshave seen animals poisoned by waters in which the TDSwas measured as slightly less than 500 mg/L, 415,662 andthere are reports of decreased productivity in dairy cattleat 2,000-2,500 mg/L. Early epidemiologic studies inpeople suggested high drinking water TDS decreased theincidence of cancer and heart disease in people. Later,however, studies narrowed the active component of TDSthat was negatively correlated with heart disease, first tohardness, then finally to the Mg 2+ ion concentration. Inhuman health, the World Health Organization droppedhealth-based recommendations <strong>for</strong> TDS in 1993, insteadretaining 1,000 mg/L as a secondary standard <strong>for</strong>“organoleptic purposes.” The test is just too non-specific tobe reliable. As noted by Chapman et al. 663 , in a study ofaquatic toxicity, “Toxicity related to these ions is due tothe specific combination and concentration of ions and isnot predictable from TDS concentrations.”We do not recommend relying upon TDS to evaluatewater quality <strong>for</strong> livestock and wildlife; however, if noother in<strong>for</strong>mation is available, TDS concentrationsless than 500 mg/L should ensure safety from almostall inorganic constituents. Above 500 mg/L, theindividual constituents contributing to TDS should beidentified, quantified, and evaluated.Summary50
12 SummaryElementShort (days – weeks)ExposureChronic (months)ExposureRationaleArsenic 1 mg/L 1 mg/L Does not seem to be a carcinogen in livestock;there<strong>for</strong>e, a concentration that protects againstcytotoxic effects should be safe (pg 8).Barium See text page 13 No recommendation Until there is better data we cannot make any firmrecommendation regarding Barium. See text <strong>for</strong>interim suggestions (pg 13).Fluoride 2 mg/L 2 mg/L Prevents dental lesions in most sensitive life stage.Fully mature animals may be able to tolerate more(pg 18).Molybdenum 0.3 mg/L 0.3 mg/L Prevents secondary Cu deficiency and poor per<strong>for</strong>mance(pg 24).Nitrate 500 mg/L 500 mg/L Prevents acute death and abortion in well-managedcattle. Dry diets high in NO 3may requirelower concentrations (pg 28).Nitrite 100 mg/L 100 mg/L Prevents acute death and abortion in well-managedcattle. Dry diets high in NO 3may requirelower concentrations (pg 28).pH No recommendation No recommendation There is considerable evidence that animals toleratea much wider range than the commonly cited6.5-8.5, but we could not find sufficient in<strong>for</strong>mationto make specific recommendations (pg 32).Selenium 0.1 mg/L 0.1 mg/L Prevents selenosis in equidae. Can probablytolerate slightly high concentrations <strong>for</strong> very shortperiods (pg 38).Sodium 4,000 mg/L 1,000 mg/L Assuming normal feedstuff Na concentrationand no other water sources, these concentrationsshould protect against acute lethality or chronically,poor per<strong>for</strong>mance (pg 43).Sulfate 1,800 mg/L 1,000 mg/L Assuming normal feedstuff S concentration, acutedeath may occur in ruminants at concentrationsgreater than 2,000, especially if not allowed time toacclimate. Long-term consumption result in poorper<strong>for</strong>mance (pg 47).TDS No recommendation No recommendation We do not recommend relying upon TDS toevaluate water quality <strong>for</strong> livestock and wildlife(pg 50).51
13 Research NeedspH – The original acceptable range often cited in variousextension and regulatory documents was designed toprotect plumbing rather than health. Research suggestsrodents and swine can not only tolerate but actuallythrive on significantly lower pH activities than currentstandards. There is some indirect evidence from the dairyindustry, where acidogenic diets have been used therapeutically,that cattle (and probably other ruminants) shouldper<strong>for</strong>m well on moderately acidic water <strong>for</strong> months ata time. There is nothing to indicate what, if any, limitsshould be <strong>for</strong> long‐term consumption. Nor is there anyexperimental evidence to indicate even the mild alkalinepH activity recommended under current guidelines, letalone stronger bases, are safe <strong>for</strong> animals. It might not bepossible to devise a simple guideline that fits all situationsas the acid‐base status of mammals is very multi‐factorial,but it should be possible to at least determine a range atwhich the direct, local effects of alkaline waters are likelyto cause refusal.Ba – The existing human guidelines are predicated uponthe theoretical potential <strong>for</strong> the Ba 2+ ion to exacerbatechronic cardiovascular problems. The existing knowledgebase regarding Ba toxicity in livestock and wildlife is exceedinglyscant and seemingly contradictory. If, as seemslikely, large ungulates respond similarly to Ba as humansand rodents, toxicity could potentially occur at similarwater concentrations. Large-scale, chronic experimentsof the sort required to conclusively establish a chronicNOAEL will be very expensive. It might be more costeffective to elucidate the comparative toxicodynamics(bioavailability from various sources, pharmacokinetics,pharmacodynamics) of Ba in major livestock and wildlifespecies vs. rodents with an eye to extrapolating the largehuman/rodent database to these species.<strong>Wildlife</strong> – There is a surprising deficit of quantitativetoxicologic data in big game wildlife species, especiallywhen one considers the resources that have been lavishedon fish and insects <strong>for</strong> the last three decades. Given thephysiological similarities to domestic livestock, it shouldnot be necessary to reinvent the complete knowledgebase. Relatively simple comparative studies of basic toxicologicparameters such as bioavailability between (e.g.)mule deer and domestic sheep would allow extrapolationfrom the existing knowledge base in livestock to wildlife.Nitrite – While there is substantial anecdotal evidenceNO 2is more toxic than NO 3, especially in non-ruminants,we didn’t find a great deal of quantitative doseresponsedata about oral exposure in livestock or wildlife.What we did find suggests a maximum tolerated doseconsiderably higher than the NRC. 2 The latter recommendedkeeping NO 2extra low to compensate <strong>for</strong> NO 2<strong>for</strong>mation in slurried feedstuffs to swine. This practice isno longer common, nor is the caveat appropriate to rangeconditions. A reliable maximum tolerated dose, appropriateto Western range conditions, is desirable.53
14 Bibliography1. National Research Council (2000). Vitamins and <strong>Water</strong>. pp. 80-82 in Nutrient Requirements of Beef Cattle.National Academy of Sciences, Washington, D.C.2. National Research Council (1972). <strong>Water</strong> <strong>for</strong> <strong>Livestock</strong> Enterprises. pp. 304-360 in <strong>Water</strong> <strong>Quality</strong> Criteria1972: A Report. National Academy of Sciences, Washington, D.C.3. National Research Council (2001). <strong>Water</strong>. pp. 178-183 in Nutrient Requirements of Dairy Cattle. NationalAcademy of Sciences, Washington, D.C.4. Fonnesbeck P.V. (1968). Consumption and excretion of water by horses receiving all hay and hay-grain diets.J Anim Sci 27:1350-1356.5. Murphy M.R., Davis C.L. and McCoy G.C. (1983). Factors affecting water consumption by Holstein cowsin early lactation. J Dairy Sci 66:35-38.6. Winchester C.F. and Morris M.J. (1956). <strong>Water</strong> intake rates of cattle. J Anim Sci 15:722-740.7. Cymbaluk N.F. (2002). <strong>Water</strong>: The overlooked nutrient. http://www1.agric.gov.ab.ca/$department/deptdocs.nsf/all/hrs3186, accessed 3/1/2007.8. National Oceanic and Atmospheric Administration (2007). Online weather data. http://www.ncdc.noaa.gov/oa/climate/regionalclimatecenters.html, accessed 5/25/2007.9. Eisler R. (2004). Arsenic hazards to humans, plants, and animals from gold mining. Rev Environ ContamToxicol 180:133-165.10. Hughes M.F. (2002). Arsenic toxicity and potential mechanisms of action. Toxicol Lett 133:1-16.11. Edwards W.C. and Gregory D.G. (1991). <strong>Livestock</strong> poisoning from oil field drilling fluids, muds andadditives. Vet Hum Toxicol 33:502-504.12. Heikens A., Panaullah G.M. and Meharg A.A. (2007). Arsenic behaviour from groundwater and soil tocrops: impacts on agriculture and food safety. Rev Environ Contam Toxicol 189:43-87.13. Edwards W.C. (1985). Oil field wastes create numerous hazards <strong>for</strong> livestock. Vet Med 4:98-104.14. Moxham J.W. and Coup M.R. (1968). Arsenic poisoning of cattle and other domestic animals. N Z Vet J16:161-165.15. Casteel S.W., Bailey E.M., Murphy M.J., Ray A.C. and Reagor J.C. (1986). Arsenic poisoning in Texas cattle:The implications <strong>for</strong> your practice. Vet Med 81:1045-1049.16. Wang S. and Mulligan C.N. (2006). Occurrence of arsenic contamination in Canada: Sources, behavior anddistribution. Sci Total Environ 366:701-721.55
17. Hindmarsh J.T. and McCurdy R.F. (1986). Clinical and environmental aspects of arsenic toxicity. Crit RevClin Lab Sci 23:315-347.18. Sasaki A., Oshima Y. and Fujimura A. (2007). An approach to elucidate potential mechanism of renaltoxicity of arsenic trioxide. Exp Hematol 35:252-262.19. Frost D.V. (1977). The arsenic problems. Adv Exp Med Biol 91:259-279.20. Hirano S. and Kobayashi Y. (2006). Cytotoxic effects of S-(dimethylarsino)-glutathione: A putativeintermediate metabolite of inorganic arsenicals. Toxicology 227:45-52.21. Gupta R., Dubey D.K., Kannan G.M. and Flora S.J.S. (2007). Concomitant administration of Moringaoleifera seed powder in the remediation of arsenic-induced oxidative stress in mouse. Cell Biol Int 31:44-56.22. Wang A., Holladay S.D., Wolf D.C., Ahmed S.A. and Robertson J.L. (2006). Reproductive anddevelopmental toxicity of arsenic in rodents: A review. Int J Toxicol 25:319-331.23. Snow E.T., Sykora P., Durham T.R. and Klein C.B. (2005). Arsenic, mode of action at biologically plausiblelow doses: What are the implications <strong>for</strong> low dose cancer risk? Toxicol Appl Pharmacol 207:S557-S564.24. Calabrese E.J. and Baldwin L.A. (2003). Inorganics and hormesis. Crit Rev Toxicol 33:215-304.25. National Research Council (2005). Arsenic. pp. 31-45 in Mineral Tolerance of Animals. NationalAcademies Press, Washington, D.C.26. Nielsen F.H., Givand S.H. and Myron D.R. (1975). Evidence of a possible requirement <strong>for</strong> arsenic by the rat.Fed Proc 34:923.27. Anke M. (1986). Arsenic. pp. 347-372 in Trace Elements in Human and Animal Nutrition (Mertz W., ed.).Academic Press, Orlando, FL.28. Jain C.K. and Ali I. (2000). Arsenic: Occurrence, toxicity and speciation techniques. <strong>Water</strong> Res34:4304-4312.29. Tseng C.H. (2007). Arsenic methylation, urinary arsenic metabolites and human diseases: Currentperspective. J Environ Sci Health 25:1-22.30. Upreti R.K., Kannan A. and Pant A.B. (2007). Experimental exposure of arsenic in cultured rat intestinalepithelial cells and cell line: Toxicological consequences. Toxicol In Vitro 21:32-40.31. Mitchell R.D., Ayala-Fierro F. and Carter D.E. (2000). Systemic indicators of inorganic arsenic toxicity infour animal species. J Toxicol Environ Health 59:119-134.32. Vahter M. and Concha G. (2001). Role of metabolism in arsenic toxicity. Pharmacol Toxicol 89:1-5.33. Vahter M. (1999). Methylation of inorganic arsenic in different mammalian species and population groups.Sci Prog 82:69-88.34. Rhian M. and Moxon A.L. (1943). Chronic selenium poisoning in dogs and its prevention by arsenic. JPharmacol Exp Ther 78:249-264.56
35. Klug H.L., Lampson G.P. and Moxon A.L. (1950). The distribution of selenium and arsenic in the bodytissues of rats fed selenium, arsenic, and selenium plus arsenic. Proc S Dak Acad Sci 29:57-65.36. Minyard J.A., Dinkel C.A. and Olson O.E. (1960). Effect of arsanilic acid in counteracting seleniumpoisoning in beef cattle. J Anim Sci 19:260-264.37. Hill C.H. (1975). Interrelationships of selenium with other trace elements. Fed Proc 34:2096-2100.38. Gregus Z., Gyurasics A. and Csanaky I. (2000). Effects of arsenic, platinum and gold-containing drugs onthe disposition of exogenous selenium in rats. Toxicol Sci 57:22-31.39. Modi M., Kaul R.K., Kannan G.M. and Flora S.J. (2006). Co-administration of zinc and n-acetylcysteineprevents arsenic-induced tissue oxidative stress in male rats. J Trace Elem Med Biol 20:197-204.40. Mukherjee S., Das D., Mukherjee M., Das A.S. and Mitra C. (2006). Synergistic effect of folic acid andvitamin B12 in ameliorating arsenic-induced oxidative damage in pancreatic tissue of rat. J Nutr Biochem17:319-327.41. Yokel R.A., Lasley S.M. and Dorman D.C. (2006). The speciation of metals in mammals influences theirtoxicokinetics and toxicodynamics and there<strong>for</strong>e human health risk assessment. J Toxicol Environ Health BCrit Rev 9:63-85.42. Franke K.W. and Moxon A.L. (1936). A comparison of the minimum fatal doses of selenium, tellurium,arsenic and vanadium. J Pharmacol Exp Ther 58:454-459.43. Hornfeldt C.S. and Borys D.J. (1986). Inorganic arsenic poisoning in cats. Feline Pract 16:20-24.44. Thomas D.J., Styblo M. and Lin S. (2001). The cellular metabolism and systemic toxicity of arsenic. ToxicolAppl Pharmacol 176:127-144.45. Bahri L.E. and Romdane S.B. (1991). Arsenic poisoning in livestock. Vet Hum Toxicol 33:259-264.46. Weaver A.D. (1962). Arsenic poisoning in cattle following pasture contamination by drift of spray. Vet Rec74:249-251.47. McLennan M.W. and Dodson M.E. (1972). Arsenic poisoning in cattle. Aust Vet J 48:367.48. Selby L.A., Case A.A., Dorn C.R. and Wagstaff D.J. (1974). Public health hazards associated with arsenicpoisoning in cattle. J Am Vet Med Assoc 165:1010-1014.49. Bergeland M.E., Ruth G.R., Stack R.L. and Emerick R.J. (1976). Arsenic toxicosis in cattle associated withsoil and water contamination from mining operations. Proc Am Assoc Vet Lab Diagn 19:311-316.50. Riviere J.E., Boosinger T.R. and Everson R.J. (1981). Inorganic arsenic toxicosis in cattle: A review of selectedcases. Mod Vet Pract 62:209-211.51. Morgan S.E., Morgan G.L. and Edwards W.C. (1984). Pinpointing the source of arsenic poisoning in a herdof cattle. Vet Med 79:1525-1528.57
52. Valentine B.A., Rumbeiha W.K., Hensley T.S. and Halse R.R. (2007). Arsenic and metaldehyde toxicosis in abeef herd. J Vet Diagn Invest 19:212-215.53. Kahrs R.F., Braun R.K., Edds G.T., Stoddard H.L. and Stoddard L.G. (1979). Fatal lead arsenate toxicosisresembling acute bovine diarrhea-mucosal disease (a case report). Proc Am Assoc Vet Lab Diagn 22:321-332.54. Bennett J. DG and Schwartz T.E. (1971). Cumulative toxicity of lead arsenate in phenothiazine given tosheep. Am J Vet Res 32:727-730.55. Pace L.W., Turnquist S.E., Casteel S.W., Johnson P.J. and Frankey R.L. (1997). Acute arsenic toxicosis in fivehorses. Vet Pathol 34:160-164.56. McParland P.J. and Thompson R.J. (1971). Deaths in cattle following ingestion of lead arsenate. Vet Rec89:450-451.57. Faires M.C. (2004). Inorganic arsenic toxicosis in a beef herd. Can Vet J 45:329-331.58. Robertson I.D., Harms W.E. and Ketterer P.J. (1984). Accidental arsenical toxicity of cattle. Aust Vet J61:366-367.59. Thatcher C.D., Meldrum J.B., Wikse S.E. and Whittier W.D. (1985). Arsenic toxicosis and suspectedchromium toxicosis in a herd of cattle. J Am Vet Med Assoc 187:179-182.60. Maitai C.K., Kamau J.A., Gacuhi D.M. and Njoroge S. (1975). An outbreak of arsenic and toxaphenepoisoning in Kenyan cattle. Vet Rec 96:151-152.61. Dickinson J.O. (1972). Toxicity of the arsenical herbicide monosodium acid methanarsonate in cattle. Am JVet Res 33:1889-1893.62. McCulloch E.C. and St. John J.L. (1940). Lead-arsenate poisoning of sheep and cattle. J Am Vet Med Assoc96:321-326.63. Nelson H.A., Crane M.R. and Tomson K. (1971). Inorganic arsenic poisoning in pastured feeder lambs. JAm Vet Med Assoc 158:1943-1945.64. Swiggart R.C., Whitehead C.J., Curley A. and Kellogg F.E. (1972). <strong>Wildlife</strong> kill resulting from the misuse ofarsenic acid herbicide. Bull Environ Contam Toxicol 8:122-128.65. Sutherland G.N., Fawell E.V. and Brown J.K. (1964). Arsenical poisoning of racehorses. Vet Rec76:275-278.66. Vantroyen B., Heilier J.F., Meulemans A., Michels A., Buchet J.P., Vandershueren S., Haufroid V. and SabbeM. (2004). Survival after a lethal dose of arsenic trioxide. J Toxicol Clin Toxicol 42:889-895.67. Furr A.A. and Buck W.B. (1974). Sodium arsenate toxicity in the domestic cat induced by a commercial antbait. Vet Hum Toxicol 16:41-42.68. Vorhies M.W., Sleight S.D. and Whitehair C.K. (1969). Toxicity of arsanilic acid in swine as influenced bywater intake. Cornell Vet 59:3-9.58
69. Harding J.D., Lewis G. and Done J.T. (1968). Experimental arsanilic acid poisoning in pigs. Vet Rec83:560-564.70. Oliver W.T. and Roe C.K. (1957). Arsanilic acid poisoning in swine. J Am Vet Med Assoc 130:177-178.71. Menges R.W., Kintner L.D., Selby L.A., Stewart R.W. and Marienfeld C.J. (1970). Arsanilic acid blindnessin pigs. Vet Med Small Anim Clin 65:565-568.72. Keenan D.M. and Oe R.D. (1973). Acute arsanilic acid intoxication in pigs. Aust Vet J 49:229-231.73. Ledet A.E., Duncan J.R., Buck W.B. and Ransey F.K. (1973). Clinical, toxicological and pathological aspectsof arsanilic acid poisoning in swine. Clin Toxicol 6:439-457.74. Witzel D.A., Smith E.L., Beerwinkle K.R. and Johnson J.H. (1976). Arsanilic acid-induced blindness inswine: Electroretinographic and visually evoked responses. Am J Vet Res 37:521-524.75. Shen J., Wanibuchi H., Waalkes M.P., Salim E.I., Kinoshita A., Yoshida K., Endo G. and Fukushima S.(2006). A comparative study of the sub-chronic toxic effects of three organic arsenical compounds on theurothelium in F344 rats; gender-based differences in response. Toxicol Appl Pharmacol 210:171-180.76. Irvine L., Boyer I.J. and DeSesso J.M. (2006). Monomethylarsonic acid and dimethylarsinic acid:Developmental toxicity studies with risk assessment. Birth Defects Res, Part B 77:53-68.77. Domingo J.L. (1994). Metal-induced developmental toxicity in mammals: A review. J Toxicol EnvironHealth 42:123-141.78. Peoples S.A. (1964). Arsenic toxicity in cattle. Ann NY Acad Sci 111:644-649.79. Neiger R.D. and Osweiler G.D. (1989). Effect of subacute low level dietary sodium arsenite on dogs. FundAppl Toxicol 13:439-451.80. Byron W.R., Bierbower G.W., Brouwer J.B. and Hansen W.H. (1967). Pathologic changes in rats and dogsfrom two year feeding of sodium arsenite and sodium arsenate. Toxicol Appl Pharmacol 10:132-147.81. Lancaster R.J., Coup M.R. and Hughes J.W. (1971). Toxicity of arsenic present in lakeweed. N Z Vet J19:141-145.82. Bucy L.L., Garrigus U.S., Forbes R.M., Norton H.W. and James M.F. (1954). Arsenical supplements in lambfattening rations. J Anim Sci 13:668-676.83. Bucy L.L., Garrigus U.S., Forbes R.M. and Norton H.W. (1955). Toxicity of some arsenicals fed to growingfatteninglambs. J Anim Sci 14:435-445.84. Kocar B.D., Garrot R.A. and Inskeep W.P. (2004). Elk exposure to arsenic in geothermal watersheds ofYellowstone National Park. Environ Toxicol Chem 23:982-989.85. Forsberg C.W. (1978). Some effects of arsenic on the rumen microflora; an in vitro study. Can J Microbiol24:36-44.59
86. Roth T.R. and Reddy K.J. (2007). Arsenic in the environment and its remediation by a novel filtrationmethod. in: Bundschuh et al., Natural Arsenic in Groundwaters of Latin America, As-2006, in press.87. Langner H.W., Jackson C.R., McDermott T.R. and Inskeep W.P. (2001). Rapid oxidation of arsenite in ahotspring ecosystem, Yellowstone National Park. Environ Sci Technol 35:3302-3309.88. National Research Council (1980). Arsenic. pp. 40-53 in Mineral Tolerance of Domestic Animals. NationalAcademies Press, Washington, D.C.89. University of Minnesota <strong>Water</strong> Resources Center (2007). Assessing the impact of arsenic on upper midwesterndairy operations. http://wrc.umn.edu/outreach/arsenicstudy/index.html, last updated 3/5/2007, accessed5/28/2007.90. Murphy M.J. (2007). Personal communication. Professor of Veterinary Toxicology, University of Minnesota.91. el Bahri L. and Ben Romdane S. (1991). Arsenic poisoning in livestock. Vet Hum Toxicol 33:259-264.92. Monies B. (1999). Arsenic poisoning in cattle. In Pract 21:602-607.93. Garner R.J. (1967). Mineral or inorganic substances. pp. 44-59 in Veterinary Toxicology (Clarke E.G. andClarke M.L., eds.). Bailliere, Tindal & Cassell, London.94. Selby L.A., Case A.A., Osweiler G.D. and Hayes J. HM (1977). Epidemiology and toxicology of arsenicpoisoning in domestic animals. Environ Health Perspect 19:183-189.95. Stumm W. and Morgan J.J. (1996). Aquatic Chemistry; Chemical Equilibria and Rates in Natural <strong>Water</strong>s,3rd ed. John Wiley & Sons Inc., New York, NY.96. Ng A. and Patterson C.C. (1982). Changes of lead and barium with time in Cali<strong>for</strong>nia off-shore basinsediments. Geochim Cosmochim Acta 46:2307-2321.97. Chernick W.S. (1971). Drill’s Pharmacology in Medicine, 4th ed. McGraw-Hill, New York, NY.98. Reeves A.L. (1986). Barium. pp. 84-94 in Handbook on the Toxicology of Metals (Friberg L., NordbergG.F. and Vouk V.B., eds.). Elsevier Science Publishers B.V., Amsterdam.99. Tipton I.H., Steward P.L. and Dickson J. (1969). Patterns of elemental excretion in long term balancestudies. Health Phys 16:455-462.100. Cuddihy R.G. and Griffith W.C. (1972). A biological model describing tissue distribution and whole-bodyretention of barium and lanthanum in beagle dogs after inhalation and gavage. Health Phys 23:621-633.101. Leggett R.W. (1992). Fractional absorption of ingested barium in adult humans. Health Phys 62:556-561.102. Garner R.J., Jones H.G. and Sansom B.F. (1960). Fission products and the dairy cow. Biochem J76:572-579.103. Sansom B.F. and Garner R.J. (1966). The metabolism of radium in dairy cows. Biochem J 99:677-681.60
104. Choudhury H. and Cary R. (2001). Barium and barium compounds. pp. 1-57 in Concise InternationalChemical Assessment. World Health Organization, Geneva, Switzerland.105. Stevens Y., Moffett D., Ingerman L. and Swarts S. (2005). Draft toxicological profile <strong>for</strong> barium and bariumcompounds. ATSDR: Agency <strong>for</strong> Toxic Substances and Disease Registry: Internet Source; Accessed 1/20/07;pp 1-77.106. National Research Council (2005). Barium. pp. 46-53 in Mineral Tolerance of Animals. NationalAcademies Press, Washington, D.C.107. Newton D., Ancill A.K., Naylor K.E. and Eastell R. (2001). Long term retention of injected barium-133 inman. Radiat Prot Dosimetry 97:231-240.108. Shanbaky I.O., Borowitz J.L. and Kessler W.V. (1978). Mechanisms of cadmium- and barium-inducedadrenal catecholamine release. Toxicol Appl Pharmacol 44:99-105.109. Smith R.P. and Gosselin R.E. (1976). Current concept about the treatment of selected poisons: Nitrite,cyanide, sulfide, barium, and quinidine. Annu Rev Pharmacol Toxicol 16:189-199.110. Gosselin R.E., Smith R.P., Hodge H.C. and Braddock J. (1984). Clinical Toxicology of CommercialProducts, 5th ed. Williams and Wilkins, Baltimore/London.111. Kojola W.H., Brenniman G.R., Carnow B. and Carnow B.W. (1979). A review of environmentalcharacteristics and health effects of barium in public water supplies. Rev Environ Health 3:79-95.112. Roza O. and Berman L.B. (1971). The pathophysiology of barium: Hypokalemic and cardiovascular effects.J Pharmacol Exp Ther 177:433-439.113. National Research Council (1980). Barium. pp. 54-59 in Mineral Tolerance of Domestic Animals. NationalAcademies Press, Washington, D.C.114. Johnson C.H. and VanTassell V.J. (1991). Acute barium poisoning with respiratory failure andrhabdomyolysis. Ann Emerg Med 20:1138-1142.115. Ram L., Schonewille J.T., van’t Klooster A.T. and Beynen A.C. (1999). Lethal effect of intraruminal bariumchloride administration in goats. N Z Vet J 47:150.116. Richards T., Erickson D.L., Talcott P.A. and Bazler T.V. (2006). Two cases of barium poisoning in cattle.Proc Am Assoc Vet Lab Diagn 49:155.117. Reagor J. (2005). Personal communication. Toxicologist, Texas Veterinary Medical Diagnostics Laboratory.118. Malhi C.S., Parshad V.R. and Ahmad N. (1993). Determination of potential of barium carbonate <strong>for</strong> thecontrol of house rat (Rattus rattus). Z angewandte Zool 80:42-49.119. Mattila M.J., Anyos K. and Puisto E.-L. (1986). Cardiotoxic actions of doxepin and barium chloride inconscious rabbits. Arch Toxicol 9:205-208.120. Wetherill S.F., Guarino M.J. and Cox R.W. (1981). Acute renal failure associated with barium chloridepoisoning. Ann Intern Med 95:187-188.61
121. Gould D.B., Sorrell M.R. and Lupariello A.D. (1973). Barium sulfide poisoning: Some factors contributingto survival. Arch Intern Med 132:891-894.122. Wones R.G., Stadler B.L. and Frohman L.A. (1990). Lack of effect of drinking water barium oncardiovascular risk factors. Environ Health Perspect 35:355-359.123. Brenniman G.R. and Levy P.S. (1984). Epidemiological study of barium in Illinois drinking water supplies.pp. 231-249 in Advances in Modern Toxicology (Calabrese E.J., ed.). Princeton Scientific, Princeton, NJ.124. Borzelleca J.F., Condie L.W. and Egle J.L. (1988). Short-term toxicity (one- and ten-day gavage) of bariumchloride in male and female rats. J Am Coll Toxicol 7:675-685.125. Schroeder H.A. and Mitchener M. (1974). Life-term studies in rats: Effects of aluminum, barium, beryllium,and tungsten. J Nutr 105:421-427.126. Kopp S.J., Perry J. HM, Feliksik J.M., Erlanger M. and Perry E.F. (1985). Cardiovascular dysfunctionand hypersensitivity to sodium pentobarbital induced by chronic barium chloride ingestion. Toxicol ApplPharmacol 77:303-314.127. Perry J. HM, Kopp S.J., Erlanger M.W. and Perry E.F. (1983). Cardiovascular effects of chronic bariumingestion. Trace Substances in Environmental Health; Proceedings of the University of Missouri’s AnnualConference on Trace Substances in Environmental Health 17:155-164.128. Perry H.M., Kopp S.J., Perry E.F. and Erlanger M.W. (1989). Hypertention and associated cardiovascularabnormalities induced by chronic barium feeding. J Toxicol Environ Health 28:373-388.129. Dietz D.D., Elwell M.R., Davis J. WE and Meirhenry E.F. (1992). Subchronic toxicity of barium chloridedihydrate administered to rats and mice in the drinking water. Fund Appl Toxicol 19:527-537.130. Tardiff R.G., Robinson M. and Ulmer N.S. (1980). Subchronic oral toxicity of BaCl2 in rats. J EnvironPathol Toxicol 4:267-275.131. McCauley P.T., Douglas B.H., Laurie R.D. and Bull R.J. (1985). Investigations into the effect of drinkingwater barium on rats. pp. 197-211 in Inorganics in Drinking <strong>Water</strong> and Cardiovascular Disease (Advances inModern Environmental Toxicology) (Condie L., ed.). Princeton Scientific Pub., Princeton, NJ.132. National Toxicology Program (1994). Toxicology and carcinogenesis studies of barium chloride dihydrate inF344/N rats and B6C3F 1mice: Technical report series 432. U.S. Department of Heath and Human Services,Technical Report Series No. 432.133. Barium sulfate: Risk assessment document: EH72/9 (1994). UK Health and Safety Executive, pp 1-46.134. Maglinte D.D.T., Strate R.W., Strong R.C., Chernish S.M., Miller R.E., Caudill L.D., Graffis R.F. and DyerP.A. (1983). The effect of barium enemas and barium sulfate on healing of colorectal biopsy sites. Dis ColonRectum 26:595-597.135. Freeney D.A., Johnston G.R., Tomlinson M.J. and Osborne C.A. (1983). Effects of sterilizatedmicropulverized barium sulfate suspension and meglumine iothalamate solution on the genitourinary tract ofhealthy male dogs after retrograde urethrocystography. Am J Vet Res 45:730-738.62
136. Boyd E.M. and Abel M. (1966). The acute toxicity of barium sulfate administered intragastrically. Can MedAssoc J 94:849-853.137. Kabitz R. (1907). The action of barium salts on the pig. Vet J 63:254-255.138. Hope B., Loy C. and Miller P. (1996). Uptake and trophic transfer of barium in a terrestrial ecosystem. BullEnviron Contam Toxicol 56:683-689.139. McCauley P.T. and Washington I.S. (1983). Barium bioavailability as the chloride, sulfate, or carbonate saltin the rat. Drug Chem Toxicol 6:209-217.140. Brown J.R., Mastromatteo E. and Horwood J. (1963). Zirconium lactate and barium zirconate: Acutetoxicity and inhalation effects in experimental animals. Am Ind Hyg Assoc J 24:131-136.141. Hicks R., Caldas L.Q.de A., Dare P.R.M. and Hewitt P.J. (1986). Cardiotoxic and bronchoconstrictor effectsof industrial metal fumes containing barium. Arch Toxicol 9:416-420.142. Tarasenko N.Y., Shabalina L.P. and Spiridonova V.S. (1976). Comparative toxicity of metal stearates. IntArch Occup Environ Health 37:179-192.143. Zschiesche W., Schaller K.H. and Weltle D. (1992). Exposure to soluble barium compounds: Aninterventional study in arc welders. Int Arch Occup Environ Health 64:13-23.144. Hardy E., Rivera J., Fisenne I., Pond W. and Hogue D. (1969). Comparative utilization of dietaryradium-226 and other alkaline earths by pigs and sheep. Proceedings of the Annual Han<strong>for</strong>d BiologySymposium, Richland, WA, May 5-8 9th:184-190.145. Tarasenko N.Y., Pronin O.A. and Silasev A.A. (1977). Barium compounds as industrial poisons (anexperimental study). J Hyg Epidemiol Microbiol Immunol 21:361-373.146. Kubota J., Naphan E.A. and Oberly G.H. (1982). Fluoride in thermal spring water and in plants of Nevadaand its relationship to fluorosis in animals. J Range Manage 35:188-192.147. National Research Council (2005). Fluorine. pp. 154-181 in Mineral Tolerance of Animals. NationalAcademies Press, Washington, D.C.148. Ammerman C.B. (1980). Introductory remarks <strong>for</strong> the symposium on fluoride toxicosis in cattle. J Anim Sci51:744-745.149. Shupe J.L. and Alther E.W. (1966). The effects of fluorides on livestock, with particular reference to cattle.pp. 307-354 in Handbook of Experimental Pharmacology (Eichler O., Farah A., Herken H. and Welch A.D.,eds.). Springe-Verlag, Berlin-Heidelberg-New York.150. Cerklewski F.L. (1997). Fluoride bioavailability. Nutr Res 17:907-927.151. Davis R.K. (1961). Fluorides: A critical review. V. Fluoride intoxication in laboratory animals. J Occup Med3:593-601.152. Carlson C.H., Armstrong W.D. and Singer L. (1960). Distribution, migration and binding of whole bloodfluoride evaluated with radiofluoride. Am J Physiol 199:187-189.63
153. Whit<strong>for</strong>d G.M. (1994). Intake and metabolism of flouride. Adv Dent Res 8:5-14.154. Suttie J.W. (1980). Nutritional aspects of fluoride toxicosis. J Anim Sci 51:759-766.155. Slagsvold L. (1934). Fluoride poisoning in animals. Vet Med 30:375.156. Reed O.E. and Huffman C.F. (1930). The results of a five year mineral feeding investigation with dairy cattle.Michigan State College Agricultural Experiment Station Bulletin 105:1-63.157. Agency <strong>for</strong> Toxic Substances and Disease Registry (2003). Toxicological Profile <strong>for</strong> Fluorides, HydrogenFluoride, and Fluorine, U.S. Department of Heath and Human Services, Atlanta, GA.158. Boink A.B., Wemer J., Meulenbelt J., Vaessen H.A. and de Wildt D.J. (1994). The mechanism of fluorideinducedhypocalcacemia. Hum Exp Toxicol 13:149-155.159. Guan Z., Xiao K., Zeng X., Long Y., Cheng Y., Jiang S. and Wang Y. (2000). Changed cellular membranelipid composition and lipid peroxidation of kidney in rats with chronic fluorosis. Mol Toxicol 74:602-608.160. Kessabi M., Hamliri A., Braun J.P. and Rico A.G. (1985). Experimental acute sodium fluoride poisoning insheep: Renal, hepatic, and metabolic effects. Fund Appl Toxicol 5:1025-1033.161. Pillai K.S., Mathai A.T. and Deshmuhk P.B. (1989). Effect of fluoride on reproduction in mice. Fluoride22:165-168.162. Susheela S. and Kumar A. (1991). A study of the effect of high concentrations of fluoride on the reproductiveorgans of male rabbits, using light and scanning electron microscopy. J Reprod Fertil 92:353-360.163. Chinoy N.J., Pradeep P.K. and Sequeira E. (1992). Effect of fluoride ingestion on the physiology ofreproductive organs of male rat. J Environ Biol 13:55-61.164. Choubisa S.L. (1999). Some observations on endemic fluorosis in domestic animals in southern Rajasthan(India). Vet Res Commun 23:457-465.165. Cass J.S. (1961). Fluorides: A critical review. IV. Response of livestock and poultry to absorption of inorganicfluorides. J Occup Med 3:471-477.166. Clarke E.G.C. (1973). Clinical toxicology XII. Poisoning in domestic animals. Practitioner 211:818-822.167. Peirce A.W. (1939). Chronic fluorine intoxication in domestic animals. Nutr Abstr Rev 9:253-261.168. Bawden J.W., Crenshaw M.A., Wright J.T. and LeGeros R.Z. (1995). Consideration of possible biologicmechanisms of fluorosis. J Dent Res 74:1349-1352.169. Kierdorf U. and Kierdorf H. (1999). Dental fluorosis in wild deer: Its use as a biomarker of increased fluorideexposure. Environ Monit Assess 57:265-275.170. Suttie J.W. (1983). The influence of nutrition and other factors on fluoride tolerance. pp. 291-302 inFluorides: Effects on Vegetation, Animals, and Humans (Shupe J.L., Peterson H.B. and Leone N.C., eds.).Paragon Press, Salt Lake City, Utah.64
171. Mullenix P.J., Denbesten P.K., Schunior A. and Kernan W.J. (1995). Neurotoxicity of sodium fluoride in rats.Neurotoxicology 17:169-177.172. Shan K., Qi X., Long Y., Nordberg A. and Guan Z. (2004). Decreased nicotinic receptors in PC12 cells andrat brains influenced by fluoride toxicity- A mechanism relating to a damage at the level in post-transcriptionof the receptor genes. Toxicology 200:169-177.173. Paul V., Ekambaram P. and Jayakumar A.R. (1998). Effects of sodium fluoride on locomotor behavior and afew biochemical parameters in rats. Environ Toxicol Pharmacol 6:187-191.174. Wang Y., Xiao K., Liu J., Dallner G. and Guan Z. (2000). Effect of long term exposure on lipid compositionin rat liver. Toxicology 146:161-169.175. Ekambaram P. and Paul V. (2002). Modulation of fluoride toxicity in rats by calcium carbonate and bywithdrawal of fluoride exposure. Pharmacol Toxicol 90:53-58.176. Grucka-Mamczar E., Machoy Z., Tarnawski R., Birkner E. and Mamczar A. (1997). Influence of longtermsodium fluoride administration on selected parameters of rat blood serum and liver function. Fluoride30:157-164.177. Heindel J.J., Bates H.K., Price C.J., Marr M.C., Myers C.B. and Schwetz B.A. (1996). Developmentaltoxicity evaluation of sodium fluoride administered to rats and rabbits in drinking water. Fund Appl Toxicol30:162-177.178. Varner J.A., Jensen K.F., Horvath W. and Isaacson R.L. (1998). Chronic administration of aluminumfluorideor sodium-fluoride to rats in drinking water: Alterations in neuronal and cerebrovascular integrity.Brain Res 784:284-298.179. Ahn H., Fulton B., Moxon D. and Jeffery E.H. (1995). Interactive effects of fluoride and aluminum uptakeand accumulation in bones of rabbits administered both agents in their drinking water. J Toxicol EnvironHealth 44:337-350.180. Kessabi M., Hamliri A. and Braun J.P. (1986). Experimental fluorosis in sheep: Alleviating effects ofaluminum. Vet Hum Toxicol 28:300-304.181. National Toxicology Program (1990). TR-393: Toxicology and carcinogenesis studies of sodium fluoride(CAS No. 7681-49-4) in F344/N rats and B6C3F1 mice (drinking water studies). Department of Health andHuman Services, National Toxicology Program.182. Newman J.R. and Markey D. (1976). Effects of elevated levels of fluoride on deer mice (Peromyscusmaniculatus). Fluoride 9:47-53.183. Boulton I.C., Cooke J.A. and Johnson M.S. (1995). Fluoride accumulation and toxicity in laboratorypopulations of wild small mammals and white mice. J Appl Toxicol 15:423-431.184. Patra R.C., Dwivedi S.K., Bhardwaj B. and Swarup D. (2000). Industrial fluorosis in cattle and buffaloaround Udaipur, India. Sci Total Environ 253:145-150.185. Lopez T.A., Busetti M.R., Fort M.C. and Bedotti D.O. (1994). Fluoride-induced early teeth wearing inArgentinian cattle. Biomed Environ Sci 7:205-215.65
186. Neeley K.L. and Harbaugh F.G. (1954). Effects of fluoride ingestion on a herd of dairy cattle in the Lubbock,Texas area. J Am Vet Med Assoc 124:344-350.187. Rand W.E. and Schmidt H.J. (1952). The effect upon cattle of Arizona waters of high fluoride content. Am JVet Res 13:50-61.188. Araya O., Wittwer F. and Villa A. (1993). Evolution of fluoride concentrations in cattle and grass following avolcanic eruption. Vet Hum Toxicol 35:437-440.189. Schultheiss W.A. and Godley G.A. (1995). Chronic fluorosis in cattle due to the ingestion of a commerciallick. J S Afr Vet Assoc 66:83-84.190. Merriman G.M. and Hobbs C.S. (1962). Bovine fluorosis from soil and water sources. Tenn Agr Exper StaBull 347:1-47.191. Suttie J.W., Carlson J.R. and Faltin E.C. (1972). Effects of alternating periods of high- and low- fluorideingestion on dairy cattle. J Dairy Sci 55:790-804.192. Hobbs C.S. and Merriman G.M. (1962). Fluorosis in beef cattle. Tenn Agr Exper Sta Bull 351:1-181.193. Ammerman C.B., Arrington L.R., Shirley R.L. and Davis G.K. (1964). Comparative effects of fluorine fromsoft phosphate, calcium fluoride, and sodium fluoride on steers. J Anim Sci 23:409-413.194. Shupe J.L., Christofferson P.V., Olson A.E., Allred E.S. and Hurst R.L. (1987). Relationship of cheek toothabrasion to fluoride-induced permanent incisor lesions in livestock. Am J Vet Res 48:1498-1503.195. Suttie J.W. and Faltin E.C. (1971). Effect of a short period of fluoride ingestion on dental fluorosis in cattle.Am J Vet Res 32:217-222.196. Eckerlin H.R., Maylin G.A. and Krook L. (1986). Milk production of cows fed fluoride contaminatedcommercial feed. Cornell Vet 76:403-414.197. Maylin G.A., Eckerlin R.H. and Krook L. (1987). Fluoride intoxication in dairy calves. Cornell Vet77:84-98.198. Harris L.E., Raleigh R.J., Stoddard G.E., Greenwood D.A., Shupe J.L. and Nielsen H.M. (1964). Effects offluorine on dairy cattle. III. Digestion and metabolism trials. J Anim Sci 23:537-546.199. McLaren J.B. and Merriman G.M. (1975). Effects of fluorine on productivity and longevity in beef cows.Tenn Agr Exper Sta Bull 549:1-60.200. Shupe J.L., Miner M.L., Harris L.E. and Greenwood D.A. (1962). Relative effects of feeding hayatmospherically contaminated by fluoride residue, normal hay plus calcium fluoride, and normal hay plussodium fluoride to dairy heifers. Am J Vet Res 23:777-787.201. van Rensburg S.W. and de Vos W.H. (1966). The influence of excess fluorine intake in the drinking water onreproductive efficiency in bovines. Onderstepoort J Vet Res 33:185-194.202. Harvey J.M. (1952). Chronic endemic fluorosis of Merino sheep in Queensland. The Queensland Journal ofAgricultural Science 9:47-138.66
203. Schultheiss W.A. and Van Niekerk J.C. (1994). Suspected chronic fluorosis in a sheep flock. J S Afr VetAssoc 65:84-85.204. Botha C.J., Naude T.W., Minnaar P.P., Van Amstel S.R. and Janse van Rensburg S.D. (1993). Two outbreaksof fluorosis in cattle and sheep. J S Afr Vet Assoc 64:165-168.205. Hibbs C.M. and Thilsted J.P. (1983). Toxicosis in cattle from contaminated well water. Vet Hum Toxicol25:253-254.206. Shupe J.L. and Olson A.E. (1971). Clinical aspects of fluorosis in horses. J Am Vet Med Assoc 158:167-174.207. Comar C.L., Visek W.J., Lotz W.E. and Rust J.H. (1953). Effects of fluorine on calcium metabolism andbone growth in pigs. Am J Anat 92:361-389.208. Shupe J.L., Olson A.E., Peterson H.B. and Low J.B. (1984). Fluoride toxicosis in wild ungulates. J Am VetMed Assoc 185:1295-1300.209. Suttie J.W., Dickie R., Clay A.B., Nielsen P., Mahan W.E., Baumann D.P. and Hamilton R.J. (1987). Effectsof fluoride emissions from a modern primary aluminum smelter on a local population of white-tailed deer(Odocoileus virginianus). J Wildl Dis 23:135-143.210. Newman J.R. and Yu M.H. (1976). Fluorosis in black-tailed deer. J Wildl Dis 12:39-41.211. Suttie J.W., Hamilton R.J., Clay A.C., Tobin M.L. and Moore W.G. (1985). Effects of fluoride ingestion onwhite-tailed deer (Odocoileus virginianus). J Wildl Dis 21:283-288.212. Vikoren T., Stuve G. and Froslie A. (1996). Fluoride exposure in cervids inhabiting areas adjacent toaluminum smelters in Norway. I. Residue levels. J Wildl Dis 32:169-180.213. Adriano D.C. (1980). Other trace elements. pp. 479-483 in Trace Elements in the Terrestrial Environment(Adriano D.C., ed.). Springer Verlag, New York, NY.214. National Research Council (2005). Molybdenum. pp. 262-270 in Mineral Tolerance of Animals. NationalAcademies Press, Washington, D.C.215. Thomson I., Thornton I. and Webb J.S. (1972). Molybdenum in black shales and the incidence of bovinehypocuprosis. J Sci Food Agric 23:879-891.216. Erdman J.A., Ebens R.J. and Case A.A. (1978). Molybdenosis: A potential problem in ruminants grazing oncoal mine spoils. J Range Manage 31:34-36.217. Gardner W.C., Broersma K., Popp J.D., Mir Z., Mir P.S. and Buckley W.T. (2003). Copper and health statusof cattle grazing high-molybdenum <strong>for</strong>age from a reclaimed mine tailing site. Can J Anim Sci 83:479-485.218. Alary J., Bourbon P., Esclassan J., Lepert J.C., Vandaele J., LeCuire J.M. and Klein F. (1981). Environmentalmolybdenum levels in industrial molybdenosis of grazing cattle. Sci Total Environ 19:111-119.219. Buxton J.C. and Allcroft R. (1955). Industrial molybdenosis of grazing cattle. Vet Rec 67:273-276.67
220. Parker W.M. and Rose T.H. (1955). Molybdenum poisoning (Teart) due to aerial contamination of pastures.Vet Rec 67:276-279.221. Gardner A.W. and Hall-Patch P.K. (1962). An outbreak of industrial molybdenosis. Vet Rec 74:113-116.222. Barceloux D.G. (1999). Molybdenum. Clin Toxicol 37:231-237.223. Reddy K.J., Munn L.C. and Wang L. (1997). Chemistry and mineralogy of molybdenum in soils. pp. 6-9 inMolybdenum in Agriculture (Gupta U.C., ed.). Cambridge University Press, New York, NY.224. Ward G.M. (1991). Acceptable limits of molybdenum <strong>for</strong> ruminants exist. Feedstuffs Jan 14:15-22.225. Pitt M., Fraser J. and Thurley D.C. (1980). Molybdenum toxicity in sheep: Epiphysiolysis, exotoses andbiochemical changes. J Comp Pathol 90:567-576.226. Kubota J. (1975). Areas of molybdenum toxicity to grazing animals in the Western States. J Range Manage28:252-256.227. Ward G.M. (1994). Molybdenum requirements, toxicity, and nutritional limits <strong>for</strong> man and animals. pp.452-476 in Molybdenum: An Outline of Its Chemistry and Uses (Braithwaite E.R. and Haber J., eds.).Elsevier, Amsterdam.228. Anke M., Grun M., Partschefeld M. and Groppel B. (1978). Molybdenum deficiency in ruminants. pp.230-233 in Proceedings of the Third International Symposium on Trace Element Metabolism in Man andAnimals (Kirchgessner M., ed.). Arbeitskreis fur Tierernahrungs<strong>for</strong>schung, Weihenstephan, Germany.229. Anke M., Groppel B. and Grun M. (1985). Essentiality, toxicity, requirement and supply of molybdenum inhuman and animals. pp. 154-157 in Trace Elements in Man and Animals - TEMA 5 (Mills C.F., Bremner I.and Chesters J.K., eds.). Commonwealth Agricultural Bureaux, Slough, UK.230. Mason J. (1978). The relationship between copper, molybdenum and sulphur in ruminant and nonruminantanimals: A preview. Vet Sci Commun 2:85-94.231. Van Reen R. and Williams M.A. (1956). Studies on the influence of sulfur compounds on molybdenumtoxicity in rats. Arch Biochem Biophys 63:1-8.232. Gray L.F. and Daniel L.J. (1954). Some effects of excess molybdenum on the nutrition of the rat. J Nutr53:43-51.233. Mills C.F., Monty K.J., Ichihara A. and Pearson P.B. (1958). Metabolic effects of molybdenum toxicity in therat. J Nutr 65:129-142.234. Dale J.E., Ewan R.C., Speer V.C. and Zimmerman D.R. (1973). Copper, molybdenum and sulfateinteraction in young swine. J Anim Sci 37:913-917.235. Scaife J.F. (1956). Molybdenum excretion and retention in the sheep. N Z J Sci Technol 38a:293-298.236. Bell M.C., Diggs B.G., Lowrey R.S. and Wright P.L. (1964). Comparison of Mo-99 metabolism in swine andcattle as affected by stable molybdenum. J Nutr 84:367-372.68
237. Tolgyesi G. and Elmoty I.A. (1967). Elimination of excess molybdenum by cattle. Acta Vet Acad Sci Hung17:39-44.238. Hogan K.G. and Hutchinson A.J. (1965). Molybdenum and sulphate in the diet and the effect on themolybdenum content of the milk of grazing sheep. N Z J Agric Res 8:625-629.239. Suttle N.F. (1974). Recent studies of the copper-molybdenum antagonism. Proc Nutr Soc 33:299-305.240. Norheim G., Soli N.E., Froslie A. and Mjor-Grimsrad M. (1980). Fractionation of soluble molybdenumbindingproteins from liver, kidney, plasma and erythrocytes from sheep supplemented with molybdenum.Acta Vet Scand 21:428-437.241. Suttle N.F. (1991). The interactions between copper, molybdenum, and sulphur in ruminant nutrition.Annu Rev Nutr 11:121-140.242. Spears J.W. (2003). Trace mineral bioavailability in ruminants. J Nutr 133:1506S-1509S.243. Ivan M. and Veira D.M. (1985). Effects of copper sulfate supplement on growth, tissue concentration, andruminal solubilities of molybdenum and copper in sheep fed low and high molybdenum diets. J Dairy Sci68:891-896.244. Allen J.D. and Gawthorne J.M. (1987). Involvement of the solid phase of rumen digesta in the interactionbetween copper, molybdenum and sulphur in sheep. Br J Nutr 58:265-276.245. Gooneratne S.R., Buckley W.T. and Christensen D.A. (1989). Review of copper deficiency and metabolismin ruminants. Can J Anim Sci 69:819-845.246. Hynes M., Woods M., Poole D., Rogers P. and Mason J. (1985). Somes studies on the metabolism of labeledmolybdenum compounds in cattle. J Inorg Biochem 24:279-288.247. Mason J. (1982). The putative role of thiomolybdates in the pathogenesis of Mo-induced hypocupraemia andmolybdenosis: Some recent developments. Irish Vet J 36:164-168.248. Mason J., Woods M. and Poole D.B.R. (1986). Accumulation of copper on albumin in bovine plasma in vivoafter intravenous trithiomolybdate administration. Res Vet Sci 41:108-113.249. Hynes M., Lamand M., Montel G. and Mason J. (1984). Some studies on the metabolism and the effects of99-Mo and 35-S labelled thiomolybdates after intravenous infusion in sheep. Br J Nutr 52:149-158.250. Gengelbach G.P., Ward J.D., Spears J.W. and Brown J. TT (1997). Effects of copper deficiency and copperdeficiency coupled with high dietary iron or molybdenum on phagocytic cell function and response of calvesto a respiratory disease challenge. J Anim Sci 75:1112-1118.251. Mason J., Lamand M. and Kelleher C.A. (1980). The fate of 99-Mo-labelled sodium tetrathiomolybdate afterduodenal administration in sheep: The effect on caeruloplasmin (EC 1.16.3.1) diamine oxidase activity andplasma copper. Br J Nutr 43:515-523.252. Dowdy R.P. and Matrone G. (1968). A copper-molybdenum complex: Its effects and movement in the pigletand sheep. J Nutr 95:197-201.69
253. Auza N., Braun J.P., Benard P., Thouvenot J.P. and Rico A.G. (1989). Hematological and plasma biochemicaldisturbances in experimental molybdenum toxicosis in sheep. Vet Hum Toxicol 31:535-537.254. Arthington J.D., Corah L.R. and Blecha F. (1996). The effect of molybdenum-induced copper deficiencyon acute-phase protein concentrations, superoxide dismutase activity, leukocyte numbers and lymphocyteproliferation in beef heifers inoculated with bovine herpesvirus-1. J Anim Sci 74:211-217.255. Boyne R. and Arthur J.R. (1986). Effects of molybdenum or iron induced copper deficiency on the viabilityand function of neutrophils from cattle. Res Vet Sci 41:417-419.256. Cerone S., Sansinanea A., Streitenberger S., Garcia C. and Auza N. (1998). Bovine neutrophil functionalityin molybdenum-induced copper deficiency. Nutr Res 18:557-566.257. Lannon B. and Mason J. (1986). The inhibition of bovine ceruloplasmin oxidase activity by thiomolybdatesin vivo and in vitro: A reversible reaction. J Inorg Biochem 26:107-115.258. Woods and Mason J. (1987). Spectral and kinetic studies on the binding of trithiomolybdate to bovine andcanine serum albumin in vitro:The interaction with copper. J Inorg Biochem 30:261-272.259. Kincaid R.L. and White C.L. (1988). The effects of ammonium tetrathiomolybdate intake of tissue copperand molybdenum in pregnant ewes and lambs. J Anim Sci 66:3252-3258.260. Vyskocil A. and Viau C. (1999). Assessment of molybdenum toxicity in humans. J Appl Toxicol 19:185-192.261. Jones D.G. and Suttle N.F. (1981). Some effects of copper deficiency on leukocyte function in sheep andcattle. Res Vet Sci 31:151-156.262. Haywood S., Dincer Z., Holding J. and Parry N.M. (1998). Metal (molybdenum, copper) accumulationand retention in brain, pituitary and other organs of ammonium tetrathiomolybdate-treated sheep. Br J Nutr79:329-331.263. National Research Council (2005). Copper. pp. 134-153 in Mineral Tolerance of Animals. NationalAcademies Press, Washington, D.C.264. Phillippo M., Humphries W.R. and Garthwaite P.H. (1987). The effect of dietary molybdenum and iron oncopper status and growth in cattle. J Agric Sci Camb 109:315-320.265. Phillippo M., Humphries W.R., Atkinson T., Henderson G.D. and Garthwaite P.H. (1987). The effect ofdietary molybdenum and iron on copper status, puberty, fertility and oestrus cycles in cattle. J Agric SciCamb 109:321-336.266. Thomas J.W. and Moss S. (1951). The effect of orally administered molybdenum on growth, spermatogenesisand testes histology of young dairy bulls. J Dairy Sci 34:929-934.267. Ward G.M. (1978). Molybdenum toxicity and hypocuprosis in ruminants: A review. J Anim Sci46:1078-1085.268. Miltimore J.E. and Mason J.L. (1971). Copper to molybdenum ratio and molybdenum and copperconcentrations in ruminant feeds. Can J Anim Sci 51:193-200.70
269. ANZECC (2000). Australian and New Zealand Guidelines <strong>for</strong> Fresh and Marine <strong>Water</strong> <strong>Quality</strong>. <strong>Livestock</strong>drinking water guidelines.270. Swan D.A., Creeper J.H., White C.L., Ridings M., Smith G.M. and Costa N.D. (1998). Molybdenumpoisoning in feedlot cattle. Aust Vet J 76:345-349.271. Smith B.P., Fisher G.L., Poulos P.W. and Irwin M.R. (1975). Abnormal bone development and lamenessassociated with secondary copper deficiency in young cattle. J Am Vet Med Assoc 166:682-688.272. Corah L.R. and Ives S. (1992). Trace minerals in cow herd nutrition programs. Agri-Practice 13:29-33.273. Arrington L.R. and Davis G.K. (1953). Molybdenum toxicity in the rabbit. J Nutr 51:295-304.274. Singh J., Randhawa C.S., Randhawa S.S. and Nauriyal D.C. (1994). Role of dietary molybdenum inproduction of hypophosphatemia in crossbred calves. Ind J Dairy Sci 47:926.275. Jeter M.A. and Davis G.K. (1954). The effect of dietary molybdenum upon growth, hemoglobin,reproduction and lactation of rats. J Nutr 54:215-220.276. Van Niekerk F.E. and Van Niekerk C.H. (1989). The influence of experimentally induced copper deficiencyon the fertility of rams. I. Semen parameters and peripheral plasma androgen concentration. J S Afr Vet Assoc60:28-31.277. Van Niekerk F.E. and Van Niekerk C.H. (1989). The influence of experimentally induced copper deficiencyon the fertility of rams. II. Macro- and microscopic changes in the testes. J S Afr Vet Assoc 60:32-35.278. Fungwe T.V., Buddingh F., Demick D.S., Lox C.D., Yang M.T. and Yang S.P. (1990). The role of dietarymolybdenum on estrous activity, fertility, reproduction and molybdenum and copper enzyme activities offemale rats. Nutr Res 10:515-524.279. Ferguson W.S., Lewis A.H. and Watson S.J. (1938). Action of molybdenum in nutrition of milking cattle.Nature 141:553.280. Lloyd W.E., Hill H.T. and Meerdink G.L. (1976). Observations of a case of molybdenosis-copper deficiencyin a South Dakota dairy herd. pp. 85-95 in Molybdenum in the Environment (Chappell W. and PetersonK.K., eds.). Marcel Dekker, New York, NY.281. Tolgyesi G. and Elmoty I. (1968). Excretion of molybdenum given to cattle in large doses. Vet Bull1071:167.282. Sas B. (1989). Secondary copper deficiency in cattle caused by molybdenum contamination of fodder: A casehistory. Vet Hum Toxicol 31:29-33.283. Dhillon K.S., Sandhu H.S., Singh T.J., Gill B.S., Singh J. and Brar R.S. (1993). Chronic molybdenosis inbuffaloes. Ind J Anim Sci 63:1072-1074.284. Nagy J.G., Chappell W. and Ward G.M. (1975). Effects of high molybdenum intake in mule deer. J AnimSci 41:412.71
285. Van Reen R. (1954). The influence of excessive dietary molybdenum on rat liver enzymes. Arch Biochem53:77-84.286. Johnson H.L. and Miller R.F. (1963). Possible mechanisms <strong>for</strong> dietary molybdenum toxicity in the rat. JNutr 81:271-278.287. Cape L. and Hintz H.F. (1982). Influence of month, color, age, corticosteroids, and dietary molybdenum onmineral concentration of equine hair. Am J Vet Res 43:1132-1136.288. Strickland K., Smith F., Woods M. and Mason J. (1987). Dietary molybdenum as a putative copperantagonist in the horse. Equine Vet J 19:50-54.289. Ostrom C.A., Van Reen R. and Miller C.W. (1961). Changes in the connective tissue of rats fed toxic dietscontaining molybdenum salts. J Dent Res 40:520-528.290. Johnson R.H., Little J.W. and Bickley H.C. (1969). Some effects of molybdenum on connective tissue. JDent Res 48:1290-1295.291. Lalich J.J., Groupner K. and Jolin J. (1965). The influence of copper and molybdate salts on the productionof bony de<strong>for</strong>mities in rats. Lab Invest 14:1482-1493.292. Valli V.F.O., McCarter A., McSherry B.J. and Robinson G.A. (1969). Hematopoiesis and epiphyseal growthzones in rabbits with molybdenosis. Am J Vet Res 30:435-445.293. Cymbaluk N.F., Schryver H.F., Hintz H.F., Smith D.F. and Lowe J.E. (1981). Influence of dietarymolybdenum on copper metabolism in ponies. J Nutr 111:96-106.294. Cunningham H.M., Brown J.M. and Edie A.E. (1953). Molybdenum poisoning of cattle in the Swan RiverValley of Manitoba. Can J Agric Sci 33:254-260.295. Cook G.A., Lesperance A.L., Bohman V.R. and Jensen E.H. (1966). Interrelationship of molybdenum andcertain factors to the development of the molybdenum toxicity syndrome. J Anim Sci 25:96-101.296. Majak W., Steinke D., McGillivray J. and Lysyk T. (2004). Clinical signs in cattle grazing high molybdenum<strong>for</strong>age. J Range Manage 57:269-274.297. Barshad I. (1948). Molybdenum content of pasture plants in relation to toxicity to cattle. Soil Sci66:187-195.298. Dollahite J.W., Rowe L.D., Cook L.M., Hightower D., Mailey E.M. and Kyzar J.R. (1972). Copperdeficiency and molybdenosis intoxication associated with grazing near a uranium mine. Southwest Vet9:47-50.299. Lesperance A.L., Bohman V.R. and Oldfield J.E. (1985). Interaction of molybdenum, sulfate and alfalfa inthe bovine. J Anim Sci 60:791-802.300. Vanderveen J.E. and Keener H.A. (1964). Effects of molybdenum and sulfate sulfur on metabolism of copperin dairy cattle. J Dairy Sci 47:1224-1228.72
301. Huber J.T., Price N.O. and Engel R.W. (1971). Response of lactating dairy cows to high levels of dietarymolybdenum. J Anim Sci 32:364-367.302. Britton J.W. and Goss H. (1946). Chronic molybdenum poisoning in cattle. J Am Vet Med Assoc108:176-178.303. Kincaid R.L. (1980). Toxicity of ammonium molybdate added to drinking water of calves. J Dairy Sci63:608-610.304. Frank A. (1998). ‘Mysterious’ moose disease in Sweden. Similarities to copper deficiency and/ormolybdenosis in cattle and sheep. Biochemical background of clinical signs and organ lesions. Sci TotalEnviron 209:17-26.305. Mills C.F. and Fell B.F. (1960). Demyelination in lambs born of ewes maintained on high intakes of sulphateand molybdate. Nature 185:20-22.306. Hogan K.G., Money D.F.L., White D.A. and Walker R. (1971). Weight responses of young sheep to copper,and connective tissue lesions associated with the grazing of pastures of high molybdenum content. N Z JAgric Res 14:687-701.307. Sharma A.K. and Parihar N.S. (1994). Pathology of experimental molybdenosis in goats. Ind J Anim Sci64:114-119.308. Raisbeck M.F., Siemion R.S. and Smith M.S. (2006). Modest copper supplementation blocks molybdenosisin cattle. J Vet Diagn Invest 18:566-572.309. Gardner W. and Broersma K. (1999). Cattle grazing high molybdenum pasture on reclaimed mine tailings. pp66-75 in Molybdenum Issues in Reclamation: Proceedings of the 1999 Workshop, Kamloops, BC 9/24/99.310. Gardner W.G., Quinton D.A., Popp J.D., Mir Z., Mir P.S. and Buckley W.T. (1998). The use of copperboli <strong>for</strong> cattle grazing high-molybdenum <strong>for</strong>age. pp. 115-119 in Toxic Plants and Other Natural Toxicants(Garland T. and Barr A.C., eds.). CAB Intl, London.311. Quinton D.A., Mir Z., Mir P., Saunders H., van Ryswyk A. and Munro K. (1993). Effects of feeding highmolybdenum hay to mature beef steers. Proceedings of the BC Mine Reclamation Symposium 17:75-85.312. National Research Council (2005). Nitrates and nitrites. pp. 453-468 in Mineral Tolerance of Animals.National Academies Press, Washington, D.C.313. Deeb B.S. and Sloan K.W. (1975). Nitrates, nitrites, and health. University of Illinois AgriculturalExperiment Station Bulletin 750:1-52.314. Bruning-Fann C.S. and Kaneene J.B. (1993). The effects of nitrate, nitrite, and N-nitroso compounds onanimal health. Vet Hum Toxicol 35:237-253.315. Reddy K.J. and Lin J. (2000). Nitrate removal from groundwater using catalytic reduction. <strong>Water</strong> Res34:995-1001.316. Schneider N.R. and Yeary R.A. (1975). Nitrite and nitrate pharmacokinetics in the dog, sheep, and pony.Am J Vet Res 36:941-947.73
317. Osweiler G.D., Carson T.L., Buck W.B. and Van Gelder G.A. (1985). Nitrates, nitrites, and relatedproblems. pp. 460-467 in Clinical and Diagnostic Veterinary Toxicology (Osweiler G.D., Carson T.L., BuckW.B. and Van Gelder G.A., eds.). Kendall Hunt, Dubuque, IA.318. Lewicki J., Garwacki S. and Wiechetek M. (1994). Nitrate and nitrite kinetics after single intravenous dosagein sheep. Small Rumin Res 13:141-146.319. Comly H.H. (1945). Cyanosis in infants caused by nitrates in well water. J Am Med Assoc 129:112-116.320. Johnson C.J., Bonrud P.A., Dosch T.L., Kilness A.W., Senger K.A., Busch D.C. and Meyer M.S. (1987).Fatal outcome of methemoglobinemia in an infant. J Am Med Assoc 257:2796-2797.321. Wang L.C., Garcia-Rivera J. and Burris R.H. (1961). Metabolism of nitrate by cattle. Biochem J81:237-242.322. Cheng K.J., Pillippe R.C., Kozub C.C., Majak W. and Costerton J.W. (1985). Induction of nitrate andnitrite metabolism in bovine rumen fluid and the transfer of this capacity to untreated animals. Can J AnimSci 65:647-652.323. Killingmo O. and Luthman J. (1968). Toxicity of fertilizer grade calcium nitrate. Acta Agr Scand 18:80-86.324. Burrows G.E., Horn G.W., McNew R.W., Croy L.K., Keeton R.D. and Kyle J. (1987). The prophylacticeffect of corn supplementation on experimental nitrate intoxication in cattle. J Anim Sci 64:1682-1689.325. Emerick R.J., Embry L.B. and Seerley R.W. (1965). Rate of <strong>for</strong>mation and reduction of nitrite-inducedmethemoblogin in vitro and in vivo as influenced by diet of sheep and age of swine. J Anim Sci 24:221-230.326. Sokolowski J.H., Carrigus U.S. and Hatfield E.E. (1961). Effects of inorganic sulfur on KNO 3utilization bylambs. J Anim Sci 20:953.327. Sinclair K.B. and Jones D.I.H. (1964). The effect of nitrate on blood composition and reproduction in theewe. Br Vet J 120:78-86.328. Titov V.Y. and Petrenko Y.M. (2005). Proposed mechanism of nitrite-induced methemoglobinemia.Biochem 70:575-587.329. Sar C., Mwenya B., Pen B., Takaura K., Morikawa R., Tsujimoto A., Kuwaki K., Isogai N., Shinzato I.,Asakura Y., Toride Y. and Takahashi J. (2005). Effect of ruminal administration of Escherichia coli wild typeor a genetically modified strain with enhanced high nitrite reductase activity on methane emission and nitratetoxicity in nitrate-infused sheep. Br J Nutr 94:691-697.330. Bartik M. (1964). Certain quantitative relations of nitrate and nitrite metabolism in farm animals withspecial regard to the origin and development of methaemoglobinemia caused by nitrites and the diagnosisof poisonings. I. Methods <strong>for</strong> determining nitrate, nitrite and methaemoglobin in the blood. Normalmethaemoglobin content in the blood of farm animals. Folia Vet 8:83-94.331. Gangolli S.D. (1999). Nitrate, nitrite, and N-nitroso compounds. pp. 2111-2143 in General and AppliedToxicology (Ballantyne B., ed.). Macmillan, London.74
332. Crowley J.W., Jorgensen N.A., Kahler L.W., Satter L.D., Tyler W.J. and Finner M.F. (1974). Effect of nitratein drinking water on reproductive and productive efficiency of dairy cattle. Technical Report WIS WRC74-06, <strong>Water</strong> Resources Center, University of Wisconsin, Madison.333. Yeruham I., Shlosberg A., Hanji V., Bellaiche M., Marcus M. and Liberboim M. (1997). Nitrate toxicosis inbeef and dairy cattle herds due to contamination of drinking water and whey. Vet Hum Toxicol 39:296-298.334. Yong C., Brandow R.A. and Howlett P. (1990). An unusual cause of nitrate poisoning in cattle. Can Vet J31:118.335. Gibson R. (1975). An outbreak of nitrite poisoning in sows. Vet Rec 96:270.336. Campbell J.B., Davis A.N. and Myhr P.J. (1954). Methaemoglobinaemia of livestock caused by high nitratecontents of well water. Can J Comp Med 18:93-101.337. Johnson J.L., Grotelueschen D. and Knott M. (1994). Evaluation of bovine perinatal nitrate accumulation inwestern Nebraska. Vet Hum Toxicol 36:467-471.338. Dollahite J.W. and Rowe L.D. (1974). Nitrate and nitrite intoxication in rabbits and cattle. Southwest Vet27:246-248.339. Malestein A., Geurink J.H., Schuyt G., Schotman A.J.H., Kemp A. and van’t Klooser A.T. (1980). Nitratepoisoning in cattle 4. The effect of nitrine dosing during parturition on the oxygen capacity of maternal bloodand the oxygen supply to the unborn calf. Vet Q 2:149-159.340. Davison K.L., McEntee K. and Wright M.J. (1965). Responses in pregnant ewes fed <strong>for</strong>ages containingvarious levels of nitrate. J Dairy Sci 48:968-977.341. Sonderman J.P. (1993): Nitrate intoxication in ruminants: Effects on pregnancy and corpus luteum functionand analytical methods <strong>for</strong> nitrates. Ph.D. Dissertation. Colorado State University, Fort Collins, CO .342. Burwash L., Ralston B. and Olson M. (2005). Effect of high nitrate feed on mature idle horses. Proceedingsof the Annual Symposium of the Equine Science Society 19:174-179.343. Mascher F. and Marth E. (1993). Metabolism and effect of nitrates. Cent Eur J Public Health 1:49-52.344. Seerley R.W., Emerick R.J., Emery L.B. and Olson O.E. (1965). Effect of nitrate or nitrite administeredcontinuously in drinking water <strong>for</strong> swine and sheep. J Anim Sci 24:1014-1019.345. Wiese W.J. and Joubert J.P. (2001). Suspected nitrite poisoning in pigs caused by Capsella bursa-pastoris (L.)Medik. (‘herderstassie’, shepherd’s purse). J S Afr Vet Assoc 72:170-171.346. Wright M.J. and Davison K.L. (1964). Nitrate accumulation in crops and nitrate poisoning in animals. AdvAgron 16:197-247.347. Setchell B.P. and Williams A.J. (1962). Plasma nitrate and nitrite concentration in chronic and acute nitratepoisoning in sheep. Aust Vet J 38:58-62.348. Hoar D.W., Embry L.B. and Emerick R.J. (1968). Nitrate and vitamin A interrelationships in sheep. J AnimSci 27:1727-1733.75
349. McKenzie R.A., Rayner A.C., Thompson G.K., Pidgeon G.F. and Burren R. (2004). Nitrate-nitrite toxicityin cattle and sheep grazing Dactyloctenium radulans (button grass) in stockyards. Aust Vet J 82:630-634.350. Neilson F.J.A. (1974). Nitrite and nitrate poisoning with special reference to ‘grassland tama’ ryegrass. N ZVet J 22:12-13.351. Campagnolo E.R., Kasten S. and Banerjee M. (2002). Accidental ammonia exposure to county fair showlivestock due to contaminated drinking water. Vet Hum Toxicol 44:282-285.352. Hymas T.A. and Mesler R.J. (1960). Effects of a synthetic nitrate concentrate administered orally to cattle. JAm Vet Med Assoc 137:477-480.353. Ozmen O., Mor F. and Unsal A. (2003). Nitrate poisoning in cattle fed Chenopodium album hay. Vet HumToxicol 45:83-84.354. Van Dijk S., Lobsteyn A.J.H., Wensing T. and Breukink H.J. (1983). Treatment of nitrate intoxication in acow. Vet Rec 112:272-274.355. Horn G.W., Burrows G.E. and Lusby K.S. (1984). Preliminary studies on the effect of yeast culturesupplementation on nitrate/nitrite induced methemoglobinemia in lambs and steers. Vet Hum Toxicol26:309-313.356. Wallace J.D., Raleigh R.J. and Weswig P.H. (1964). Per<strong>for</strong>mance and carotene conversion in Here<strong>for</strong>d heifersfed different levels of nitrate. J Anim Sci 23:1042-1045.357. Weichenthal B.A., Embry L.B., Emerick R.J. and Whetzel F.W. (1963). Influence of sodium nitrate, vitaminA and protein level on feedlot per<strong>for</strong>mance and vitamin A status of fattening cattle. J Anim Sci 22:979-984.358. Garner R.J. (1967). Nitrates and Nitrites. pp. 108-112 in Veterinary Toxicology (Clarke E.G. and ClarkeM.L., eds.). Bailliere, Tindell & Cassell, London.359. O’Hara P.J. and Fraser A.J. (1975). Nitrate poisoning in cattle grazing crops. N Z Vet J 23:45-53.360. Low I.C.S. (1974). Nitrite poisoning of calves grazing `Grasslands Tama’ ryegrass. N Z Vet J 22:60-61.361. Slenning B.D., Galey F.D. and Anderson M. (1991). Forage-related nitrate toxicoses possibly confounded bynonprotein nitrogen and monensin in the diet used at commercial dairy heifer replacement operation. J AmVet Med Assoc 198:867-870.362. Harris D.J. and Rhodes H.A. (1969). Nitrate and nitrite poisoning in cattle in Victoria. Aust Vet J45:590-591.363. Carrigan M.J. and Gardner I.A. (1982). Nitrate poisoning in cattle fed sudax (Sorghum sp. hybrid) hay. AustVet J 59:155-157.364. Villar D., Schwartz K.J., Carson T.L., Kinker J.A. and Barker J. (2003). Acute poisoning of cattle byfertilizer-contaminated water. Vet Hum Toxicol 45:88-90.365. DeRoos A.J., Ward M.H., Lynch C.F. and Cantor K.P. (2003). Nitrate in public water supplies and the riskof colon and rectum cancers. Epidemiology 14:640-649.76
366. Walker R. (1990). Nitrates, nitrites and N-nitrosocompounds: A review of the occurrence in food and dietand the toxicological implications. Food Addit Contam 7:717-768.367. Kleinjans J.C.S., Albering H.J., Marx A., van Maanen J.M.S., van Agen B., ten Hoor F., Swaen G.M.H. andMertens P.L.J.M. (1991). Nitrate contamination of drinking water: Evaluation of genotoxic risk in humanpopulations. Environ Health Perspect 94:189-193.368. Cross A., Cantor K.P., Reif J.S., Lynch C.F. and Ward M.H. (2004). Pancreatic cancer and drinking waterand dietary sources of nitrate and nitrite. Am J Epidemiol 159:693-701.369. Rademacher J.J., Young T.B. and Kanarek M.S. (1992). Gastric cancer mortality and nitrate levels inWisconsin drinking water. Arch Environ Health 47:292-294.370. Steindorf K., Schlehofer B., Becher H., Hornig G. and Wahrendorf J. (1994). Nitrate in drinking water.A case-control study on primary brain tumors with an embedded drinking water survey in Germany. Int JEpidemiol 23:451-457.371. Xu G., Song P. and Reed P.I. (1992). The relationship between gastric mucosal changes and nitrate intakevia drinking water in a high-risk population <strong>for</strong> gastric cancer in Moping County, China. Eur J Cancer Prev1:437-443.372. Anderson D.M. and Stothers S.C. (1972). Effects of saline water on young weanling pigs. Proceedings,Western Section, American Society of Animal Science 23:133-138.373. Anderson D.M. and Stothers S.C. (1978). Effects of saline water high in sulfates, chlorides and nitrates onthe per<strong>for</strong>mance of young weanling pigs. J Anim Sci 47:900-907.374. Fan A.M., Willhite C.C. and Book S.A. (1987). Evaluation of the nitrate drinking water standard withreference to infant methemoglobinemia and potential reproductive toxicity. Regul Toxicol Pharmacol7:135-148.375. Bruning-Fann C., Kaneene J.B., Miller R.A., Gardner I., Johnson R. and Ross F. (1994). The use ofepidemiological concepts and techniques to discern factors associated with the nitrate concentration of wellwater on swine farms in the USA. Sci Total Environ 153:85-96.376. Garner G.B. (1958). Learning to live with nitrate. Mo Agr Exper Sta Bull 708:1-8.377. Case A.A. (1957). Some aspects of nitrate poisoning in livestock. J Am Vet Med Assoc 130:323-329.378. Buck W.B. (1970). Diagnosis of feed-related toxicoses. J Am Vet Med Assoc 156:1434-1443.379. McIlwain P.K. and Schipper I.A. (1963). Toxicity of nitrate nitrogen to cattle. J Am Vet Med Assoc142:502-505.380. Emerick R.J. (1974). Consequences of high nitrate levels in feed and water supplies. Fed Proc 33:1183-1187.381. Winter A.J. and Hokanson J.F. (1964). Effects of long-term feeding of nitrate, nitrite or hydroxylamine onpregnant dairy heifers. Am J Vet Res 25:353-361.77
382. Ensley S.M. (2000): Relationships of drinking water quality to production and reproduction in dairy herds.Ph.D. Dissertation. Iowa State University, Ames, IA. .383. Thorne E.T., Kingston N., Jolley W.R. and Bergstrom R.C. (1982). Diseases of <strong>Wildlife</strong> in <strong>Wyoming</strong>, 2nded. <strong>Wyoming</strong> Game and Fish Dept., Cheyenne, WY.384. Kirkpatrick W.C., Roller M.H. and Swanson R.N. (1973). Hemogram of sheep acutely intoxicated withammonia. Am J Vet Res 34:587-589.385. Ganong W.F. (1971). Review of Medical Physiology, Lange Medical Publications, Canada.386. National Research Council (2005). Minerals and acid-base balance. pp. 449-452 in Mineral Tolerance ofAnimals. National Academies Press, Washington, D.C.387. Bushinsky D.A., Smith S.B., Gavrilov K.L., Gavrilov L.F., Li J. and Levi-Setti R. (2003). Chronic acidosisinducedalteration in bone bicarbonate and phosphate. Am J Physiol Renal Physiol 285:F532-F539.388. Swan R.C. and Pitts R.F. (1955). Neutralization of infused acid by nephrectomized dogs. J Clin Invest34:205-212.389. Ender F., Dishington I.W. and Helgebostad A. (1962). Parturient paresis and related <strong>for</strong>ms of hypocalcemicdisorders induced experimentally in dairy cows. Acta Vet Scand 3 (Supplement 1):3-52.390. Wang C. and Beede D.K. (1992). Effects of ammonium chloride and sulfate on acid-base status and calciummetabolism of dry Jersey cows. J Dairy Sci 75:820-828.391. Goff J.P. and Horst R.L. (1998). Use of hydrochloric acid as a source of anions <strong>for</strong> prevention of milk fever. JDairy Sci 81:2874-2880.392. DeZuane J. (1990). Handbook of Drinking <strong>Water</strong> <strong>Quality</strong>: Standards and Controls, 1st ed. Van NostrandReinhold, New York, NY.393. Sharpe W.E. and DeWalle D.R. (1985). Potential health implications <strong>for</strong> acid precipitation, corrosion, andmetals contamination of drinking water. Environ Health Perspect 63:71-78.394. Wood J.M. (1985). Effects of acidification on the mobility of metals and metalloids: An overview. EnvironHealth Perspect 63:115-119.395. Nordberg G.F., Goyer R.A. and Clarkson T.W. (1985). Impact of effects of acid precipitation on toxicity ofmetals. Environ Health Perspect 63:169-180.396. Ritskes-Hoitinga J., Meijers M. and van Herck H. (1998). Bacteriological quality and intake of acidifieddrinking water in Wistar rats is pH-dependent. Scand J Lab Anim Sci 25:124-128.397. Tolo K.J. and Erichsen S. (1969). Acidified drinking water and dental enamel in rats. Z Versuchstierkd11:229-233.398. Environmental Protection Agency (2000). Acid Rain. http://dwb.unl.edu/Teacher/NSF/C14/C14Links/www.epa.gov/airmarkets/acidrain/effects/surfacewater.html, accessed 6/12/2007.78
399. Wu L., Kohler J.E., Zaborina O., Akash G., Musch M.W., Chang E.B. and Alverdy J.C. (2006). Chronicacid water feeding protects mice against lethal gut-derived sepsis due to Pseudomonas aeruginosa. Curr IssuesIntest Microbiol 7:19-28.400. van der Wolf P.J., van Schie F.W., Elbers A.R., Engel B., van der Heijden H.M., Hunneman W.A. and TielenM.J. (2001). Administration of acidified drinking water to finishing pigs in order to prevent Salmonellainfections. Vet Q 23:121-125.401. Tober-Meyer B.K., Bieniek H.J. and Kupke I.R. (1981). Studies on the hygiene of drinking water <strong>for</strong>laboratory animals. 2. Clinical and biochemical studies in rats and rabbits during long-term provision ofacidified drinking water. Laboratory Animals 15:111-117.402. Ender F., Dishington I.W. and Helgebostad A. (1971). Calcium balance studies in dairy cows underexperimental induction and prevention of hypcalcaemic paresis. Z Tierphysiol, Tierernahrg u Futtermittelkde28:233-256.403. Hall J.E., White W.J. and Lang C.M. (1980). Acidification of drinking water: Its effects on selected biologicphenomena in male mice. Lab Anim Sci 30:643-651.404. Clausing P. and Gottschalk M. (1989). Effects of drinking-water acidification, restriction of water-supply andindividual caging on parameters of toxicological studies in rats. Z Versuchstierkd 32:129-134.405. McClure F.J. (1943). The destructive action, in vivo, of dilute acids and acid drinks and beverages on the rats’molar teeth. J Nutr 26:251-259.406. Hermann L.M., White W.J. and Lang C.M. (1982). Prolonged exposure to acid, chlorine, or tetracycline inthe drinking water: Effects on delayed-type hypersensitivity, hemagglutination titers, and reticuloendothelialclearance rates in mice. Lab Anim Sci 32:603-608.407. Les E.P. (1968). Effect of acidified-chlorinated water on reproduction in C3H-HeV and C57BL-5J mice.Lab Anim Care 18:210-213.408. Yiasoumi B. (2003). pH in water. http://www.ricecrc.org/reader/water-quality-supply/ac2-ph.htm, accessed5/1/2007.409. National Research Council (1980). Selenium. pp. 392-420 in Mineral Tolerance of Domestic Animals.National Academies Press, Washington, D.C.410. Girling C.A. (1984). Selenium in agriculture and the environment. Agric Ecosyst Environ 11:37-65.411. Ohlendorf H.M. (1989). Bioaccumulation and effects of selenium in wildlife. pp. 133-177 in Selenium inAgriculture and the Environment. Soil Science Society of America, Madison, Wis.412. Boon D.Y. (1989). Potential selenium problems in great plains soils. pp. 107-121 in Selenium in Agricultureand the Environment (Jacobs L.W., ed.). Soil Science Society of America, Madison, WI.413. Fessler A.J., Moller G., Talcott P.A. and Exon J.H. (2003). Selenium toxicity in sheep grazing reclaimedphosphate mining sites. Vet Hum Toxicol 45:294-298.414. Talcott P.A. (1999). Diagnostic Report. WADDL #99-110127.79
415. Raisbeck M.F. (2007). Unpublished data. University of <strong>Wyoming</strong>, Dept of Veterinary Sciences.416. Saiki M.K. (1986). A field example of selenium contamination in an aquatic food chain. Proceedings of theAnnual Symposium on Selenium in the Environment - Fresno, CA June 10-12 1:67-76.417. Ohlendorf H.M. and Skorupa J.P. (1989). Selenium in relation to wildlife and agricultural drainage water.pp. 314-334 in Fourth International Symposium on Uses of Selenium and Tellurium (Carapella S.C., ed.).Selenium-Tellurium Development Association, Darien, CT.418. Presser T.S., Sylvester M.A. and Low W.H. (1994). Bioaccumulation of selenium from natural geologicsources in western states and its potential consequences. Environ Manag 18:423-436.419. Barceloux D.G. (1999). Selenium. Clin Toxicol 37:145-172.420. Tapiero H., Townsend D.M. and Tew K.D. (2003). The antioxidant role of selenium and seleno-compounds.Biomed Pharmacother 57:134-144.421. National Research Council (2005). Selenium. pp. 321-347 in Mineral Tolerance of Animals. NationalAcademies Press, Washington, D.C.422. Oldfield J.E., Schubert J.R. and Muth O.H. (1963). Implications of selenium in large animal nutrition.Agric Food Chem 11:388-390.423. Muth O.H., Oldfield J.E., Remmert L.F. and Schubert J.R. (1958). Effects of selenium and vitamin E onwhite muscle disease. Science 128:1090.424. FDA (1987). Food additives permitted in feed and drinking water of animals; Selenium. Fed Reg52:10887-10888.425. Edmondson A.J., Norman B.B. and Suther D. (1993). Survey of state veterinarians and state veterinarydiagnostic laboratories <strong>for</strong> selenium deficiency and toxicosis in animals. J Am Vet Med Assoc 202:865-872.426. Raisbeck M.F., Dahl E.R., Sanchez D.A., Belden E.L. and O’Toole D. (1993). Naturally occurring selenosisin <strong>Wyoming</strong>. J Vet Diagn Invest 5:84-87.427. Olson O.E., Novacek E.J., Whitehead E.I. and Palmer I.S. (1970). Investigations on selenium in wheat.Phytochemistry 9:1181-1188.428. Wang Y., Bock A. and Neuhierl B. (1999). Acquisition of selenium tolerance by a selenium nonaccumulatingAstragalus species via selection. BioFactors 9:3-10.429. Neuhierl B. and Bock A. (1996). On the mechanism of selenium tolerance in selenium-accumulating plants:Purification and characterization of a specific selenocysteine methyltransferase from cultured cells of Astragalusbisculatus. Eur J Biochem 239:235-238.430. Raisbeck M.F. (2000). Selenosis. Vet Clin North Am Food Anim Pract 16:465-480.431. United States Geological Survey (1990). Detailed study of selenium in soil, representative plants, waterbottom sediment, and biota in the Kendrick Reclamation Project area, <strong>Wyoming</strong>, 1988-1990, 1st ed. UnitedStates Geological Survey, Denver, CO.80
432. Naftz D.L. and Rice J.A. (1989). Geochemical processes controlling selenium in ground-water after mining,Powder River Basin, <strong>Wyoming</strong>, USA. Appl Geochem 4:565-676.433. Whanger P., Vendeland S., Park Y.C. and Xia Y. (1996). Metabolism of subtoxic levels of selenium in animalsand humans. Ann Clin Lab Sci 26:99-113.434. Turner J.C., Osborn P.J. and McVeagh S.M. (1990). Studies on selenate and selenite absorption by sheepileum using an everted sac method and an isolated, vascularly perfused system. Comp Biochem Physiol A95:297-301.435. Goede A.A. and Wolterbeek H.T. (1994). Have high selenium concentrations in wading birds their origins inmercury? Sci Total Environ 144:247-253.436. Vendeland S.C., Butler J.A. and Whanger P.D. (1992). Intestinal absorption of selenite, selenate andselenomethionine in the rat. J Nutr Biochem 3:359-365.437. Windisch W. and Kirchgessner M. (2000). Selenium true absorption and tissue concentration of rats atdietary selenite, seleno cysteine, and seleno methionine. pp. 173-174 in Trace Elements in Man and Animals(Roussel A.M., Anderson R.A. and Favier A.E., eds.). Kluwer Academic/Plenum Publishers, New York, NY.438. Raisbeck M.F., O’Toole D., Belden E.L. and Waggoner J.W. (1998). Chronic selenosis in ruminants. pp.389-396 in Toxic Plants and Other Natural Toxicants (Garland T. and Barr A.C., eds.). CAB International,New York, NY.439. Wright P.L. and Bell M.C. (1966). Comparative metabolism of selenium and tellurium in sheep and swine.Am J Physiol 211:6-10.440. Hill K.E., Zhou J., McMahan W.J., Motley A.K., Atkins J.F., Gesteland R.F. and Burk R.F. (2003). Deletionof selenoprotein P alters distribution of selenium in the mouse. J Biol Chem 278:13640-13646.441. Windisch W. and Kirchgessner M. (2000). True absorption, excretion, and tissue retention of selenium atwidely varying selenium supply to rats. pp. 883-886 in Trace Elements in Man and Animals (Roussel A.M.,Anderson R. and Favier A.E., eds.). Kluwer Academic/Plenum Publishers, New York, NY.442. Hintze K.J., Lardy G.P., Marchello M.J. and Finley J.W. (2002). Selenium accumulation in beef: Effect ofdietary selenium and geographic area of animal origin. J Agric Food Chem 50:3938-3942.443. Moxon A.L. (1941). The influence of arsenic on selenium poisoning in hogs. Proc S Dak Acad Sci 21:34-36.444. Ganther H.E. and Baumann C.A. (1962). Selenium metabolism. II. Modifying effects of sulfate. J Nutr77:408-414.445. Pope A.L., Moir R.J., Somers M., Underwood E.J. and White C.L. (1979). The effect of sulphur on Seabsorption and retention in sheep. J Nutr 109:1448-1455.446. Ivancic J. J and Weiss W.P. (2001). Effect of dietary sulfur and selenium concentrations on selenium balanceof lactating Holstein cows. J Dairy Sci 84:225-232.447. van Ryssen J.B.J., van Malsen P.S.M. and Hartmann F. (1998). Contribution of dietary sulphur to theinteraction between selenium and copper in sheep. J Agric Sci 130:107-114.81
448. Halverson A.W. and Monty K.J. (1960). An effect of dietary sulfate on selenium poisoning in the rat. J Nutr70:100-102.449. O’Toole D. and Raisbeck M.F. (1997). Experimentally induced selenosis of adult mallard ducks: Clinicalsigns, lesions, and toxicology. Vet Pathol 34:330-340.450. O’Toole D. and Raisbeck M.F. (1998). Magic numbers, elusive lesions: Comparative pathology andtoxicology of selenosis in waterfowl and mammalian species. pp. 355-395 in Environmental Chemistry ofSelenium (Frankenberger J. WT and Engberg R.A., eds.). Marcel Dekker, New York, NY.451. Palmer I.S., Olson O.E., Halverson A.W., Miller R. and Smith C. (1980). Isolation of factors in linseed oilmeal protective against chronic selenosis in rats. J Nutr 110:145-150.452. Stowe H.D. (1980). Effects of copper pretreatment upon the toxcicity of selenium in ponies. Am J Vet Res41:1925-1928.453. Rosenfeld I. and Beath O.A. (1946). The influence of protein diets on selenium poisoning. I. Am J Vet Res7:52-56.454. Van Vleet J.F., Meyer K.B. and Olander H.J. (1974). Acute selenium toxicosis induced in baby pigs byparenteral administration of selenium-vitamin E preparations. J Am Vet Med Assoc 165:543-547.455. Palmer L.S. and Olson O.E. (1974). Relative toxicities of selenite and selenate in the drinking water of rats. JNutr 104:306-314.456. Heinz G.H., Hoffman D.J., Krynitsky A.J. and Weller D.M.G. (1987). Reproduction of mallards fedselenium. Environ Toxicol Chem 6:423-433.457. Baker D.C., James L.F., Hartley W.J., Panter K.E., Maynard H.F. and Pfister J. (1989). Toxicosis in pigs fedselenium-accumulating Astragalus plant species or sodium selenate. Am J Vet Res 50:1396-1399.458. O’Toole D. and Raisbeck M.F. (1995). Pathology of experimentally induced chronic selenosis (alkali disease)in yearling cattle. J Vet Diagn Invest 7:364-373.459. Fitzhugh O.G., Nelson A.A. and Bliss C.I. (1944). The chronic oral toxicity of selenium. J Pharmacol ExpTher 80:289-299.460. Panter K.E., Hartley W.J., James L.F., Mayland H.F., Stegelmeier B.L. and Kechele P.O. (1996). Comparativetoxicity of selenium from seleno-DL-methionine, sodium selenate, and Astragalus bisulcatus in pigs. FundAppl Toxicol 32:217-223.461. Glenn M.W., Jensen R. and Griner L.A. (1964). Sodium selenate toxicosis: Pathology and pathogenesis ofsodium selenate toxicosis in sheep. Am J Vet Res 25:1486-1493.462. Heinrick M.A. and MacCanon D. (1960). Some effects of sodium selenite on the cardiovascular system.Toxicol Appl Pharmacol 2:33-43.463. Ohlendorf H.M., Kilness A.W., Simmons J.L., Stroud R.K., Hoffman D.J. and Moore J.F. (1988). Seleniumtoxicosis in wild aquatic birds. J Toxicol Environ Health 24:67-92.82
464. Glenn M.W., Jensen R. and Griner L.A. (1964). Sodium selenate toxicosis: The effects of extended oraladministration of sodium selenate on mortality, clinical signs, fertility, and early embryonic development insheep. Am J Vet Res 25:1479-1485.465. Willhite C.C. (1993). Selenium teratogenesis. Species dependent response and influence on reproduction.Ann NY Acad Sci 678:169-177.466. Tarantal A.F., Willhite C.C., Lasley B.L., Murphy C.J., Miller C.J., Cukierski M.J., Book S.A. and HendrickxA.G. (1991). Developmental toxicity of L-selenomethionine in Macaca fascicularis. Fund Appl Toxicol16:147-160.467. Westfall B.B., Stohlman E.F. and Smith M.I. (1938). The placental transmission of selenium. J PharmacolExp Ther 64:55-57.468. Wahlstrom R.C. and Olson O.E. (1959). The effect of selenium on reproduction in swine. J Anim Sci18:141-145.469. Raisbeck M.F. and O’Toole D. (1998). Morphologic studies of selenosis in herbivores. pp. 380-388 in ToxicPlants and Other Natural Toxicants (Garland T. and Barr A.C., eds.). CAB International, New York, NY.470. Orstadius K. (1960). Toxicity of a single subcutaneous dose of sodium selenite in pigs. Nature 188:1117.471. Shortridge E.H., O’Hara P.J. and Marshall P.M. (1971). Acute selenium poisoning in cattle. N Z Vet J19:47-50.472. MacDonald D.W., Christian R.G., Strausz K.I. and Roff J. (1981). Acute selenium toxicity in neonatalcalves. Can Vet J 22:279-281.473. Blodgett D.J. and Bevill R.F. (1987). Acute selenium toxicosis in sheep. Vet Hum Toxicol 29:233-236.474. Kuttler K.L., Marble D.W. and Blincoe C. (1961). Serum and tissue residues following selenium injections insheep. Am J Vet Res 22:422-428.475. Franke K.W. and Potter V.R. (1935). A new toxicant occurring naturally in certain samples of plantfoodstuffs. J Nutr 10:213-221.476. Hadjimarkos D.M. (1966). Effect of selenium on food and water intake in the rat. Experientia 22:117-118.477. Halverson A.W., Palmer I.S. and Guss P.L. (1966). Toxicity of selenium to post-weanling rats. Toxicol ApplPharmacol 9:477-484.478. Miller W.T. and Williams K.T. (1940). Minimum lethal doses of selenium, as sodium selenite, <strong>for</strong> horses,mules, cattle, and swine. J Agric Res 60:163-173.479. Hill J., Allison F. and Halpin C. (1985). An episode of acute selenium toxicity in a commercial piggery. AustVet J 62:207-209.480. Stowe H.D., Eavey A.J., Granger L., Halstead S. and Yamini B. (1992). Selenium toxicosis in feeder pigs. JAm Vet Med Assoc 201:292-295.83
481. Mihailovic M., Matic G., Lindberg P. and Zigic B. (1992). Accidental selenium poisoning of growing pigs.Biol Trace Elem Res 33:63-69.482. Wilson T.M., Scholz R.W. and Drake T.R. (1983). Selenium toxicity and porcine focal symmetricalpoliomyelomalacia: Description of a field outbreak and experimental reproduction. Can J Comp Med47:412-421.483. Schoening H.W. (1936). Production of so-called alkali disease in hogs by feeding corn grown in affected area.North Am Vet 17:22-28.484. Smyth J.B.A., Wang J.H., Barlow R.M., Humphreys D.J., Robins M. and Stodulski J.B.J. (1990).Experimental acute selenium intoxication in lambs. J Comp Pathol 102:197-209.485. Gabbedy B.J. and Dickson J. (1969). Acute selenium poisoning in lambs. Aust Vet J 45:470-472.486. Morrow D.A. (1968). Acute selenite toxicosis in lambs. J Am Vet Med Assoc 152:1625-1629.487. Maag D.D., Orsborn J.S. and Clopton J.R. (1960). The effect of sodium selenite on cattle. Am J Vet Res21:1049-1053.488. Raisbeck M.F., Schamber R.A. and Belden E.L. (1998). Immunotoxic effects of selenium in mammals. pp.260-266 in Toxic Plants and Other Natural Toxicants (Garland T. and Barr A.C., eds.). CAB International,New York, NY.489. Kaur R., Sharma S. and Rampal S. (2003). Effect of sub-chronic selenium toxicosis on lipid peroxidation,glutathione redox cycle and antioxidant enzymes in calves. Vet Hum Toxicol 45:190-192.490. Jenkins K.J. and Hidiroglou M. (1986). Tolerance of the preruminant calf <strong>for</strong> selenium in milk replacer. JDairy Sci 69:1865-1870.491. Dewes H.F. and Lowe M.D. (1987). Suspected selenium poisoning in a horse. N Z Vet J 35:53-54.492. Witte S.T., Will L.A., Olsen C.R., Kinker J.A. and Miller-Graber P. (1993). Chronic selenosis in horses fedlocally produced alfalfa hay. J Am Vet Med Assoc 202:406-409.493. Witte S.T. and Will L.A. (1993). Investigation of selenium sources associated with chronic selenosis in horsesof western Iowa. J Vet Diagn Invest 5:128-131.494. Galey F.D. (1996). Personal communication. Veterinary Toxicologist, Cali<strong>for</strong>nia Veterinary LaboratorySystem.495. Talcott P.S. (2006). Personal communication. Professor of Veterinary Toxicology, Washington State University.496. Miller W.T. and Williams K.T. (1940). Effect of feeding repeated small doses of selenium as sodium seleniteto equines. J Agric Res 61:353-368.497. Coenen M., Landes E. and Assmann G. (1998). Selenium toxicosis in the horse - Case report. J AnimPhysiol Anim Nutr 80:153-157.84
498. Knott S.G. and McCray C.W.R. (1959). Two naturally occurring outbreaks of selenosis in Queensland. AustVet J 35:161-165.499. Ahmed K.E., Adam S.E., Idrill O.F. and Wahbl A.A. (1990). Experimental selenium poisoning in nubiangoats. Vet Hum Toxicol 32:249-251.500. Ghosh A., Sarkar S., Pramanik A.K., Chowdhury S.P. and Ghosh S. (1993). Selenium toxicosis in grazingbuffaloes and its relationship with soil and plant of West Bengal. Ind J Anim Sci 63:557-560.501. Raisbeck M.F., O’Toole D., Schamber R.A., Belden E.L. and Robinson L.J. (1996). Toxicologic evaluation ofa high-selenium hay diet in captive pronghorn antelope (Antilocapra americana). J Wildl Dis 32:9-16.502. Lawler T.L., Taylor J.B., Finley J.W. and Caton J.S. (2004). Effect of supranutritional and organically boundselenium on per<strong>for</strong>mance, carcass characteristics, and selenium distribution in finishing beef steers. J AnimSci 82:1488-1493.503. Ellis R.G., Herdt T.H. and Stowe H.D. (1997). Physical, hematologic, biochemical and immunologic effectsof supranutritional supplementation with dietary selenium in Holstein cows. Am J Vet Res 58:760-764.504. Panter K.E., James L.F. and Mayland H.F. (1995). Reproductive response of ewes fed alfalfa pelletscontaining sodium selenate or Astragalus bisulcatus as a selenium source. Vet Hum Toxicol 37:30-32.505. Tucker J.O. (1960). Preliminary report of selenium toxicity in sheep. Proceedings of the American College ofVeterinary Toxicologists :41-45.506. Cristaldi L.A., McDowell L.R., Buergelt C.D., Davis P.A., Wilkinson N.S. and Martin F.G. (2005).Tolerance of inorganic selenium in wether sheep. Small Rumin Res 56:205-213.507. Davis P.A., McDowell L.R., Wilkinson N.S., Buergelt C.D., Van Alstyne R., Weldon R.N. and MarshallT.T. (2006). Tolerance of inorganic selenium by range-type ewes during gestation and lactation. J Anim Sci84:660-668.508. Mostrom M.S. (2006). Personal communication. Veterinary Toxicologist, North Dakota State University.509. Reagor J.C. (2006). Personal communication. Toxicologist, Texas Veterinary Medical Diagnostic Lab.510. Kuck L. (2003). An evaluation of the effects of selenium on elk, mule deer and elk in southeast Idaho.Prepared <strong>for</strong> Idaho Mining Association by Montgomery Watson Harza, Belleview, WA.511. National Research Council (1980). Sodium Chloride. pp. 441-458 in Mineral Tolerance of DomesticAnimals. National Academies Press, Washington, D.C.512. Vincent I.C., Williams H.L. and Hill R. (1986). Effects of sodium intake on lactation and Na levels in bodyfluids of Blackface sheep. Br J Nutr 56:193-198.513. Morris J.G., Delmas R.E. and Hull J.L. (1980). Salt (sodium) supplementation of range beef cows inCali<strong>for</strong>nia. J Anim Sci 51:722-731.514. National Research Council (2005). Sodium Chloride. pp. 357-371 in Mineral Tolerance of Animals.National Academies Press, Washington, D.C.85
515. National Research Council (1989). Nutrient requirements, deficiencies and excesses. pp. 2-31 in NutrientRequirements of Horses. National Academy of Sciences, Washington, D.C.516. Coppock C.E. and Fettman M.J. (1978). Chloride as a required nutrient <strong>for</strong> lactating dairy cows. Feedstuffs50:20-22.517. Fraser D. and Reardon E. (1980). Attraction of wild ungulates to mineral-rich springs in central Canada.Holarctic Ecology 3:36-39.518. Hagsten I. and Perry T.W. (1976). Evaluation of dietary salt levels <strong>for</strong> swine. I. Effect on gain, waterconsumption and efficiency of feed conversion. J Anim Sci 42:1187-1189.519. Hagsten I. and Perry T.W. (1976). Evaluation of dietary salt levels <strong>for</strong> swine. II. Effect on blood and excretorypatterns. J Anim Sci 42:1191-1195.520. Honeyfield D.C., Froseth J.A. and Barke R.J. (1985). Dietary sodium and chloride levels <strong>for</strong> growingfinishingpigs. J Anim Sci 60:691-698.521. Honeyfield D.C. and Froseth J.A. (1985). Effects of dietary sodium and chloride on growth, efficiency offeed utilization, plasma electrolytes and plasma basic amino acids in young pigs. J Nutr 115:1366-1371.522. DeZuane J. (1990). Handbook of Drinking <strong>Water</strong> <strong>Quality</strong>: Standards and Controls, 1st ed. Van NostrandReinhold, New York, NY.523. Silanikove N., Maltz E., Halevi A. and Shinder D. (1997). Metabolism of water, sodium, potassium, andchlorine by high yielding dairy cows at the onset of lactation. J Dairy Sci 80:949-956.524. Shalit U., Maltz E., Silanikove N. and Berman A. (1991). <strong>Water</strong>, sodium, potassium and chlorinemetabolism of dairy cows at the onset of lactation in hot weather. J Dairy Sci 74:1874-1883.525. Jones G. (1982). Salt deficiency in dairy cattle. Clinical Report. Mod Vet Pract 63:810-811.526. Whitlock R.H., Kessler M.J. and Tasker J.B. (1975). Salt (sodium) deficiency in dairy cattle: Polyuria andpolydipsia as prominent clinical features. Cornell Vet 65:512-526.527. Neathery M.W., Blackmon D.M., Miller W.J., Heinmiller S., McGuire S., Tarabula J.M., Gentry R.P. andAllen J.C. (1981). Chloride deficiency in Holstein calves from a low chloride diet and removal of abomasalcontents. J Dairy Sci 64:2220-2233.528. Fettman M.J., Chase L.E., Bentinck-Smith J., Coppock C.E. and Zinn S.A. (1984). Nutritional chloridedeficiency in early lactation Holstein cows. J Dairy Sci 67:2321-2335.529. Fettman M.J., Chase L.E., Bentinck-Smith J., Coppock C.E. and Zinn S.A. (1984). Effects of dietarychloride restriction in lactating dairy cows. J Am Vet Med Assoc 185:167-172.530. Hemsley J.A. (1975). Effect of high intakes of sodium chloride on the utilization of a protein concentrate bysheep. I. Wool growth. Aust J Agric Res 26:709-714.531. Croom J. WJ, Harvey R.W., Amaral D.M. and Spears J.W. (1983). Growth, carcass, ruminal and metabolicparameters of fattening steers fed elevated levels of sodium chloride and limestone. J Anim Sci 57 (S1):11-12.86
532. Harvey R.W., Croom J. WJ, Pond K.R., Hogarth B.W. and Leonard E.S. (1986). High levels of sodiumchloride in supplements <strong>for</strong> growing cattle. Can J Anim Sci 66:423-429.533. Hemsley J.A., Hogan J.P. and Weston R.H. (1975). Effect of high intakes of sodium chloride on theutilization of a protein concentrate by sheep. II. Digestion and absorption of organic matter and electrolytes.Aust J Agric Res 26:715-727.534. Mason G.D. and Scott D. (1974). Renal excretion of sodium and sodium tolerance in the pig. Q J ExpPhysiol Cogn Med Sci 59:103-112.535. Tucker W.B. and Hogue J.F. (1990). Influence of sodium chloride or potassium chloride on systemic acidbasestatus, milk yield and mineral metabolism in lactating dairy cows. J Dairy Sci 73:3485-3493.536. Golz D.I. and Crenshaw T.D. (1990). Interrelationships of dietary sodium, potassium and chloride ongrowth in young swine. J Anim Sci 68:2736-2747.537. Masters D.G., Rintoul A.J., Dynes R.A., Pearce K.L. and Norman H.C. (2005). Feed intake and productionin sheep fed diets high in sodium and potassium. Aust J Agric Res 56:427-434.538. Sandals W.C.D. (1978). Acute salt poisoning in cattle. Can Vet J 19:136-137.539. Weeth H.J., Lesperance A.L. and Bohman V.R. (1968). Intermittent saline watering of growing beef heifers.J Anim Sci 27:739-744.540. Tomas F.M., Jones G.B., Potter B.J. and Langs<strong>for</strong>d G.L. (1973). Influence of saline drinking water onmineral balances in sheep. Aust J Agric Res 24:377-386.541. Potter B.J. (1963). The effect of saline water on kidney tubular function and electrolyte excretion in sheep.Aust J Agric Res 14:518-528.542. Wilson A.D. (1966). The tolerance of sheep to sodium chloride in food or drinking water. Aust J Agric Res17:503-514.543. Trueman K.F. and Clague D.C. (1978). Sodium chloride poisoning in cattle. Aust Vet J 54:89-91.544. Baird A.C. (1969). Salt poisoning in the dog. Vet Rec 85:756.545. Berger L.L. (1993). Salt <strong>for</strong> beef cattle. pp. 7-13 in Salt and Trace Minerals <strong>for</strong> <strong>Livestock</strong>, Poultry and OtherAnimals (Berger L.L., ed.). Salt Institute, Fairfax,VA.546. Peirce A.W. (1957). Studies of salt tolerance of sheep. I. The tolerance of sheep <strong>for</strong> sodium chloride in thedrinking water. Aust J Agric Res 8:711-722.547. Jaster E.H., Schuh J.D. and Wegner T.N. (1978). Physiological effects of saline drinking water on highproducing dairy cows. J Dairy Sci 61:66-71.548. Khanna C., Boermans H.J. and Wilcock B. (1997). Fatal hypernatremia in a dog from salt ingestion. J AmAnim Hosp Assoc 33:113-117.87
549. Strange K. (1992). Regulation of solute and water balance and cell volume in the central nervous system. JAm Soc Nephrol 3:12-27.550. Weeth H.J. and Lesperance A.L. (1965). Renal function of cattle under various water and salt loads. J AnimSci 24:441-447.551. Ohman A.F.S. (1939). Poisoning of cattle by saline bore water. Aust Vet J 15:37-38.552. Sautter J.H., Sorenson D.K. and Clark J.J. (1957). Symposium on poisoning - Part I. Case 1 - Salt poisoningin swine. J Am Vet Med Assoc 130:12-13.553. Pretzer S.D. (2000). Diarrhea in gilts caused by excessive dietary sodium chloride. Swine Health Prod8:181-183.554. Fountaine J.H., Gasche J. DG and Oehme F.W. (1975). Experimental salt poisoning (water deprivationsyndrome) in swine. Vet Toxicol 17:5-8.555. Hughes D.E. and Sokolowski J.H. (1978). Sodium chloride poisoning in the dog. Canine Pract 5:28-31.556. Barr J.M., Kahn S.A., McCullough S.M. and Volmer P.A. (2004). Hypernatremia secondary to homemadeplay dough ingestion in dogs: A review of 14 cases from 1998 to 2001. J Vet Emerg Crit Care 14:196-202.557. Heller V.G. (1932). Saline and alkaline drinking waters. J Nutr 5:421-429.558. Weeth H.J. and Haverland L.H. (1961). Tolerance of growing cattle <strong>for</strong> drinking water containing sodiumchloride. J Anim Sci 20:518-521.559. Croom J. WJ, Harvey R.W., Linnerud A.C. and Froetschel M. (1982). High levels of sodium chloride in beefcattle diets. Can J Anim Sci 62:217-227.560. Amaral D.M., Croom J. WJ, Rakes A.H., Leonard E.S. and Linnerud A.C. (1985). Increased concentrationof sodium chloride on milk production of cows fed low fiber diets. J Dairy Sci 68:2940-2947.561. Nestor K.E., Hemken R.W. and Harmon R.J. (1988). Influence of sodium chloride and potassiumbicarbonate on udder edema and selected blood parameters. J Dairy Sci 71:366-372.562. Potter B.J. and McIntosh G.H. (1974). Effect of salt water ingestion on pregnancy in the ewe and on lambsurvival. Aust J Agric Res 25:909-917.563. Wilson A.D. (1967). Observations on the adaptation by sheep to saline drinking water. Aust J Exper AgricAnim Husbandry 7:321-324.564. Hamilton J.A. and Webster M.E.D. (1987). Food intake, water intake, urine output, growth rate and woolgrowth of lambs accustomed to high or low intake of sodium chloride. Aust J Agric Res 38:187-194.565. Heller V.G. (1933). The effect of saline and alkaline waters on domestic animals. Oklahoma Agric Exp StaBull 217:4-23.566. Sapirstein L.A., Brandt W.L. and Drury D.R. (1950). Production of hypertension in the rat by substitutinghypertonic sodium chloride solutions <strong>for</strong> drinking water. Proc Soc Exp Biol Med 73:82-85.88
567. Koletsky S. (1959). Role of salt and renal mass in experimental hypertension. Arch Pathol 68:11-22.568. Koletsky S. (1958). Hypertensive vascular disease produced by salt. Lab Invest 7:377-386.569. Boyd E.M., Abel M.M. and Knight L.M. (1966). The chronic oral toxicity of sodium chloride at the range ofthe LD50 (0.1L). Can J Physiol Pharmacol 44:157-172.570. Rossi R., Del Prete E., Rokitzky J. and Scharrer E. (1998). Effects of a high NaCl diet on eating and drinkingpatterns in pygmy goats. Physiol Behav 63:601-604.571. Medway W. and Kare M.R. (1959). The mechanism of toxicity associated with an excessive intake of sodiumchloride. Cornell Vet 49:241-251.572. Lames H.S. (1968). Salt poisoning in swine (water deprivation syndrome). Vet Med Small Anim Clin63:882-883.573. Gudmundson J. and Meagher D.M. (1961). Sodium salt poisoning in swine. Can Vet J 2:115-116.574. Weeth H.J. and Hunter J.E. (1971). Drinking of sulfate-water by cattle. J Anim Sci 32:277-281.575. Peirce A.W. (1960). Studies on salt tolerance of sheep. III. The tolerance of sheep <strong>for</strong> mixtures of sodiumchloride and sodium sulfate in the drinking water. Aust J Agric Res 11:548-556.576. Peirce A.W. (1962). Studies on salt tolerance of sheep. IV. The tolerance of sheep <strong>for</strong> mixtures of sodiumchloride and calcium chloride in the drinking water. Aust J Agric Res 13:479-486.577. Peirce A.W. (1966). Studies on salt tolerance of sheep. VI. The tolerance of wethers in pens <strong>for</strong> drinkingwaters of the types obtained from underground sources in Australia. Aust J Agric Res 17:209-218.578. Peirce A.W. (1959). Studies on salt tolerance of sheep. II. The tolerance of sheep <strong>for</strong> mixtures of sodiumchloride and magnesium chloride in the drinking water. Aust J Agric Res 10:725-735.579. Peirce A.W. (1963). Studies on salt tolerance of sheep. V. The tolerance of sheep <strong>for</strong> mixtures of sodiumchloride, sodium carbonate, and sodium bicarbonate in the drinking water. Aust J Agric Res 14:815-823.580. Potter B.J., Walker D.J. and Forrest W.W. (1972). Changes in intraruminal function of sheep when drinkingsaline water. Br J Nutr 27:75-83.581. Meyer J.H. and Weir W.C. (1954). The tolerance of sheep to high intakes of sodium chloride. J Anim Sci13:443-449.582. Berg R.T. and Bowland J.P. (1960). Salt water tolerance of growing-finishing swine. Feeder’s Day Report -Univ. of Albert, Edmonton 39:14-16.583. Thompson L.J. (2007). Sodium chloride. pp. 461-464 in Veterinary Toxicology - Basic and ClinicalPrinciples (Gupta R.C., ed.). Elsevier, New York, NY.584. Mathieu L.G. and Pelletier R.P. (1966). A study of the oral toxicity of calcium chloride in dairy cows. Can JComp Med Vet Sci 30:35-39.89
585. Digesti R.D. and Weeth H.J. (1976). A defensible maximum <strong>for</strong> inorganic sulfate in drinking water of cattle.J Anim Sci 42:1498-1502.586. Heller V.G. and Larwood C.H. (1930). Saline drinking water. Science 71:223-224.587. Fleck M. and Shurson G.C. (1992). Effects of sulfate in drinking water <strong>for</strong> livestock. J Am Vet Med Assoc201:487-492.588. Gould D.H., Dargatz D.A., Garry F.B., Hamar D.W. and Ross P.F. (2002). Potentially hazardous sulfurconditions on beef cattle ranches in the United States. J Am Vet Med Assoc 221:673-677.589. National Research Council (2005). Sulfur. pp. 372-385 in Mineral Tolerance of Animals. NationalAcademies Press, Washington, D.C.590. Chalupa W., Oltjen R.R., Slyter L.L. and Dinius D.A. (1971). Sulfur deficiency and tolerance in bull calves.J Anim Sci 33:278.591. Bouchard R. and Conrad H.R. (1974). Sulfur metabolism and nutritional changes in lactating cowsassociated with supplemental sulfate and methionine hydroxy analog. Can J Anim Sci 54:587-593.592. Johnson W.H., Goodrich R.D. and Meiske J.C. (1971). Metabolism of radioactive sulfur from elementalsulfur, sodium sulfate, and methionine by lambs. J Anim Sci 32:778-783.593. Block R.J. and Stekol J.A. (1950). Synthesis of sulfur amino acids from inorganic sulfate by ruminants. ProcSoc Exp Biol Med 73:391-394.594. Albert W.W., Garrigus U.S., Forbes R.M. and Norton H.W. (1956). The sulfur requirement of growingfatteninglambs in terms of methionine, sodium sulfate and elemental sulfur. J Anim Sci 15:559-569.595. Anderson C.M. (1956). The metabolism of sulphur in the rumen of the sheep. N Z J Sci Technol37:379-394.596. Halverson A.W., Williams G.D. and Paulson G.D. (1968). Aspects of sulfate utilization by themicroorganisms of the ovine rumen. J Nutr 95:363-368.597. Loneragan G.H., Gould D.H., Wagner J.J., Garry F.B. and Thoren M. (1997). The effect of varying watersulfate content on H 2S generation and health of feedlot cattle. J Anim Sci 75 (Supplement 1):272.598. Dougherty R.W., Mullenax C.H. and Allison M.J. (1965). Physiological phenomena associated witheructation in ruminants. pp. 159-170 in Physiology of Digestion in the Ruminant (Dougherty R.W., ed.).Butterworths Inc., Washington, D.C.599. Evans C.L. (1967). The toxicity of hydrogen sulphide and other sulphides. Q J Exp Physiol 52:231-248.600. McAllister M.M., Gould D.H. and Hamar D.W. (1992). Sulphide-induced polioencephalomalacia in lambs.J Comp Pathol 106:267-278.601. Gould D.H., McAllister M.M., Savage J.C. and Hamar D.W. (1991). High sulfide concentrations in rumenfluid associated with nutritionally induced polioencephalomalacia in calves. Am J Vet Res 52:1164-1169.90
602. Gooneratne S.R., Olkowski A.A., Klemmer R.G., Kessler G.A. and Christensen D.A. (1989). High sulfurrelated thiamine deficiency in cattle: A field study. Can Vet J 30:139-146.603. Krasicka B., Gralak M.A., Sieranska B. and Kulasek G. (1999). The influence of dietary sulphur loading onmetabolism and health in young sheep fed low fibre and high starch diet. Reprod Nutr Dev 39:625-636.604. Suttle N.F. (1974). Effects of organic and inorganic sulfur on the availability of dietary copper to sheep. Br JNutr 32:559-568.605. Gould D.H. (2000). Update on sulfur-related polioencephalomalacia. Vet Clin North Am Food Anim Pract16:481-496.606. Smart M.E., Cohen R., Christensen D.A. and Williams C.M. (1986). The effects of sulphate removal fromthe drinking water on the plasma and liver and copper and zinc concentrations of beef cows and their calves.Can J Anim Sci 66:669-680.607. Ivancic J. J and Weiss W.P. (2001). Effect of dietary sulfur and selenium concentrations on selenium balanceof lactating Holstein cows. J Dairy Sci 84:225-232.608. Cummings B.A., Gould D.H., Caldwell D.R. and Hamar D.W. (1995). Ruminal microbial alterationsassociated with sulfide generation in steers with dietary sulfate-induced polioencephalomalacia. Am J Vet Res56:1390-1395.609. Corke M.J. (1981). An outbreak of sulphur poisoning in horses. Vet Rec 109:212-213.610. Paterson D.W., Wahlstrom R.C., Libal G.W. and Olson O.E. (1979). Effects of sulfate in water on swinereproduction and young pig per<strong>for</strong>mance. J Anim Sci 49:664-667.611. Veenhuizen M.F., Shurson G.C. and Kohler E.M. (1992). Effect of concentration and source of sulfate onnursery pig per<strong>for</strong>mance and health. J Am Vet Med Assoc 201:1203-1208.612. Gomez G.G., Sandler R.S. and Seal J. E (1995). High levels of inorganic sulfate cause diarrhea in neonatalpiglets. J Nutr 125:2325-2332.613. Olkowski A.A. (1997). Neurotoxicity and secondary metabolic problems associated with low to moderatelevels of exposure to excess dietary sulphur in ruminants: A review. Vet Hum Toxicol 39:355-360.614. Loneragan G.H., Wagner J.J., Gould D.H., Garry F.B. and Thoren M.A. (2001). Effects of water sulfateconcentration on per<strong>for</strong>mance, water intake, and carcass characteristics of feedlot steers. J Anim Sci79:2941-2948.615. Sadler W.C., Mahoney J.H., Puch H.C., Williams D.L. and Hodge D.E. (1983). Relationship betweensulfate and polioencephalomalacia in cattle. J Anim Sci 57 (Supplement 1):467.616. Zinn R.A., Alvarez E., Mendez M., Montano M., Ramirez E. and Shen Y. (1997). Influence of dietary sulfurlevel on growth per<strong>for</strong>mance and digestive function in feedlot cattle. J Anim Sci 75:1723-1728.617. Weeth H.J. and Capps D.L. (1972). Tolerance of growing cattle <strong>for</strong> sulfate-water. J Anim Sci 34:256-260.91
618. Patterson H.H., Johnson P.S., Patterson T.R., Young D.B. and Haigh R. (2002). Effects of water quality onper<strong>for</strong>mance and health of growing steers. Proceedings, Western Section, American Society of Animal Science53:217-220.619. Harper G.S., King T.J., Hill B.D., Harper C.M.L. and Hunter R.A. (1997). Effect of coal mine pit water onthe productivity of cattle. II. Effect of increasing concentrations of pit water on feed intake and health. Aust JAgric Res 48:155-164.620. Johnson W.H., Meiske J.C. and Goodrich R.D. (1968). Influence of high levels of two <strong>for</strong>ms of sulfate onlambs. J Anim Sci 27:1166.621. Khan A.A., Lovejoy D., Sharma A.K., Sharma R.M., Prior M.G. and Lillie L.E. (1987). Effects of highdietary sulphur on enzyme activities, selenium concentrations and body weight of cattle. Can J Vet Res51:174-180.622. Rumsey T.S. (1978). Effects of dietary sulfur addition and synovex-s ear implants on feedlot steers fed an allconcentratefinishing diet. J Anim Sci 46:463-477.623. Qi K., Lu C.D. and Owens F.N. (1993). Sulfate supplementation of growing goats: Effects on per<strong>for</strong>mance,acid-base balance, and nutrient digestibilities. J Anim Sci 71:1579-1587.624. Pendlum L.C., Boling J.A. and Bradley N.W. (1976). Plasma and ruminal constituents and per<strong>for</strong>mance ofsteers fed different nitrogen sources and levels of sulfur. J Anim Sci 43:1307-1314.625. Bulgin M.S., Lincoln S.D. and Mather G. (1996). Elemental sulfur toxicosis in a flock of sheep. J Am VetMed Assoc 208:1063-1065.626. Patterson H.H., Johnson P.S. and Epperson W.B. (2003). Effect of total dissolved solids and sulfates indrinking water <strong>for</strong> growing steers. Proceedings, Western Section, American Society of Animal Science 54:.627. Hamlen H., Clark E. and Janzen E. (1993). Polioencephalomalacia in cattle consuming water with elevatedsodium sulfate levels: A herd investigation. Can Vet J 34:153-158.628. Raisbeck M.F. (1982). Is polioencephalomalacia associated with high-sulfate diets? J Am Vet Med Assoc180:1303-1305.629. Ward E.H. and Patterson H.H. (2004). Effects of thiamin supplementation on per<strong>for</strong>mance and health ofgrowing steers consuming high sulfate water. Proceedings, Western Section, American Society of AnimalScience 55:375-378.630. Harries W.N. (1987). Polioencephalomalacia in feedlot cattle drinking water high in sodium sulfate. Can VetJ 28:717.631. Beke G.J. and Hironaka R. (1991). Toxicity to beef cattle of sulfur in saline well water: A case study. SciTotal Environ 101:281-290.632. Niles G.A., Morgan S., Edwards W.C. and Lalman D. (2002). Effects of dietary sulfur concentrations on theincidence and pathology of polioencephalomalacia in weaned beef calves. Vet Hum Toxicol 44:70-72.92
633. McAllister M.M., Gould D.H., Raisbeck M.F., Cummings B.A. and Loneragan G.H. (1997). Evaluation ofruminal sulfide concentrations and seasonal outbreaks of polioencephalomalacia in beef cattle in a feedlot. JAm Vet Med Assoc 211:1275-1279.634. Haydock D. (2003). Sulfur-induced polioencephalomalacia in a herd of rotationally grazed beef cattle. CanVet J 44:828-829.635. Wobeser G. and Runge W. (1979). Polioencephalomalacia in white-tailed deer (Odocoileus virginianus) inSaskatchewan. Can Vet J 20:323-325.636. Wobeser G., Daoust P.Y. and Hunt H.M. (1983). Polioencephalomalacia-like disease in pronghorns(Antilocapra americana). J Wildl Dis 19:248-252.637. Wobeser G. (2006). Personal communication. Professor of Veterinary Toxicology, University of Saskatchewan.638. Hamilton J.W. and Gilbert C.S. (1972). Composition of <strong>Wyoming</strong> range plants and soils. Univ Wyo AgrExper Sta Res J 55:1-14.639. Olkowski A.A., Rousseaux C.G. and Christensen D.A. (1991). Association of sulfate-water and bloodthiamine concentration in beef cattle: Field studies. Can J Anim Sci 71:825-832.640. Wagner J.J., Loneragan G.H., Gould D.H. and Thoren M. (1997). The effect of varying water sulfateconcentration on feedyard per<strong>for</strong>mance and water intake of steers. J Anim Sci 75 (Supplement 1):272.641. Monarca S., Donato F., Zerbini I., Calderon R.L. and Craun G.F. (2006). Review of epidemiological studieson drinking water hardness and cardiovascular diseases. Eur J Cardiovasc Prev Rehabil 13:495-506.642. Burton A.C. and Cornhill J.F. (1977). Correlation of cancer death rates with altitude and with the quality ofwater supply of the 100 largest cities in the United States. J Toxicol Environ Health 3:465-478.643. Schroeder H.A. (1960). Relation between mortality from cardiovascular disease and treated water supplies. JAm Med Assoc 172:1902-1908.644. Craun G.F. and McCabe L.J. (1975). Problems associated with metals in drinking water. J Am <strong>Water</strong> WorksAssoc 67:593-599.645. Sauvant M.-P. and Pepin D. (2002). Drinking water and cardiovascular disease. Food Chem Toxicol40:1311-1325.646. CBC News (2007). <strong>Water</strong> drinking contest blamed in death of Cali<strong>for</strong>nia woman. www.cbc.ca/world/story/2007/01/14/water-intoxication.html, accessed 2/2/2007.647. Weeth H.J., Haverland L.H. and Cassard D.W. (1960). Consumption of sodium chloride water by heifers. JAnim Sci 19:845-851.648. Moule G.R. (1945). Salt poisoning of sheep following evaporation of saline waters. Aust Vet J 21:37.649. World Health Organization (2007). Total dissolved solids in drinking water. in Guidelines <strong>for</strong> Drinking<strong>Water</strong> <strong>Quality</strong>. World Health Organization, Geneva.93
650. Ray D.E. (1989). Interrelationships among water quality, climate and diet on feedlot per<strong>for</strong>mance of steercalves. J Anim Sci 67:357-363.651. Saul G.R. and Flinn P.C. (1985). Effects of saline drinking water on growth and water and feed intakes ofweaner heifers. Aust J Exp Agric 25:734-738.652. Challis D.J., Zeinstra J.S. and Anderson M.J. (1987). Some effects of water quality on the per<strong>for</strong>mance ofhigh yielding cows in an arid climate. Vet Rec 120:12-15.653. Ray D.E. (1986). Limiting the effects of stress on cattle. <strong>Water</strong>. Utah Agric Exp Sta Bull 512:17-26.654. Solomon R., Miron J., Ben-Ghedalia D. and Zomberg Z. (1995). Per<strong>for</strong>mance of high producing dairy cowsoffered drinking water of high and low salinity in the Arava Desert. J Dairy Sci 78:620-624.655. Wegner T.N. and Schuh J.P. (1988). Effect of water quality and season on milk production and watermetabolism in Holstein cows. J Dairy Sci 71 (supplement 1):185.656. Peirce A.W. (1968). Studies on salt tolerance of sheep. VII. The tolerance of ewes and their lambs in pens <strong>for</strong>drinking waters of the types obtained from underground sources in Australia. Aust J Agric Res 19:577-587.657. Ahmed M.H., Farid M.F.A., Shawket S.M. and Hassan N.I. (1989). Effects of water deprivation on feedutilization and mineral balances in sheep drinking natural saline well water. J Arid Environ 16:323-329.658. Ramsay A.A. (1924). <strong>Water</strong>s suitable <strong>for</strong> live stock. Analyses and experiences in New South Wales. Agric GazN S W 35:339-342.659. Kii W.Y. and Dryden G.M. (2005). Effect of drinking saline water on food and water intake, fooddigestibility, and nitrogen and mineral balances of rusa deer stags (Cervus timorensis russa). Anim Sci81:99-105.660. Ru Y.J., Glatz P.C. and Bao Y.M. (2005). Effect of salt level in water on feed intake and growth rate of redand fallow weaner deer. Asian-Australasian Journal of Animal Sciences 18:32-37.661. National Research Council (1974). Nutrients and toxic substances in water <strong>for</strong> livestock and poultry, 1st ed.National Academy of Sciences, Washington, D.C.662. Idaho Mining Association (1998). Interim surface water survey report. Table 3-3. Montgomery Watson,Belleview, WA.663. Chapman P.M., Baley H. and Canaria E. (2000). Toxicity of total dissolved solids associated with two mineeffluents to chironomid larvae and early life stages of rainbow trout. Environ Toxicol Chem 19:210-214.94