Russian Journal of Agricultural and Socio-Economic Sciences ...
Russian Journal of Agricultural and Socio-Economic Sciences ...
Russian Journal of Agricultural and Socio-Economic Sciences ...
Create successful ePaper yourself
Turn your PDF publications into a flip-book with our unique Google optimized e-Paper software.
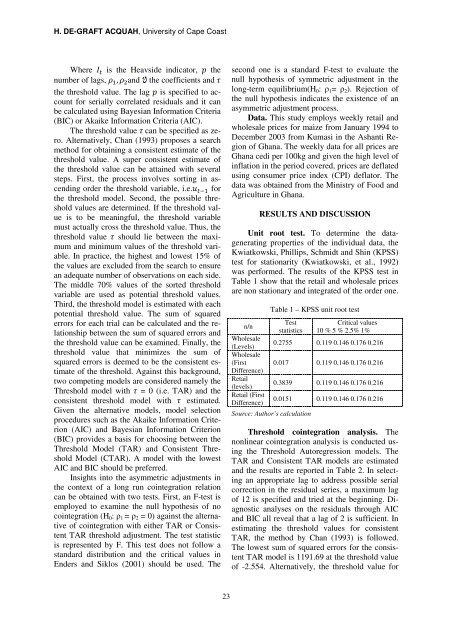
H. DE-GRAFT ACQUAH, University <strong>of</strong> Cape CoastWhere 7 is the Heavside indicator, ; thenumber <strong>of</strong> lags, 3 3 <strong>and</strong> the coefficients <strong>and</strong> :the threshold value. The lag ; is specified to accountfor serially correlated residuals <strong>and</strong> it canbe calculated using Bayesian Information Criteria(BIC) or Akaike Information Criteria (AIC).The threshold value :can be specified as zero.Alternatively, Chan (1993) proposes a searchmethod for obtaining a consistent estimate <strong>of</strong> thethreshold value. A super consistent estimate <strong>of</strong>the threshold value can be attained with severalsteps. First, the process involves sorting in ascendingorder the threshold variable, i.e. forthe threshold model. Second, the possible thresholdvalues are determined. If the threshold valueis to be meaningful, the threshold variablemust actually cross the threshold value. Thus, thethreshold value : should lie between the maximum<strong>and</strong> minimum values <strong>of</strong> the threshold variable.In practice, the highest <strong>and</strong> lowest 15% <strong>of</strong>the values are excluded from the search to ensurean adequate number <strong>of</strong> observations on each side.The middle 70% values <strong>of</strong> the sorted thresholdvariable are used as potential threshold values.Third, the threshold model is estimated with eachpotential threshold value. The sum <strong>of</strong> squarederrors for each trial can be calculated <strong>and</strong> the relationshipbetween the sum <strong>of</strong> squared errors <strong>and</strong>the threshold value can be examined. Finally, thethreshold value that minimizes the sum <strong>of</strong>squared errors is deemed to be the consistent estimate<strong>of</strong> the threshold. Against this background,two competing models are considered namely theThreshold model with : = 0 (i.e. TAR) <strong>and</strong> theconsistent threshold model with : estimated.Given the alternative models, model selectionprocedures such as the Akaike Information Criterion(AIC) <strong>and</strong> Bayesian Information Criterion(BIC) provides a basis for choosing between theThreshold Model (TAR) <strong>and</strong> Consistent ThresholdModel (CTAR). A model with the lowestAIC <strong>and</strong> BIC should be preferred.Insights into the asymmetric adjustments inthe context <strong>of</strong> a long run cointegration relationcan be obtained with two tests. First, an F-test isemployed to examine the null hypothesis <strong>of</strong> nocointegration (H 0 : 1 = 2 = 0) against the alternative<strong>of</strong> cointegration with either TAR or ConsistentTAR threshold adjustment. The test statisticis represented by F. This test does not follow ast<strong>and</strong>ard distribution <strong>and</strong> the critical values inEnders <strong>and</strong> Siklos (2001) should be used. Thesecond one is a st<strong>and</strong>ard F-test to evaluate thenull hypothesis <strong>of</strong> symmetric adjustment in thelong-term equilibrium(H 0 : 1 = 2 ). Rejection <strong>of</strong>the null hypothesis indicates the existence <strong>of</strong> anasymmetric adjustment process.Data. This study employs weekly retail <strong>and</strong>wholesale prices for maize from January 1994 toDecember 2003 from Kumasi in the Ashanti Region<strong>of</strong> Ghana. The weekly data for all prices areGhana cedi per 100kg <strong>and</strong> given the high level <strong>of</strong>inflation in the period covered, prices are deflatedusing consumer price index (CPI) deflator. Thedata was obtained from the Ministry <strong>of</strong> Food <strong>and</strong>Agriculture in Ghana.RESULTS AND DISCUSSIONUnit root test. To determine the datageneratingproperties <strong>of</strong> the individual data, theKwiatkowski, Phillips, Schmidt <strong>and</strong> Shin (KPSS)test for stationarity (Kwiatkowski, et al., 1992)was performed. The results <strong>of</strong> the KPSS test inTable 1 show that the retail <strong>and</strong> wholesale pricesare non stationary <strong>and</strong> integrated <strong>of</strong> the order one.n/nWholesale(Levels)Wholesale(FirstDifference)Retail(levels)Retail (FirstDifference)Table 1 – KPSS unit root testTeststatisticsSource: Author’s calculationCritical values10 % 5 % 2.5% 1%0.2755 0.119 0.146 0.176 0.2160.017 0.119 0.146 0.176 0.2160.3839 0.119 0.146 0.176 0.2160.0151 0.119 0.146 0.176 0.216Threshold cointegration analysis. Thenonlinear cointegration analysis is conducted usingthe Threshold Autoregression models. TheTAR <strong>and</strong> Consistent TAR models are estimated<strong>and</strong> the results are reported in Table 2. In selectingan appropriate lag to address possible serialcorrection in the residual series, a maximum lag<strong>of</strong> 12 is specified <strong>and</strong> tried at the beginning. Diagnosticanalyses on the residuals through AIC<strong>and</strong> BIC all reveal that a lag <strong>of</strong> 2 is sufficient. Inestimating the threshold values for consistentTAR, the method by Chan (1993) is followed.The lowest sum <strong>of</strong> squared errors for the consistentTAR model is 1191.69 at the threshold value<strong>of</strong> -2.554. Alternatively, the threshold value for23


