AP1-4 - Society of Wood Science and Technology
AP1-4 - Society of Wood Science and Technology
AP1-4 - Society of Wood Science and Technology
You also want an ePaper? Increase the reach of your titles
YUMPU automatically turns print PDFs into web optimized ePapers that Google loves.
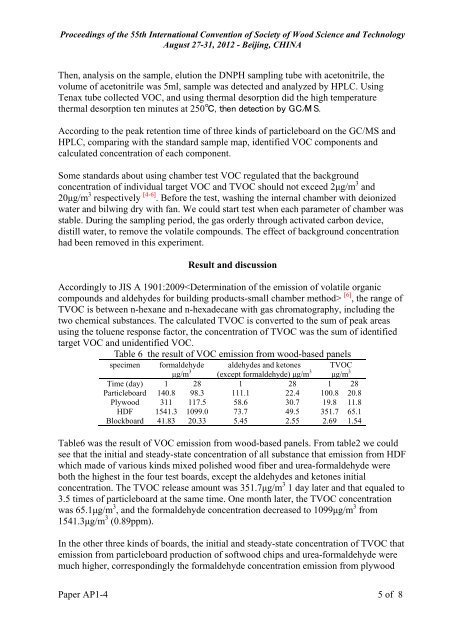
Proceedings <strong>of</strong> the 55th International Convention <strong>of</strong> <strong>Society</strong> <strong>of</strong> <strong>Wood</strong> <strong>Science</strong> <strong>and</strong> <strong>Technology</strong>August 27-31, 2012 - Beijing, CHINAThen, analysis on the sample, elution the DNPH sampling tube with acetonitrile, thevolume <strong>of</strong> acetonitrile was 5ml, sample was detected <strong>and</strong> analyzed by HPLC. UsingTenax tube collected VOC, <strong>and</strong> using thermal desorption did the high temperaturethermal desorption ten minutes at 250℃, then detection by GC/M S.According to the peak retention time <strong>of</strong> three kinds <strong>of</strong> particleboard on the GC/MS <strong>and</strong>HPLC, comparing with the st<strong>and</strong>ard sample map, identified VOC components <strong>and</strong>calculated concentration <strong>of</strong> each component.Some st<strong>and</strong>ards about using chamber test VOC regulated that the backgroundconcentration <strong>of</strong> individual target VOC <strong>and</strong> TVOC should not exceed 2μg/m 3 <strong>and</strong>20μg/m 3 respectively [4-6] . Before the test, washing the internal chamber with deionizedwater <strong>and</strong> bilwing dry with fan. We could start test when each parameter <strong>of</strong> chamber wasstable. During the sampling period, the gas orderly through activated carbon device,distill water, to remove the volatile compounds. The effect <strong>of</strong> background concentrationhad been removed in this experiment.Result <strong>and</strong> discussionAccordingly to JIS A 1901:2009 [6] , the range <strong>of</strong>TVOC is between n-hexane <strong>and</strong> n-hexadecane with gas chromatography, including thetwo chemical substances. The calculated TVOC is converted to the sum <strong>of</strong> peak areasusing the toluene response factor, the concentration <strong>of</strong> TVOC was the sum <strong>of</strong> identifiedtarget VOC <strong>and</strong> unidentified VOC.Table 6 the result <strong>of</strong> VOC emission from wood-based panelsspecimen formaldehydeμg/m 3aldehydes <strong>and</strong> ketones(except formaldehyde) μg/m 3TVOCμg/m 3Time (day) 1 28 1 28 1 28Particleboard 140.8 98.3 111.1 22.4 100.8 20.8Plywood 311 117.5 58.6 30.7 19.8 11.8HDF 1541.3 1099.0 73.7 49.5 351.7 65.1Blockboard 41.83 20.33 5.45 2.55 2.69 1.54Table6 was the result <strong>of</strong> VOC emission from wood-based panels. From table2 we couldsee that the initial <strong>and</strong> steady-state concentration <strong>of</strong> all substance that emission from HDFwhich made <strong>of</strong> various kinds mixed polished wood fiber <strong>and</strong> urea-formaldehyde wereboth the highest in the four test boards, except the aldehydes <strong>and</strong> ketones initialconcentration. The TVOC release amount was 351.7μg/m 3 1 day later <strong>and</strong> that equaled to3.5 times <strong>of</strong> particleboard at the same time. One month later, the TVOC concentrationwas 65.1μg/m 3 , <strong>and</strong> the formaldehyde concentration decreased to 1099μg/m 3 from1541.3μg/m 3 (0.89ppm).In the other three kinds <strong>of</strong> boards, the initial <strong>and</strong> steady-state concentration <strong>of</strong> TVOC thatemission from particleboard production <strong>of</strong> s<strong>of</strong>twood chips <strong>and</strong> urea-formaldehyde weremuch higher, correspondingly the formaldehyde concentration emission from plywoodPaper <strong>AP1</strong>-4 5 <strong>of</strong> 8


