CAE-ECM system for electrochemical technology of parts and tools
CAE-ECM system for electrochemical technology of parts and tools
CAE-ECM system for electrochemical technology of parts and tools

You also want an ePaper? Increase the reach of your titles
YUMPU automatically turns print PDFs into web optimized ePapers that Google loves.
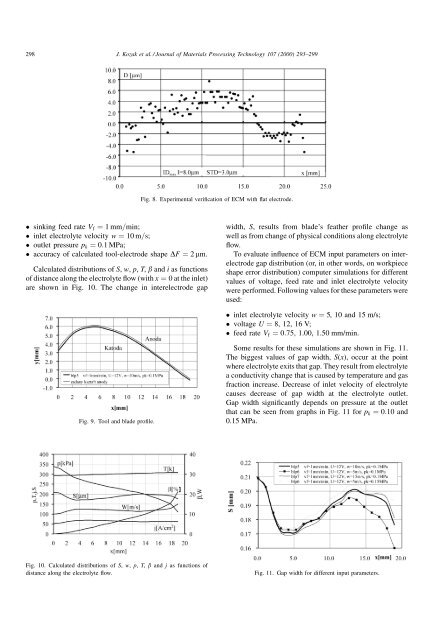
298 J. Kozak et al. / Journal <strong>of</strong> Materials Processing Technology 107 (2000) 293±299Fig. 8. Experimental veri®cation <strong>of</strong> <strong>ECM</strong> with ¯at electrode. sinking feed rate V f ˆ 1mm=min; inlet electrolyte velocity w ˆ 10 m=s; outlet pressure p k ˆ 0:1 MPa; accuracy <strong>of</strong> calculated tool-electrode shape DF ˆ 2 mm.Calculated distributions <strong>of</strong> S, w, p, T, b <strong>and</strong> i as functions<strong>of</strong> distance along the electrolyte ¯ow (with x ˆ 0 at the inlet)are shown in Fig. 10. The change in interelectrode gapwidth, S, results from blade's feather pro®le change aswell as from change <strong>of</strong> physical conditions along electrolyte¯ow.To evaluate in¯uence <strong>of</strong> <strong>ECM</strong> input parameters on interelectrodegap distribution (or, in other words, on workpieceshape error distribution) computer simulations <strong>for</strong> differentvalues <strong>of</strong> voltage, feed rate <strong>and</strong> inlet electrolyte velocitywere per<strong>for</strong>med. Following values <strong>for</strong> these parameters wereused: inlet electrolyte velocity w ˆ 5, 10 <strong>and</strong> 15 m/s; voltage U ˆ 8, 12, 16 V; feed rate V f ˆ 0:75, 1.00, 1.50 mm/min.Fig. 9. Tool <strong>and</strong> blade pro®le.Some results <strong>for</strong> these simulations are shown in Fig. 11.The biggest values <strong>of</strong> gap width, S(x), occur at the pointwhere electrolyte exits that gap. They result from electrolytea conductivity change that is caused by temperature <strong>and</strong> gasfraction increase. Decrease <strong>of</strong> inlet velocity <strong>of</strong> electrolytecauses decrease <strong>of</strong> gap width at the electrolyte outlet.Gap width signi®cantly depends on pressure at the outletthat can be seen from graphs in Fig. 11 <strong>for</strong> p k ˆ 0:10 <strong>and</strong>0.15 MPa.Fig. 10. Calculated distributions <strong>of</strong> S, w, p, T, b <strong>and</strong> j as functions <strong>of</strong>distance along the electrolyte ¯ow.Fig. 11. Gap width <strong>for</strong> different input parameters.