CAE-ECM system for electrochemical technology of parts and tools
CAE-ECM system for electrochemical technology of parts and tools
CAE-ECM system for electrochemical technology of parts and tools

You also want an ePaper? Increase the reach of your titles
YUMPU automatically turns print PDFs into web optimized ePapers that Google loves.
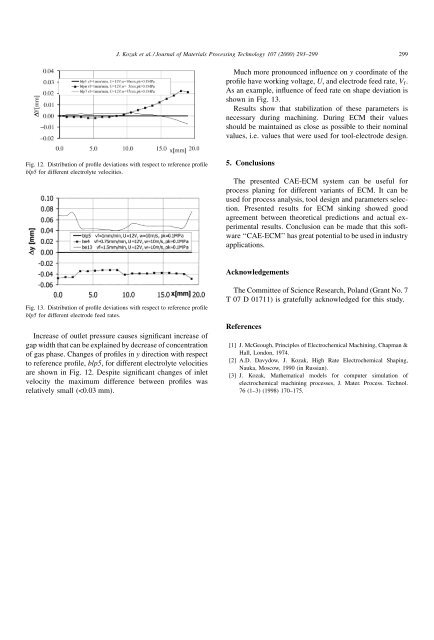
J. Kozak et al. / Journal <strong>of</strong> Materials Processing Technology 107 (2000) 293±299 299Much more pronounced in¯uence on y coordinate <strong>of</strong> thepro®le have working voltage, U, <strong>and</strong> electrode feed rate, V f .As an example, in¯uence <strong>of</strong> feed rate on shape deviation isshown in Fig. 13.Results show that stabilization <strong>of</strong> these parameters isnecessary during machining. During <strong>ECM</strong> their valuesshould be maintained as close as possible to their nominalvalues, i.e. values that were used <strong>for</strong> tool-electrode design.Fig. 12. Distribution <strong>of</strong> pro®le deviations with respect to reference pro®leblp5 <strong>for</strong> different electrolyte velocities.5. ConclusionsThe presented <strong>CAE</strong>-<strong>ECM</strong> <strong>system</strong> can be useful <strong>for</strong>process planing <strong>for</strong> different variants <strong>of</strong> <strong>ECM</strong>. It can beused <strong>for</strong> process analysis, tool design <strong>and</strong> parameters selection.Presented results <strong>for</strong> <strong>ECM</strong> sinking showed goodagreement between theoretical predictions <strong>and</strong> actual experimentalresults. Conclusion can be made that this s<strong>of</strong>tware``<strong>CAE</strong>-<strong>ECM</strong>'' has great potential to be used in industryapplications.AcknowledgementsFig. 13. Distribution <strong>of</strong> pro®le deviations with respect to reference pro®leblp5 <strong>for</strong> different electrode feed rates.Increase <strong>of</strong> outlet pressure causes signi®cant increase <strong>of</strong>gap width that can be explained by decrease <strong>of</strong> concentration<strong>of</strong> gas phase. Changes <strong>of</strong> pro®les in y direction with respectto reference pro®le, blp5, <strong>for</strong> different electrolyte velocitiesare shown in Fig. 12. Despite signi®cant changes <strong>of</strong> inletvelocity the maximum difference between pro®les wasrelatively small (