centralised system for road accident, safety and hazard studies (crash)
centralised system for road accident, safety and hazard studies (crash)
centralised system for road accident, safety and hazard studies (crash)

You also want an ePaper? Increase the reach of your titles
YUMPU automatically turns print PDFs into web optimized ePapers that Google loves.
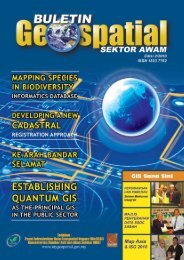
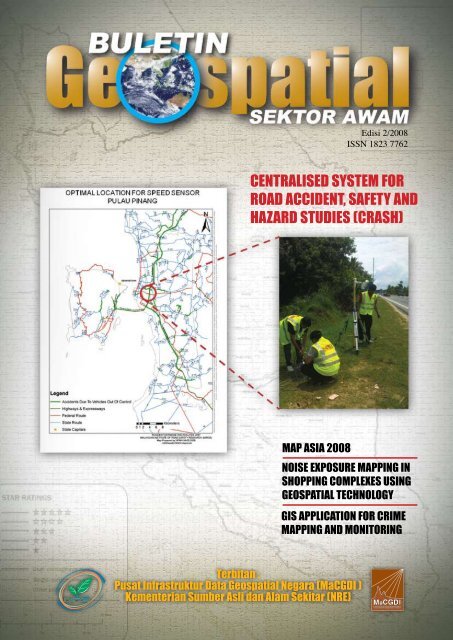
Edisi 2/2008ISSN 1823 7762CENTRALISED SYSTEM FORROAD ACCIDENT, SAFETY ANDHAZARD STUDIES (CRASH)MAP ASIA 2008NOISE EXPOSURE MAPPING INSHOPPING COMPLEXES USINGGEOSPATIAL TECHNOLOGYGIS APPLICATION FOR CRIMEMAPPING AND MONITORINGTerbitan :Pusat Infrastruktur Data Geospatial Negara (MaCGDI )Kementerian Sumber Asli dan Alam Sekitar (NRE)Buletin Geospatial Sektor Awam 1
KANDUNGANKajian Penentuan Lokasi Memorial ParkMenggunakan Aplikasi GIS (PerkuburanIslam)High Resolution Image For ForestClassificationLhdnm Pilot Geographical In<strong>for</strong>mationSystem (GIS)Detecting And Mapping Of Langat RiverAnd Its Tributaries Using Remote SensingGIS SANA SINIPersidangan dan Pameran AntarabangsaMAP ASIA 2007,di Kuala Lumpur Convention Centre(KLCC), Kuala Lumpur pada14 hingga 16 Ogos 2007Galeri Foto1914192731DARI MEJA KETUA EDITORAssalamualaikum dan Salam Sejahtera,Setelah genap 50 tahun kita merdeka, pelbagai kemajuan danpembangunan yang telah kita capai. Begitu juga dengan perkembanganGeographic In<strong>for</strong>mation System (GIS) di sektor awam. GIS sekarangmenjadi salah satu mekanisma dalam penyelesaian tugasan harian.Pemangkin kepada pembangunan dan kemajuan GIS adalah denganadanya Pusat Infrastruktur Data Geospatial Negara (MaCGDI).Infrastruktur maklumat geospatial negara telah dibangunkan bagimenyediakan perkhidmatan dan kemudahan ke arah penyebaran,perkongsian, penggunaan dan pengurusan maklumat geospatial dikalangan agensi-agensi sektor awam.Seiring dengan kemajuan tersebut MaCGDI juga menekankan akankepentingan dalam pendidikan GIS. Jika dilihat dari realiti semasa,bidang GIS masih bukan menjadi satu bidang pilihan utama di kalanganpelajar ketika melanjutkan pelajaran di institusi-institusi pengajiantinggi, tidak seperti bidang-bidang lain yang lebih ‘glamor’ sepertikedoktoran, undang-undang, perakaunan, dan sebagainya. Masih ramailagi yang tidak menyedari wujudnya bidang GIS dan peranannya didalam pembangunan tamadun manusia walaupun bidang berkaitanpemetaan bumi adalah di antara profesion tertua di dunia. Selaras denganitu, adalah menjadi misi kami di MaCGDI untuk ‘mempopularkan’penggunaan GIS di dalam setiap aktiviti berkaitan pembangunan danmenerap ’kepercayaan’ bahawa GIS merupakan satu elemen pentingdi dalam pembangunan sesebuah negara. MaCGDI juga menyedaribahawa komuniti GIS di Malaysia masih lagi kecil dan dengan itu adalahmenjadi satu cabaran bagi MaCGDI untuk membina satu komuniti GISyang lebih besar, berdaya saing, berinovasi dan berperanan di dalamkemakmuran negara.Sejarah GIS bermula kira-kira 15,500 tahun yang lampau dengan hanyalakaran-lakaran dan maklumat yang dilukis di dinding gua. Sejajardengan perkembangan tamadun manusia, evolusi GIS mula berkembanghingga ke era perkomputeran pada masa kini. Kini,Akhir sekali diharap artikel yang dipaparkan pada kali ini akan memberiilmu yang berguna kepada para pembaca mengenai perkembangan GISsektor awam di Malaysia. Selamat membaca!SIDANG PENGARANGPenaungY.B. Dato’ Seri Azmi bin KhalidMenteri Sumber Asli dan Alam SekitarPenasihatY. Bhg. Datuk Suboh bin Mohd YassinKetua SetiausahaKementerian Sumber Asli dan Alam SekitarKetua EditorFuziah binti Abu HanifahPengarahPusat Infrastruktur Data Geospatial Negara(MaCGDI)Editor Shaharudin bin Idrus - (LESTARI, UKM), Dr. Azhari bin Mohamed-JUPEM),Hamdan bin Ab. Aziz, Jawahiril Kamaliah binti Mohamad, Dr. Zainal bin A. Majeed,Anual bin Haji Aziz, Raja Abd. Aziz bin Raja Ali, Mariyam binti Mohamad, Norazmelbin Abd. Karim, Wan Faizal bin Wan MohamedRekabentuk Haji Muhammat Puzi bin Ahmat - (JUPEM), Ya’cob bin Abas, Siti Sapurabinti Rafee, Nurul Akmalina binti KhairuddinJurufoto Azlina binti MahadPenerbitPusat Infrastruktur Data Geospatial Negara (MaCGDI)Kementerian Sumber Asli dan Alam Sekitar (NRE)Aras 7 & 8, Wisma Sumber Asli,No. 25 Persiaran Perdana, Presint 4,62574 Putrajaya, Malaysia.Tel: 603 - 8886 1111 Fax: 603 - 8889 4851 web: www.mygeoportal.gov.myPenafian : Kesahihan dan ketepatan tulisan atau pendapat adalah tertakluk pada cetusan idea pengirim artikel.2 Buletin Geospatial Sektor Awam
GIS Application <strong>for</strong> CrimeMapping <strong>and</strong> Monitoring1Zahriah Othman, 1Safiza Suhana Kamal BaharinAbstractGIS is an effective crime-analysis tool <strong>for</strong> crime mapping because GIS is provenas a powerful tool in many disciplines related to geographical area. This projectdeals with the development of GIS <strong>and</strong> computer based <strong>system</strong> <strong>for</strong> police departmentto manage the community in better manner. This <strong>system</strong> will contribute in givingbeneficial <strong>for</strong> the police department to planning, analyzing <strong>and</strong> use it <strong>for</strong> crimemonitoring. Besides, it helps in managing spatial data <strong>and</strong> attribute data to bemore effective <strong>and</strong> <strong>system</strong>ic by providing spatial analysis, data query <strong>and</strong> searchcapabilities. The interfaces are more user-friendly to guide the user to underst<strong>and</strong>,visualize, build query <strong>and</strong> statistical report using spatial <strong>and</strong> non-spatial data easily.INTRODUCTIONIn crime analysis, law en<strong>for</strong>cementofficials have to take a look at a largeamount of criminal data then figure outtheir relationships themselves. The adventof desktop computers <strong>and</strong> easy-to-use GISapplications have allowed crime mapping<strong>and</strong> analysis [3] to flourish within lawen<strong>for</strong>cement agencies.In order to encourage a police departmentto efficiently safeguard a community, itis essential that officer is provided withaccurate, organized in<strong>for</strong>mation in a timelymanner. A GIS can provide a number ofspecialized tools to help dispatchers collect<strong>and</strong> relay this in<strong>for</strong>mation to the officerson the scene. This application is speciallydesigned <strong>for</strong> IPK (Ibu Pejabat PolisKontijen) staffs in crime investigationdepartment to manage their task effectivelythus switch from traditional method tofully decisions support application.OBJECTIVESThe main objective of this project is todevelop the GIS application <strong>for</strong> policedepartment. It is involves integration ofspatial in<strong>for</strong>mation <strong>and</strong> attribute data withgraphical user interface in one <strong>system</strong>.This is important to make sure the usercan grasp spatial in<strong>for</strong>mation visually byattribute data.The second objective is to assist the policedepartment officers to analyze crimepattern <strong>and</strong> to manage spatial <strong>and</strong> attributedata <strong>system</strong>atically <strong>and</strong> easily comparedto the traditional method that is very muchrelying on statistical in<strong>for</strong>mation <strong>and</strong> paperfiling <strong>system</strong>.PROBLEM STATEMENTAs known, advance in computer <strong>and</strong>in<strong>for</strong>mation technology play major rolesin many disciplines of modern businessenvironment. However, integrating GISinto crime analysis still need specialattention. Graphical User Interface(GUI) is a main factor to consider whiledeveloping the GIS application. This isbecause the use of GIS application inassisting the crime mapping <strong>and</strong> crimemonitoring could be optimized throughthe <strong>system</strong> interface which could visualizethe result of crime analysis. Besides,a good user interface design can spellthe difference between acceptance of asoftware product <strong>and</strong> its failure in themarket. If the end-users find the softwareto be too cumbersome or difficult tounderst<strong>and</strong>, then an otherwise excellentproduct could be doomed to failure.The goal is to make the software asprofessional looking <strong>and</strong> easy to use aspossible.Many technological innovations rely uponUser Interface Design to evaluate theirtechnical complexity to a usable product.Technology alone may not win useracceptance <strong>and</strong> subsequent marketability.The user experience, or how the userexperiences the end product, is the key toacceptance. Besides that, existing <strong>system</strong>has no st<strong>and</strong>ard of in<strong>for</strong>mation that storedinto a database because of no relationshipcreated in database <strong>system</strong>. As a result,the searching process could not be doneeffectively. Thus, the development ofthis project considers effective GUI withGIS visualization <strong>and</strong> data manipulationcapabilities.METHODOLOGYThe structured <strong>system</strong> analysis approachchosen as a methodology <strong>for</strong> developingthis GIS application. In this exertion,the proposed <strong>system</strong> will play a role as atool to assist in crime analysis <strong>and</strong> crimemapping <strong>for</strong> PDRM. This <strong>system</strong> is basedon a method used by US Department ofJustice [1] <strong>and</strong> WEBCAT framework[4]. WEBCAT [2] was developed togive a h<strong>and</strong> in facilitating crime incidentin<strong>for</strong>mation sharing via online <strong>system</strong>. Themethod are as follows:1. Prepare the geographic <strong>and</strong> tabularfiles <strong>for</strong> geo-coding.2. Specify the geo-coding parameters.3. Machine-learning <strong>and</strong> text analysis.4. Geo-code.5. Review results.6. If necessary, re-specify parameters<strong>and</strong> geo-code again.The purpose of using geo-coding is toassign tabular data to a location on theearth’s surface to visualize the spatialcharacteristics of the data. It is analogousto placing a pin on a map in appropriatelocation. Unlike paper map, when geocodingin a geographic in<strong>for</strong>mation<strong>system</strong>, data associated with the pin, ordata point, are available. In order to geocodeeither electronically or manually,there must be a common geographic unitof analysis. In law en<strong>for</strong>cement, addressis primarily used as the geographic unit ofanalysis to which tabular data are geocoded.However, other types of geographicunits are also used such as parcels <strong>and</strong>postcodes. In the case of geo-coding,geographic data used <strong>for</strong> geo-codingare called “reference data” since thegeographic data are used to reference thetabular data.SYSTEM MODELINGThe engine of the <strong>system</strong> is designedconsidering all possible inputs, outputs,table structure <strong>and</strong> database structure.Input Forms, Output Reports, Menu Screen<strong>and</strong> dialogues are parts of GUI design.Figure 1 shows the conceptual <strong>system</strong>architecture <strong>for</strong> this <strong>system</strong>.Buletin Geospatial Sektor Awam 3
Spatial InterfacePdRMMGatewayGatewayLEGISQuery <strong>and</strong> ResponddatabaseFigure 1: Conceptual System Architecture.The front-end of the <strong>system</strong> was designed<strong>for</strong> GUI in ColdFusion MX <strong>and</strong> MacromediaFlash MX, <strong>and</strong> <strong>for</strong> the back-end, MicrosoftAccess stored all the in<strong>for</strong>mation that arerelated to the <strong>system</strong>. This web based <strong>system</strong>used Apache as web server. The physicalimplementation of logical design is theuser interface. User interface is one of themain parts of the software. To build the userinterface, this project used ColdFusion MXas a plat<strong>for</strong>m. Figure 2 shows the navigationflow <strong>for</strong> the <strong>system</strong>. This flow shows all theinterfaces through this <strong>system</strong>. User interfaceconsists of user <strong>for</strong>ms, reports <strong>and</strong> maps.Ma in Pa ge Statistic Page Ma p PageUser have to login through the gatewayas member to use this <strong>system</strong> <strong>and</strong> isauthenticated via registered username <strong>and</strong>password. After police officer enters thecorrect username <strong>and</strong> password, page ‘Aduan’will be displayed. On this page, user has anoption to add new police report by clickingthe ‘Masukkan Aduan Baru’ option. After thisoption is selected, user has an option eitherto search the existing report or create a newreport.PoliceOfficerLogi n PageInvestigatorAfter the previous stage, investigator willtake an action. An investigator can update orinsert relevant in<strong>for</strong>mation at particular reportID. For example, after the report no R005 hasbeen created by police officer, the investigatorwill be assigned to h<strong>and</strong>le that R005 case.So, the investigator will search this file byusing the ‘Cari’ (search) function. After that,details of in<strong>for</strong>mation about case R005 willbe displayed. The investigator needs to createthe case file by entering the investigation caseID or ‘No KES’.Police ReportFormSummar y ofdaily CrimeReportFigure 2: System Navigation Flow.Location of the crime also could be mappedinto this application. Thus, police departmentcan use this in<strong>for</strong>mation to view the statisticdata (Figure 3) more clearly either attributeor spatial (Figure 4). In this research the copyof police report in<strong>for</strong>mation can be printedas personal copy. By printing the report,the complainant can easily get the detailin<strong>for</strong>mation of the report.4 Buletin Geospatial Sektor Awam
CONCLUSION AND FUTURE WORKSThis work involves the development of the<strong>system</strong>, which integrates GIS element intocrime analysis <strong>and</strong> crime mapping. This kindof research is a new approach in Malaysia,especially <strong>for</strong> law en<strong>for</strong>cement. Ongoingworks still need to be done to enable PDRMto locate <strong>and</strong> retrieve data from distributedpolice stations <strong>and</strong> departments. Besidesthat, the <strong>system</strong> should have capability toallow multiple analytical tasks such as definethe shortest path, buffering analysis, etc.Along with this development, PDRM willgain benefit from the fast <strong>and</strong> efficient crimeanalysis in terms of planning, analyzing<strong>and</strong> using it <strong>for</strong> event modeling, tactical <strong>and</strong>strategic planning.REFERENCESFigure 3: Output of Statistic Data.[1] Geocoding in Law En<strong>for</strong>cement, FinalReport. U.S Department of Justice,Office of Community Oriented PolicingServices, COPS Publications. August2000. http://www.usdoj.gov/cops/.,2000.[2] Hendrick, J.S., Howell, T.J. London,D.M. Luehrs, E.M. Saliba, M.Brown, D. Dalton, J. Prats, F.B.Johnstone, B. WebCAT: the design<strong>and</strong> implementation of the Web-basedcrime analysis toolkit. Systems <strong>and</strong>In<strong>for</strong>mation Engineering DesignSymposium, 2004 IEEE. Pp. 95-103,2004.[3] Hick, S. <strong>and</strong> Grubb, C., RegionalCrime Analysis Data-Sharing withArcIMS: Kansas City Regional CrimeAnalysis GIS. Twenty-Third AnnualESRI International User Conference SanDiego, Cali<strong>for</strong>nia.[4] Martins, B. <strong>and</strong> Silva, M.J., TheWebCAT Framework AutomaticGeneration of Meta-data <strong>for</strong> WebResources Martins, Web Intelligence,2005. Proceedings of the 2005 IEEE/WIC/ACM International Conference,September 2005, Pp. 236 – 242, 2005.1 Faculty of In<strong>for</strong>mation <strong>and</strong> CommunicationTechnology,Universiti Teknikal Malaysia Melaka.Email : zahriah@utem.edu.myEmail : safizah@utem.edu.myFigure 4: Output of Crime Mapping.Buletin Geospatial Sektor Awam 5
Noise Exposure Mapping inShopping Complexes UsingGeospatial TechnologyMohamad Arshad bin AwangaAlam Sekitar Malaysia Sdn Bhd, No 19 Jalan Astaka U8/84, Bukit Jelutong Business &Technology Centre, 40150 Shah Alam Selangor, Malaysia.KEY WORDS: noise, noise exposure, GIS, GPS, geospatialAbstractEnvironmental noise is a worldwide problem. Noise results from unwanted sound.Most of the people do not realize the noise exposure level in shopping complexes.Policies on noise control have been developed in Malaysia. Noise exposure <strong>studies</strong>are carried out to support these policies. Since important decisions are based on theresults of noise exposure <strong>studies</strong>, it is not only important to quantify noise effects,but also to have in<strong>for</strong>mation on the these exposure level. However the need <strong>for</strong>this in<strong>for</strong>mation is often discarded. Noise is a common occupational <strong>hazard</strong> thatleads to one of the most common complaints in the adult population seen by theotolaryngologist – noise induced hearing loss (NIHL). Sound intensity above 80dBA of a sufficient duration may cause temporary or permanent threshold shifts.NIHL is a problem caused by sounds of significant intensity <strong>and</strong> duration (Rosen,2001). The main objective of the study is to Mapping of Noise Exposure Level inShopping Complex. In order to achieve this, the following activities were carriedout:• Measurement <strong>and</strong> data collection of noise exposure level using Digital SoundLevel Meter (model 407736): Extech Instruments.• Measurement <strong>and</strong> data collection of shopping complex locations using RUSSAPocket PC + GPS receiver.• Analysis <strong>and</strong> Mapping of the Noise Exposure Level.• Development of Noise Exposure Database <strong>and</strong> Noise Exposure MappingIn<strong>for</strong>mation System (NEMIS) Application.This study was conducted in 10 selected shopping complexes in WilayahPersekutuan Kuala Lumpur, Wilayah Persekutuan Putrajaya <strong>and</strong> Selangor.Continuous weekly data were obtained in 10 measurement points using SoundLevel Meter <strong>and</strong> Global Positioning System (GPS) devices. By using these datain geospatial environment, presentation of the noise in<strong>for</strong>mation can be donedynamically to the respective user.1. INTRODUCTIONNoise pollution is more illusive than otherpollution problems. It is often mobile<strong>and</strong> it is variable through time <strong>and</strong> space.Further, noise pollution is a matter of humanperception related to personal tolerance <strong>and</strong>taste.During the last 20 years there has beenincreasing concern with the quality of theenvironment. Along with air <strong>and</strong> watercontaminants, noise has been recognized as aserious pollutant. As noise levels have risen,the effects of noise have become pervasive<strong>and</strong> more apparent. (NPC Library ProtectiveNoise Levels.htm, [referred on 5 October2006]).Noise pollution has become an importantfactor in the development of society, in termsof living com<strong>for</strong>t <strong>and</strong> also from an economicpoint of view. The exposure of individualsto noise can cause health problems; undercertain conditions can also affect the workefficiency <strong>and</strong> general quality of urban life.Community noise (also called environmentalnoise, residential noise or domestic noise)is defined as noise emitted from all sourcesexcept noise at the industrial workplace. Mainsources of community noise include <strong>road</strong>,rail <strong>and</strong> air traffic, industries, construction<strong>and</strong> public work, <strong>and</strong> the neighbourhood. Themain indoor sources of noise are ventilation<strong>system</strong>s, office machines, home appliances<strong>and</strong> neighbours. Typical neighbourhood noisecomes from premises <strong>and</strong> installations relatedto the catering trade (restaurant, cafeterias,discotheques, etc.); from live or recordedmusic; sport events including motor sports;playgrounds; car parks; <strong>and</strong> domestic animalssuch as barking dogs. Many countries haveregulated community noise from <strong>road</strong> <strong>and</strong> railtraffic, construction machines <strong>and</strong> industrialplants by applying emission st<strong>and</strong>ards, <strong>and</strong>by regulating the acoustical properties ofbuildings.In contrast, few countries have regulations oncommunity noise from the neighbourhood,probably due to the lack of methods todefine <strong>and</strong> measure it, <strong>and</strong> to the difficultyof controlling it. In large cities throughoutthe world, the general population isincreasingly exposed to community dueto the sources mentioned above <strong>and</strong> thehealth effects of these exposures areconsidered to be a more <strong>and</strong> more importantpublic health problem. Specific effects tobe considered when setting communitynoise guidelines include: interference withcommunication; noise-induced hearing loss;sleep disturbance effects; cardiovascular <strong>and</strong>psychophysiological effects; per<strong>for</strong>mancereduction effects; annoyance responses; <strong>and</strong>effects on social behaviour. Since 1980,the World Health Organization (WHO) hasaddressed the problem of community noise.Health-based guidelines on communitynoise can serve as the basis <strong>for</strong> derivingnoise st<strong>and</strong>ards within a framework of noisemanagement.In general, noise can be define as unwantedsound, is a universal problem <strong>and</strong> most ofus have been affected by it at some time inour lives. Research into the perception ofenvironmental noise, such as that carried outin the National Noise Attitude Study, fundedby Defra <strong>and</strong> carried out by BRE in 1999-2000 showed that approximately 20% of UKrespondents reported that noise spoilt theirhome life to some extent, <strong>and</strong> 8% reportedthat their home life was spoilt either “quitea lot” or “totally”. As already mentioned,6 Buletin Geospatial Sektor Awam
the London Household Survey 2002 hasindicated that 13% of the people surveyedrated <strong>road</strong> traffic noise a “serious problem”.Although we are still trying to fullyunderst<strong>and</strong> the links between environmentalnoise <strong>and</strong> health, it is clear that noise cancause adverse effects on people, includingirritation, annoyance <strong>and</strong> sleep disturbance.(Department <strong>for</strong> Environment, Food <strong>and</strong>Rural Affairs (Defra), 2004. Noise MappingEngl<strong>and</strong>. The London Road Traffic NoiseMap)Sound <strong>and</strong> noise are defined as a vibratorydisturbance created by a moving or vibratingsource that is capable of being detected bythe hearing organs. Noise is specificallydefined as sound that is loud, unpleasant,unexpected, or undesired <strong>and</strong> may there<strong>for</strong>ebe classified as a more specific group ofsounds. The effects of noise on people caninclude general annoyance, interference withspeech communication, sleep disturbance<strong>and</strong>, in the extreme, hearing impairment.(Caltrans, 1998).Noise is a common occupatianal <strong>hazard</strong> thatleads to one of the most common complaintsin the adult population seen by theotolaryngologist – noise induced hearing loss(NIHL). Sound intensity above 80 dBA of asufficient duration may cause temporary orpermanent treshold shifts. NIHL is a problemcaused by sounds of significant intensity <strong>and</strong>duration. (Rosen, 2001).With the advances of in<strong>for</strong>mationtechnologies, the study was done to evaluatethe capability of geospatial technology inanalysing <strong>and</strong> mapping noise exposurelevel in shopping complexes. The fieldwork data collected in shopping complexeswithin Wilayah Persekutuan Kuala Lumpur,Wilayah Persekutuan Putrajaya <strong>and</strong> Selangorwere used to support the study. The fieldworkdata were collected using Digital SoundLevel Meter <strong>and</strong> RUSSA Pocket PC + GPSreceiver.2. OBJECTIVE OF STUDYThe main objective of the study is toMapping of Noise Exposure Level inShopping Complexes. For the pilot study, thefocus of the study was done on 10 selectedshopping complexes within WilayahPersekutuan Kuala Lumpur, WilayahPersekutuan Putrajaya <strong>and</strong> Selangor. In orderto achieve this, the following activities werecarried out:• Measurement <strong>and</strong> data collection ofnoise exposure level using DigitalSound Level Meter (model 407736):Extech Instruments.• Measurement <strong>and</strong> data collection ofshopping complex locations usingRUSSA Pocket PC + GPS receiver.• Analysis <strong>and</strong> Mapping of the NoiseExposure Level.• Development of Noise ExposureDatabase <strong>and</strong> Noise Exposure MappingIn<strong>for</strong>mation System (NEMIS)Application.3. LITERATURE REVIEW3.1 Definition of NoiseNoise is defined as “unwanted sound.” Inthe context of protecting the public health<strong>and</strong> welfare, noise implies adverse effectson people <strong>and</strong> the environment. Noisescause hearing loss, interferes with humanactivities at home <strong>and</strong> work, <strong>and</strong> is invarious ways injurious to people’s health<strong>and</strong> well-being. Although hearing loss isthe most clearly measurable health <strong>hazard</strong>,noise is also linked to other physiological<strong>and</strong> psychological problems. (Noise ControlManual, David A. Harris)Noise is a common occupational <strong>hazard</strong> thatleads to one of the most common complaintsin the adult population seen by theotolaryngologist – noise induced hearing loss(NIHL). Sound intensity above 80 dBA of asufficient duration may cause temporary orpermanent treshold shifts. NIHL is a problemcaused by sounds of significant intensity <strong>and</strong>duration. (Rosen, 2001).Noise is considered to be any unwantedsound that may adversely affect the health<strong>and</strong> well being of individuals or populations.Physically, sound is a mechanical disturbancepropagated as longitudinal wave motion inair <strong>and</strong> other elastic or mechanical media,such as water or steel. Its main features aresound intensity, measured as sound pressure<strong>and</strong> frequency spectrum indicating thedistribution of the total sound over high <strong>and</strong>low frequencies. The spectrum is importantwith respect to the effects of noise on people<strong>and</strong> with respect to the engineering costs toreduce the noise. (WHO, 1980).3.2 Definition of SoundSound is generated by creating a disturbancein the air, which sets up a series of pressurewaves fluctuating above <strong>and</strong> below the air’snormal at mospheric pressure. The pressurewave propagates in all directions from thesource of sound. Sound travel in the air at aspeed about 330 metres per second. Our earssense these pressure fluctuations, convertthem to electrical impulse <strong>and</strong> send themto our brain, where they are interpreted assound. (Quirroutte <strong>and</strong> Warnock, 1985).Sound can travel as vibration waves in solidsor liquids. The term airborne <strong>and</strong> structureborne sound are used depending on themedium the sound is travelling in time.When the medium in which the noise stars tospread from the source is air, the noise calledairborne; when it starts vibration betweenstructures, it is called structure borne. Thestructure borne noise occurs when wall,floor or other building elements are set intovibration by direct mechanical contact withthe source, such as mechanical equipment orfootstep. (Burberry, 1977).Sound <strong>and</strong> noise are defined as a vibratorydisturbance created by a moving or vibratingsource that is capable of being detected bythe hearing organs. Noise is specificallydefined as sound that is loud, unpleasant,unexpected, or undesired <strong>and</strong> may there<strong>for</strong>ebe classified as a more specific group ofsounds. The effects of noise on people caninclude general annoyance, interference withspeech communication, sleep disturbance<strong>and</strong>, in the extreme, hearing impairment.(Caltrans, 1998).Freest<strong>and</strong>ing source of sound movesoutwards in all directions <strong>for</strong>ming a sphericalwave front. Sound waves can be reflected.Sound waves are propagated in straightlines, but if obstruction occurs, waves willdiffracted around the object. Sound intensitydiminishes in proportion to the square ofthe distance from source. (Limpscomb <strong>and</strong>Taylor, 1978).3.3 Global Positioning System (GPS)ConceptGPS (Global Positioning System) technologyis a worldwide radio navigation <strong>system</strong>based on satellites. There are 24 satellitesthat revolve the earth round the clock. Thesesatellites have the capability to determinethe position of an object on earth that comesunder their line of sight. However, in order todetermine the position of an object on earth,GPS requires each of these objects to have aGPS receiver. These GPS receivers tune to aparticular frequency <strong>and</strong> listen to the signalsBuletin Geospatial Sektor Awam 7
coming from the GPS satellites. The more thenumber of satellites the GPS receivers signalsfrom, the better the accuracy. It has beenproved that if a GPS receiver can processdata from a minimum of three satellites, itcan present a better accuracy. Upon aligning<strong>and</strong> synchronizing with the satellites, the GPSreceiver receives the location in<strong>for</strong>mation ofthe object (namely, itself). GPS provides thefollowing in<strong>for</strong>mation about an object thathas a GPS receiver. These are the latitude, thelongitude, the altitude, the speed at which theobject is moving, the direction of movement,the date <strong>and</strong> time of reading.3.4 Geographic In<strong>for</strong>mation System (GIS)ConceptA Geographic In<strong>for</strong>mation System or GISmay be defined as “...a computer-basedIn<strong>for</strong>mation <strong>system</strong> which attempts to capture,store, manipulate, analyze <strong>and</strong> displayspatially referenced <strong>and</strong> associated tabularattribute data, <strong>for</strong> solving complex research,planning <strong>and</strong> management problems”(Fischer<strong>and</strong> Nijkamp, 1992).GIS is a special case of in<strong>for</strong>mation <strong>system</strong>swhere the database consists of observationson spatially distributed features, activities orevents, which are definable in space as points,lines, or areas. Basically this definition entailsthe visual display of data on a map. (Clarke2001).GIS is a <strong>system</strong> whereby spatial data isstored, retrieved, manipulated <strong>and</strong> viewed.De Mers (1997) <strong>and</strong> the ESRI website (2004)summarize the processes involved as follows:• A data input <strong>system</strong> in which spatialdata from various origins are stored <strong>and</strong>processed.• A data storage <strong>and</strong> retrieval sub<strong>system</strong>that arranges spatial data in such a waythat it may be retrieved, updated <strong>and</strong>edited.• A data manipulation <strong>and</strong> analysissub<strong>system</strong> that interacts with the data<strong>and</strong> per<strong>for</strong>ms modeling functions.• A reporting sub<strong>system</strong> that displays thein<strong>for</strong>mation in the database in tabulargraphic, or map <strong>for</strong>m.3.5 Integration of GPS <strong>and</strong> GIS in NoiseExposure MappingMonitoring the effects of noise is onlypossible with an extensive spatial database<strong>and</strong> spatial analysing tools. Furthermorecomputation <strong>for</strong>ce is necessary. GIS <strong>for</strong>msa powerful set of tools <strong>for</strong> storing <strong>and</strong>retrieving, trans<strong>for</strong>ming <strong>and</strong> displaying spatialdata from the real world <strong>for</strong> a particular set ofpurposes. (Burrough, 1986).GIS contains a database management <strong>system</strong>designed <strong>for</strong> spatial data <strong>and</strong> is there<strong>for</strong>e avery good <strong>system</strong> <strong>for</strong> managing geographicdata. GIS offers the same possibilities as otherdatabase management <strong>system</strong>s (DBMS) like:• The possibility to manage the data(setting authorisation, integrating data,version managing, verifying data,controlling <strong>and</strong> supervising accuracy <strong>and</strong>quality).• Ensuring the integrity <strong>and</strong> consistencybetween data.• Rapid access to the data• The availability of the data stored in theDBMS to many users <strong>and</strong> different kindsof applications.Furthermore GIS offers tools <strong>and</strong> datastructures to deal with the spatial componentof the data. (Bernhardsen, 1999).4. METHODOLOGY4.1 Location of Study AreaBelow is the location sites <strong>for</strong> the 10selected shopping complexes within WilayahPersekutuan Kuala Lumpur, WilayahPersekutuan Putrajaya <strong>and</strong> Selangor.1) JUSCO Taman Equine, SeriKembangan, Selangor.2) GIANT B<strong>and</strong>ar Puteri, Puchong,Selangor.3) TESCO Puchong, Puchong, Selangor.4) Bangsar Village Shopping Complex,Bangsar, Kuala Lumpur.5) Maju Junction Mall, Jalan TAR, KualaLumpur.6) Pertama Complex, Jalan TAR, KualaLumpur.7) SOGO Shopping Centre, Jalan TAR,Kuala Lumpur.8) TESCO Mutiara Damansara, PetalingJaya, Selangor.9) Alam<strong>and</strong>a Putrajaya, Putrajaya.10) Carrefour Seri Petaling, B<strong>and</strong>ar BaruSeri Petaling, Kuala Lumpur.4.2 Equipment UsedFor this research study purposes on NoiseExposure Level Mapping, the equipmentsused as below:• Digital Sound Level Meter.• RUSSA Pocket PC <strong>and</strong> GPS Receiver.4.3 Methodology WorkflowImplementation of the Noise ExposureMapping In<strong>for</strong>mation System (NEMIS)application will be divided into 4 majorphases. Phase I will involve data collection,editing, processing <strong>and</strong> data integration.Phase II will include the databasecreation. Phase III involved in applicationdevelopments <strong>and</strong> Phase IV <strong>for</strong> generatesthe outputs in <strong>for</strong>m of graphs <strong>and</strong> dynamicmaps. Each phases were represent in differentcolours as figure below.Figure 1: Study Area8 Buletin Geospatial Sektor Awam
Figure 2: Digital Sound Level Meter <strong>and</strong> SpecificationsFigure 3: RUSSA Pocket PC <strong>and</strong> GPS ReceiverData Col lection• Sound Lev el data• GPS d ataAnc illa ry datasets• Admin istrative BoundaryData Pro cessing• Microsof t Excel• Arcvie w GISPro cessedDataSpatial Inte grationQuickTime <strong>and</strong> adecompressor• data verification / upd ateare needed to see this picture.Phas e IPhas eIIIApplications• nois e Exposure MappingSpatialdat a basePhas eIIPhas e IVOu tputs+Prese ntation o f Nois e Exposure GraphPrese ntation o f Shop pingComp lexes Loc ationFigure 4: Methodology WorkflowBuletin Geospatial Sektor Awam 9
One of the most important elements ofdeveloping Noise Exposure Level Mappingapplication is finding <strong>and</strong> utilizing theappropriate data. The <strong>for</strong>m of the data iscritical to the overall database design, <strong>and</strong> thesuccess of the analyses per<strong>for</strong>med with theapplication <strong>system</strong>.For this study, fieldwork data collection hasbeen done <strong>for</strong> sound level data <strong>and</strong> shoppingcomplexes location data. Besides that,ancillary GIS datasets has been obtained fromJUPEM in shapefile <strong>for</strong>mat (administrationboundary, town). Later, sound level meter datahas been processed using Microsoft Excel <strong>and</strong>the result then exported into GIS environment.After that, the integration data has beendone. The integration has been done betweenattributes data <strong>and</strong> spatial data which will beused <strong>for</strong> analysis purposes.Spatial database development is the process ofbuilding the digital database from the sourcedata - maps <strong>and</strong> tabular files (fieldwork data).A database construction process is dividedinto two major activities:• Creation of digital files from maps,tables <strong>and</strong> other source documents;• Organization of the digital files into aGIS database using Arcview GIS.After completed of spatial databasedevelopment, Noise Exposure Mappingapplication has been develop using WebpageMaker V2 (an open source software). Usingthis open source software, the output <strong>for</strong> noiseexposure level can be disseminate through theinternet.5. RESULT AND DISCUSSION5.1 Analysis of DataAnalysis of data were done <strong>for</strong> 10 selectedshopping centres <strong>and</strong> 10 observations werehave been done <strong>for</strong> each selected shoppingcentres. The comparison data will be shown ingraph <strong>for</strong>mat as below;1) Graph of Noise Exposure Levelof JUSCO Taman Equine, SeriKembangan, Selangor.2) Graph of Noise Exposure Level ofGIANT B<strong>and</strong>ar Puteri, Puchong,Selangor.3) Graph of Noise Exposure Level ofTESCO Puchong, Puchong, Selangor.4) Graph of Noise Exposure Level ofBangsar Village Shopping Complex,Bangsar, Kuala Lumpur.5) Graph of Noise Exposure Level ofMaju Junction Mall, Jalan TAR, KualaLumpur.6) Graph of Noise Exposure Level ofPertama Complex, Jalan TAR, KualaLumpur.7) Graph of Noise Exposure Level ofSOGO Shopping Centre, Jalan TAR,Kuala Lumpur.140120100100100806040806040Sound Level 20 (dbA)0806040S ound L evel vs L oc ation G raph20Sound Level (dBA)01 2 3 4 5 6 7 8 9 10Min dB(A) 68 73 72 73 68 73 74 78 76 69Max dB(A) 75 84 75 76 73 80 87 90 86 73L oc a tionS ound L evel vs L oc ation G raph20Sound Level (dBA)01 2 3 4 5 6 7 8 9 10Min dB(A) 68 71 70 71 70 76 72 78 76 69Max dB(A) 71 77 72 78 77 83 86 90 86 73L oc a tionS ound L evel vs L oc ation G raph1 2 3 4 5 6 7 8 9 10Min dB(A) 72 71 75 70 75 82 76 77 68 75Max dB(A) 75 75 78 76 81 115 101 81 80 80L o c a tio n8) Graph of Noise Exposure Level ofTESCO Mutiara Damansara, PetalingJaya, Selangor.9) Graph of Noise Exposure Level ofAlam<strong>and</strong>a Putrajaya, Putrajaya.10) Graph of Noise Exposure Level ofCarrefour Seri Petaling, B<strong>and</strong>ar BaruSeri Petaling, Kuala Lumpur.Min dB(A)Max dB(A)Figure 5: Graph of Noise Exposure Level of JUSCO Taman EquineMin dB(A)Max dB(A)Figure 6: Graph of Noise Exposure Level of GIANT B<strong>and</strong>ar PuteriMin dB(A)Max dB(A)Figure 7: Graph of Noise Exposure Level of TESCO Puchong10 Buletin Geospatial Sektor Awam
S ound L evel vs L oc ation G raphS ound L evel vs L oc ation G raph8010075807065Min dB(A)Max dB(A)6040Min dB(A)Max dB(A)60Sound Level (dBA)551 2 3 4 5 6 7 8 9 1020Sound Level (dBA)01 2 3 4 5 6 7 8 9 10Min dB(A) 65 67 68 66 66 66 67 63 67 69Max dB(A) 70 69 73 68 75 70 72 68 71 73L oc a tionMin dB(A) 67 72 71 73 70 66 66 63 67 69Max dB(A) 80 78 76 76 77 70 72 69 74 73L oc a tionFigure 8: Graph of Noise Exposure Level of Bangsar VillageShopping ComplexFigure 11: Graph of Noise Exposure Level of SOGOShopping CentreS ound L evel vs L oc ation G raphS ound L evel vs L oc ation G raph10010080806040Min dB(A)Max dB(A)6040Min dB(A)Max dB(A)20Sound Level (dBA)01 2 3 4 5 6 7 8 9 1020Sound Level (dBA)01 2 3 4 5 6 7 8 9 10Min dB(A) 75 71 71 72 70 70 66 64 67 69Max dB(A) 81 76 84 75 77 80 73 70 74 73L oc a tionMin dB(A) 69 62 63 70 68 67 69 72 68 72Max dB(A) 79 70 69 78 70 81 75 81 80 76L oc a tionFigure 9: Graph of Noise Exposure Level of Maju Junction MallFigure 12: Graph of Noise Exposure Level of TESCOMutiara DamansaraS ound L evel vs L oc ation G raph12010080Min dB(A)60Max dB(A)40Sound Level (dBA) 2001 2 3 4 5 6 7 8 9 10Min dB(A) 71 70 71 71 69 68 68 68 67 65Max dB(A) 104 107 79 81 80 74 74 90 85 72L oc a tionFigure 10: Graph of Noise Exposure Level of Pertama ComplexS ound L evel vs L oc ation G raph100806040Min dB(A)Max dB(A)20Sound Level (dBA)01 2 3 4 5 6 7 8 9 10Min dB(A) 61 66 65 70 75 66 69 70 78 75Max dB(A) 66 70 70 76 81 71 70 81 80 82L oc a tionFigure 13: Graph of Noise Exposure Level of Alam<strong>and</strong>a PutrajayaS ound L evel vs L oc ation G raph85807570Min dB(A)Max dB(A)65Sound Level (dBA)601 2 3 4 5 6 7 8 9 10Min dB(A) 72 71 75 71 72 73 70 77 71 76Max dB(A) 76 75 78 76 78 76 71 81 80 81L o c a tio nFigure 14: Graph of Noise Exposure Level of Carrefour Seri PetalingBuletin Geospatial Sektor Awam 11
T re s ho l d v a l u e , 9 0 dBAFigure 15: Histogram of Noise Exposure Level of All Study Area5.2 DiscussionsMeasurement <strong>and</strong> data collection of noiseexposure level using Digital Sound LevelMeter were taken at 10 selected shoppingcomplexes. Based on the observation, thelowest noise exposure level was recorded61 (dBA) at Alam<strong>and</strong>a Shopping Centre,Putrajaya <strong>and</strong> the highest was recorded115 (dBA) at TESCO Puchong, Selangor.However the average noise exposure leveldata varies between 61 (dBA) to 115 (dBA)depends on the condition in the shoppingcomplexes itself during the date <strong>and</strong> time theobservation were done.The source of noise exposure level alsovaries. Source of noise from the music, voiceof peoples, nearby noise from vehicles,children screaming were recorded. Duringthe noise exposure level data observation,the surrounding conditions also take intoconsideration. Based on the histogram, itshows that there are 4 shopping complexesexceed the treshold limits.• Pertama Complex• TESCO Puchong• GIANT Puchong• JUSCO EquineBased on the Allowable Factory <strong>and</strong>Machinery Act 1967, the Action Level is 90(dBA).5.3 Precaution <strong>and</strong> Assumption MadeDue to the time limitation of the study<strong>and</strong> other factors, several precautions <strong>and</strong>assumption has been made through the studyespecially <strong>for</strong> measurement considerations.5.3.1 Sound Level Meter MeasurementConsiderationsFor data observation using soundlevel meter, several measurementconsiderations has been made as follow;1) Wind blowing across the microphoneadds extraneous noise to themeasurement.2) Use the supplied windscreen to coverthe microphone when applicable.3) Calibrate the instrument be<strong>for</strong>e eachuse if possible. Especially if themeter has not been used <strong>for</strong> a longperiod of time.4) Do not store or operate the instrumentin areas of high temperature orhumidity.5) Keep meter <strong>and</strong> microphone dry.6) Avoid severe vibration when usingthe meter.7) Remove the battery when the meter isto be stored <strong>for</strong> long periods of time.5.3.2 GPS Data MeasurementConsiderationsFor GPS data observation, severalmeasurement considerations hasbeen made as follow;1) Be<strong>for</strong>e started any measurement,make sure at least 4 satelliteavailable on the sky to give the x,y, zcoordinate.2) Make sure at least 15 degree skyview to get the better result ofmeasurement.3) Make sure the data need to be takenabout 1-2 minutes observations toget the most accurate data.5.4 Limitation <strong>and</strong> ProblemsWhile conducting the study, some limitations<strong>and</strong> problems were encountered. Some ofthem are as follow;1) Due to the time limitation, the scopeof the study was narrowed.2) The pilot study were selected <strong>for</strong> 10selected shopping complexes only.The travel distance of each locationof shopping complex quite farfrom each others. So that, its quitetime consuming <strong>for</strong> fieldwork datacollection purposes.3) The availability of location data/data floor plan/floor plan <strong>for</strong>shopping complexes. Some of theshopping complex does not havethe appropiate floor plan. Some ofthem only have evacuation planonly whereas there have also the12 Buletin Geospatial Sektor Awam
shopping complexes does not haveboth of the in<strong>for</strong>mations.4) Editting task <strong>for</strong> GIS data such asadministrative boundary is very tidy<strong>and</strong> time consuming.5) Data observation <strong>for</strong> sound levelmeter need to be taken at least 3times <strong>and</strong> then average of maximum<strong>and</strong> minimum of the data observedwere recorded.6. CONCLUSION ANDRECOMMENDATIONS6.1 Conclusions1) The crucial part of the study isfieldwork data collection phase.With the good management<strong>and</strong> planning <strong>for</strong> fieldwork datacollection tasks, it can reduce cost<strong>and</strong> time saving.2) Generally, the noise exposure levelwithin the 10 selected shoppingcomplexes were between 61 (dBA)at Alam<strong>and</strong>a Shopping Centre,Putrajaya <strong>and</strong> the highest wasrecorded 115 (dBA) at TESCOPuchong, Selangor. The noiseexposure level recorded weredepends on the condition in theshopping complexes itself duringthe date <strong>and</strong> time of the observationperiod.3) The source of noise exposure levelalso varies. For example noisefrom the music, voice of peoples,from escalator, nearby noise fromvehicles, children screaming, etc.(Refer Appendix 1 <strong>for</strong> more details).4) Public awareness <strong>and</strong> supportin matters of noise environmentprotection has increased. The publicalso need to be educated to reduceof noise exposure level <strong>and</strong> avoidedto bring along their child <strong>and</strong>baby during the peak hours at theshopping complex.5) In totality, we can conclude thatthe noise exposure level in most 10selected shopping complexes abovethe safe limits except one or twoplaces exceed the limits during thepeak hours. Based on the AllowableOSHA Noise Exposure Levels(OSHA Regulations), the ActionLevel is 85 (dBA).6) OSHA’s Permissible ExposureLimits <strong>for</strong> noise exposure is 90 dBaveraged over an 8-hour work shift.For every 5 dB increase above 90,the number of permissible hours ofexposure is cut in half.7) The Noise Exposure MappingIn<strong>for</strong>mation System can be furtherenhance from the aspect security<strong>and</strong> module arrangement.In conclusion, the study has successfullyachieved the objective of the study. Themain objective of the study is to mapping ofnoise exposure level in shopping complexesusing geospatial technology. The applicationsuccessfully demonstrate the capability ofintegrating noise exposure level data withGPS data within the geospatial environment.Monitoring the effects of noise is onlypossible with an extensive spatial database<strong>and</strong> spatial analysing tools. Furthermorecomputation <strong>for</strong>ce is necessary. GIS <strong>for</strong>msa powerful set of tools <strong>for</strong> storing <strong>and</strong>retrieving, trans<strong>for</strong>ming <strong>and</strong> displayingspatial data from the real world <strong>for</strong> aparticular set of purposes. (Burrough, 1986).Integration of GIS <strong>and</strong> noise exposure leveldata has a number of advantages:• GIS can <strong>for</strong>m a link betweengeographical <strong>and</strong> geometricalin<strong>for</strong>mation of the surroundings<strong>and</strong> the noise exposure level data.The integration makes it possible togenerate dynamic noise exposurelevel in<strong>for</strong>mation using latest ICTtechnology <strong>for</strong> data dissemination.• GIS contains additional tools <strong>for</strong>storing, managing, analysing <strong>and</strong>presenting the needed geographicaldata <strong>and</strong> noise exposure level data.6.2 Recommendations1) Public awareness programmeshould be carried out <strong>for</strong> allemployees/customers who areworking or visiting at shoppingcomplexes. These employees/customers need to be educated toreduce of noise exposure level <strong>and</strong>avoided to bring along their child<strong>and</strong> baby during the peak hours atthe shopping complex.2) Duty scheme in the shoppingcomplexes should be revisedwhereby employees should notworking more than 8 hours ifexposed to the high level of noise.3) Employees who are working inshopping complexes should beeducated with the OSHA Act,Factory <strong>and</strong> Machinery Act <strong>and</strong>the usage of Personal ProtectionEquipment (PPE).4) Every shopping complexes shouldhave or <strong>for</strong>med the <strong>safety</strong> <strong>and</strong> healthcommitee based on the requirementof OSHA (Act 514).5) Recommended that use of hearingprotective devices (earplugs,earmuffs) is permitted only ifengineering <strong>and</strong> administrativecontrols fail to reduce sound levelswithin the prescribed levels.6) Noise levels need to be monitoredwhen noise levels are known orsuspected to be at or above 85 dBor hearing protective devices arenot sufficient to lower exposure to90 dB. Workers have the right toobserve monitoring procedures <strong>and</strong>to be notified of monitoring results.7) Records of noise exposure must beretained <strong>for</strong> two years. Audiometrictest records must be retained<strong>for</strong> the duration of the worker’semployment. Records must be madeavailable to the employee uponrequest.8) Employees exposed at or above85 dB averaged over eight hoursmust be trained on noise <strong>hazard</strong>s.Training must cover the <strong>hazard</strong>s ofexposure to excessive noise levels,reasons <strong>for</strong>, <strong>and</strong> proper selection,fitting, <strong>and</strong> maintenance ofhearing protective devices, <strong>and</strong> anexplanation of audiometric testing.9) Further study should be includedon study of detail noise inducedhearing loss (NIHL) correlationswith the noise exposure level interm of cost to compensate <strong>for</strong> thenoise induced hearing loss (NIHL).10) A questionaire method should beincluded to get the real data fromthe employees/workers in theshopping complexes.11) Dynamic/remote sound level meterwhich capable to transmits thenoise exposure level data shouldbe develop to help the authority(DOSH) to monitor the noiseexposure level in the shoppingcomplexes <strong>for</strong> en<strong>for</strong>cement actionpurposes.12) Additional data to support moreaccurate noise exposure levelmonitoring <strong>system</strong> should beobtained <strong>for</strong> further enhancementof noise exposure mappingin<strong>for</strong>mation <strong>system</strong> application.Buletin Geospatial Sektor Awam 13
13) Further requirements <strong>and</strong> studyshould be initiated by respectiveauthority to help the public/employees aware the long termeffect of the higher noise exposurelevel.14) Development of real time earlywarning <strong>system</strong> <strong>for</strong> noise exposurelevel which exceed the treshold limitas per OSHA requirements.15) Need further study to includenot only sources in the shoppingcomplexes itself, but correlatesalso with the outside factors liketraffic flow, heavy raining, etc.As we know most probably allthe shopping complexes locationis nearby the main <strong>road</strong>. So allthe noise parameters need to takeconsiderations.16) The Authority should adopt newtechnical guidelines on the riskassessment on noise exposure at theworkplace.ReferencesBERNHARDSEN, T., (1999). Geographic In<strong>for</strong>mation Systems, an introduction. New York:John Wiley & Sons.BURROUGH, P.A., (1986). Principles of Geographical In<strong>for</strong>mation Systems <strong>for</strong> L<strong>and</strong>Resource Assessment. Ox<strong>for</strong>d: Clarendon Press.BURBERRY, P., (1977). Environment <strong>and</strong> Services. (8th ed.). Pearson Education Limited,Engl<strong>and</strong>.BURNS, W., (1973). Noise <strong>and</strong> Man. (2nd ed.). JP Lippincott, Philadelphia.CLARKE, K.C, (2001). Getting started with geographical in<strong>for</strong>mation <strong>system</strong>s 3rd ed. NewJersey: Prentice Hall.CUNNIFF, P.F., (1977). Environmental Noise Pollution, John Wiley & Sons, Chichester.CALIFORNIA DEPARTMENT OF TRANSPORTATION (CALTRANS), Technical NoiseSupplement, October, 1998a.CALIFORNIA DEPARTMENT OF TRANSPORTATION (CALTRANS), Noise Analysis<strong>and</strong> Abatement, 1998b.DAVID A. HARRIS, (2006). Noise Control Manual.Van Nostr<strong>and</strong> Reinhold, New York.DAVID LIPSCOMB AND ARTHUR TAYLOR, (1978). Noise Control, H<strong>and</strong>book ofPrinciples <strong>and</strong> Practices. Van Nostr<strong>and</strong> Reinhold Ltd., New York.DE MERS, M.N., (1997). Fundamentals of geographic in<strong>for</strong>mation <strong>system</strong>s. New York:USA.ESRI. (2004). What is GIS. http://www.gis.com [referred on 5 October 2006]).GOODCHILD, M.F., P.A.LONGLEY, D.J.MAGUIRE AND D.W.RHINE, (1999).Geographical In<strong>for</strong>mation Systems Volume 2, Management Issues <strong>and</strong> Applications.New York: John Wiley & Sons, Inc.NPC, (2006). Library Protective Noise Levels.htm, [referred on 5 October 2006]).ROSEN, E.J., (2001). Noise Induced Hearing Loss, Gr<strong>and</strong> Rounds Presentation, UTMB,Department of Otolaryngology.QUIROUTTE, R.L., WARNOCK, A.C.C., (1985). Basic of Noise Control, Building Insight,http://www.nrc.ca/irc/bsi/90-2.html.WORLD HEALTH ORGANIZATION (WHO), (1980). Summary of Noise, EnvironmentalHealth Criteria No. 12, Geneva.14 Buletin Geospatial Sektor Awam