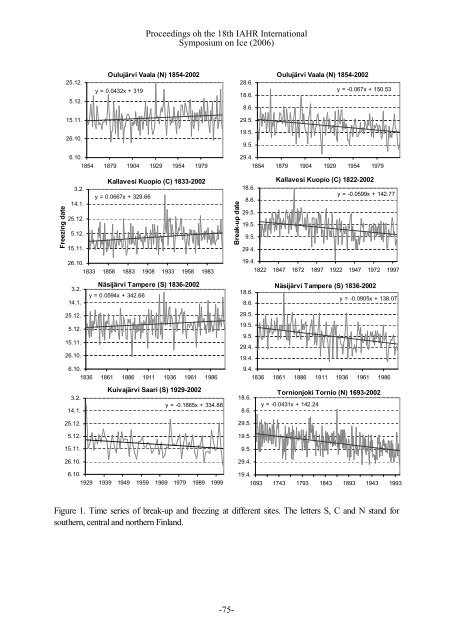
Proceedings oh the 18th IAHR InternationalSymposium on <strong>Ice</strong> (2006)statistically significant but some trends were also found for these shorter series, especially in southernFinland. In the series that started in the late 19 th century, the ice breakup has moved generally 6 to 9days earlier over one hundred years.The freezing has been delayed since the late 19th century, in most cases by 5 to 8 days per hundredyears. The duration of the ice cover has also significantly decreased at sites with the longest records, byabout two weeks (12 to 16 days) per hundred years. Only some of the freezing and duration of ice covertrends were statistically significant. Some trends towards an earlier freezing date were also found for afew shorter series. In the late 1920s and early 1930s, freezing occurred extremely late. On the otherhand, in autumn 2002 freezing occurred in small lakes in southern Finland extremely early. This resultsin a statistically significant trend towards earlier freezing in some small lakes in southern Finland, forexample in lake Kuivajärvi (Fig. 1). The extremely late freezing in the winter 19291930 and very earlyfreezing in 2002 make trend statistically significant.The trends of breakup were stronger than those of the freezing date. The wide variation of freezingdates hides the trends of freezing, especially in lakes with only short periods of records. The trends of icecover period were also more statistically significant than those of the freezing date. There were nostatistically significant trends of breakup, freezing or duration of ice cover in northern Lapland, but thetime series from this part of the country are still relatively short. Generally, trends were mainly strongerin the southern part of the country. The magnitudes of trends in this study were rather similar to thosepresented by Magnuson et al. (2000).When examining the subsets of long time series, some shortterm trends can be found. The freezingseries of lakes Näsijärvi, Kallavesi and Oulujärvi show that no dramatic changes occurred from themid1800s to the late19th century. From 1885 a number of other series can also be examined. At almostall of the sites freezing was delayed from the late 19 th century to the 1930s, because of the very latefreezing dates in some winters in the 1920s and the 1930s. After that, from the 1930s until the late 1960sfreezing has moved earlier in most places. From the 1960s to the present, freezing has again beenslightly delayed.The breakup series of the river Tornionjoki has many subset trends. From the late 17 th century until the1740s no remarkable changes can be found, but from the 1740s to the early 1800s breakup variedconsiderably. Breakup of lake Kallavesi was clearly delayed during the period from 1822 to the 1870s,and similar trends can be seen in the time series from lake Näsijärvi and the river Tornionjoki. For manyseries the late 19 th century was a turning point, after which the breakup started to move earlier.Simojoki (1940) determined the turning point for lake Kallavesi to be 1886. On the other hand, Eklund(1999) presented that a change to earlier breakup occurred in the early 19 th century in lake Mälaren,Sweden. From the late 1880s, the breakup dates have been moving earlier rather consistently, althoughthere is some variation between the years. A similar trend can be seen in the spring (MarchAprilMay)air temperatures in Finland (Tuomenvirta, 2004). In the 1960s and the 1970s variation between theyears was rather small and extreme breakup dates did not occur.The duration of ice cover has decreased from the late 19 th century to the 1920s. Of course, there isconsiderable variation from year to year. From the 1930s to the early 1950s ice cover periods weregenerally shorter than in the 1920s or late 1950s, especially in southern and central Finland. From thelate 1950s to the present time ice cover period have decreased slowly. The decreasing trend has beenstronger in the south. This examination of subsets of also shows clearly that by choosing differentperiods in the time series, different trends can be found.-74-
Proceedings oh the 18th IAHR InternationalSymposium on <strong>Ice</strong> (2006)25.12.5.12.Oulujärvi Vaala (N) 18542002y = 0.0432x + 31928.6.18.6.8.6.Oulujärvi Vaala (N) 18542002y = 0.067x + 150.5315.11.29.5.26.10.19.5.9.5.6.10.1854 1879 1904 1929 1954 197929.4.1854 1879 1904 1929 1954 1979Freezing date3.2.14.1.25.12.5.12.15.11.Kallavesi Kuopio (C) 18332002y = 0.0667x + 329.66Breakup date18.6.8.6.29.5.19.5.9.5.29.4.Kallavesi Kuopio (C) 18222002y = 0.0599x + 142.7726.10.1833 1858 1883 1908 1933 1958 198319.4.1822 1847 1872 1897 1922 1947 1972 19973.2.14.1.Näsijärvi Tampere (S) 18362002y = 0.0594x + 342.6618.6.8.6.Näsijärvi Tampere (S) 18362002y = 0.0905x + 138.0725.12.29.5.5.12.15.11.19.5.9.5.29.4.26.10.19.4.6.10.1836 1861 1886 1911 1936 1961 19869.4.1836 1861 1886 1911 1936 1961 19863.2.14.1.Kuivajärvi Saari (S) 19292002y = 0.1865x + 334.8818.6.8.6.Tornionjoki Tornio (N) 16932002y = 0.0431x + 142.2425.12.29.5.5.12.19.5.15.11.9.5.26.10.29.4.6.10.1929 1939 1949 1959 1969 1979 1989 199919.4.1693 1743 1793 1843 1893 1943 1993Figure 1. Time series of breakup and freezing at different sites. The letters S, C and N stand forsouthern, central and northern Finland.-75-