ice pad stability on sand: large-scale laboratory tests
ice pad stability on sand: large-scale laboratory tests
ice pad stability on sand: large-scale laboratory tests

Create successful ePaper yourself
Turn your PDF publications into a flip-book with our unique Google optimized e-Paper software.
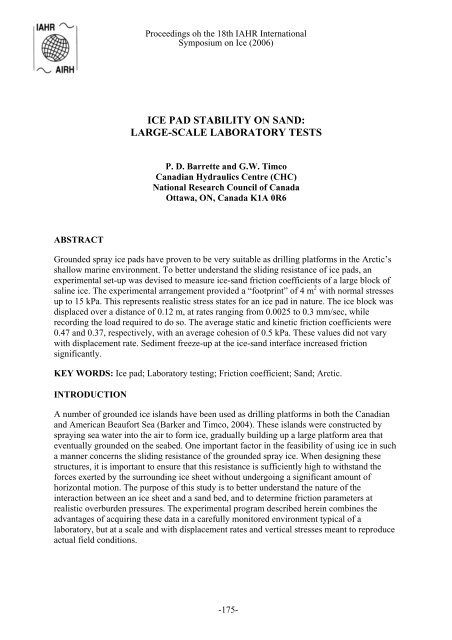
Proceedings oh the 18th IAHR Internati<strong>on</strong>alSymposium <strong>on</strong> Ice (2006)ICE PAD STABILITY ON SAND:LARGE-SCALE LABORATORY TESTSP. D. Barrette and G.W. TimcoCanadian Hydraulics Centre (CHC)Nati<strong>on</strong>al Research Council of CanadaOttawa, ON, Canada K1A 0R6ABSTRACTGrounded spray <str<strong>on</strong>g>ice</str<strong>on</strong>g> <str<strong>on</strong>g>pad</str<strong>on</strong>g>s have proven to be very suitable as drilling platforms in the Arctic’sshallow marine envir<strong>on</strong>ment. To better understand the sliding resistance of <str<strong>on</strong>g>ice</str<strong>on</strong>g> <str<strong>on</strong>g>pad</str<strong>on</strong>g>s, anexperimental set-up was devised to measure <str<strong>on</strong>g>ice</str<strong>on</strong>g>-<strong>sand</strong> fricti<strong>on</strong> coefficients of a <strong>large</strong> block ofsaline <str<strong>on</strong>g>ice</str<strong>on</strong>g>. The experimental arrangement provided a “footprint” of 4 m 2 with normal stressesup to 15 kPa. This represents realistic stress states for an <str<strong>on</strong>g>ice</str<strong>on</strong>g> <str<strong>on</strong>g>pad</str<strong>on</strong>g> in nature. The <str<strong>on</strong>g>ice</str<strong>on</strong>g> block wasdisplaced over a distance of 0.12 m, at rates ranging from 0.0025 to 0.3 mm/sec, whilerecording the load required to do so. The average static and kinetic fricti<strong>on</strong> coefficients were0.47 and 0.37, respectively, with an average cohesi<strong>on</strong> of 0.5 kPa. These values did not varywith displacement rate. Sediment freeze-up at the <str<strong>on</strong>g>ice</str<strong>on</strong>g>-<strong>sand</strong> interface increased fricti<strong>on</strong>significantly.KEY WORDS: Ice <str<strong>on</strong>g>pad</str<strong>on</strong>g>; Laboratory testing; Fricti<strong>on</strong> coefficient; Sand; Arctic.INTRODUCTIONA number of grounded <str<strong>on</strong>g>ice</str<strong>on</strong>g> islands have been used as drilling platforms in both the Canadianand American Beaufort Sea (Barker and Timco, 2004). These islands were c<strong>on</strong>structed byspraying sea water into the air to form <str<strong>on</strong>g>ice</str<strong>on</strong>g>, gradually building up a <strong>large</strong> platform area thateventually grounded <strong>on</strong> the seabed. One important factor in the feasibility of using <str<strong>on</strong>g>ice</str<strong>on</strong>g> in sucha manner c<strong>on</strong>cerns the sliding resistance of the grounded spray <str<strong>on</strong>g>ice</str<strong>on</strong>g>. When designing thesestructures, it is important to ensure that this resistance is sufficiently high to withstand theforces exerted by the surrounding <str<strong>on</strong>g>ice</str<strong>on</strong>g> sheet without undergoing a significant amount ofhoriz<strong>on</strong>tal moti<strong>on</strong>. The purpose of this study is to better understand the nature of theinteracti<strong>on</strong> between an <str<strong>on</strong>g>ice</str<strong>on</strong>g> sheet and a <strong>sand</strong> bed, and to determine fricti<strong>on</strong> parameters atrealistic overburden pressures. The experimental program described herein combines theadvantages of acquiring these data in a carefully m<strong>on</strong>itored envir<strong>on</strong>ment typical of a<strong>laboratory</strong>, but at a <strong>scale</strong> and with displacement rates and vertical stresses meant to reproduceactual field c<strong>on</strong>diti<strong>on</strong>s.-175-
Proceedings oh the 18th IAHR Internati<strong>on</strong>alSymposium <strong>on</strong> Ice (2006)EXPERIMENTAL SET-UP ANDPROCEDURESThe experimental procedures are dividedinto three distinct operati<strong>on</strong>s (Fig.1): 1)Growth of a level <str<strong>on</strong>g>ice</str<strong>on</strong>g> sheet, representative offirst-year sea <str<strong>on</strong>g>ice</str<strong>on</strong>g>; 2) Vertical loading of this<str<strong>on</strong>g>ice</str<strong>on</strong>g>, meant to simulate the weight of theoverlying spray <str<strong>on</strong>g>ice</str<strong>on</strong>g> as it is resting <strong>on</strong> the seabottom; and 3) Horiz<strong>on</strong>tal loading at ac<strong>on</strong>stant displacement rate while m<strong>on</strong>itoringthe forces required to do so. The latteroperati<strong>on</strong> is meant to reproduce loads ofthermal origin or those induced by currentsor winds.Step 1: Ice growthWag<strong>on</strong>Ice growthWater (20 ppt)Step 3 : Pulling of loaded <str<strong>on</strong>g>ice</str<strong>on</strong>g> sheetThe test basin and the wag<strong>on</strong> assemblyPositi<strong>on</strong>The test was set up in the CHC <str<strong>on</strong>g>ice</str<strong>on</strong>g> tanktransducers(Pratte and Timco 1981). The inside lengthand width of this basin was 6 and 2.6 m,respectively, with a height of 1.2 m (Fig. 2).The walls were 203 mm thick and wereFigure 1: Outline of procedures for testing.made of re-bar reinforced c<strong>on</strong>crete. Aremovable steel gate at <strong>on</strong>e end of the basin was used to access the basin’s interior. Two setsof guide rails were anchored <strong>on</strong>to the top of the two l<strong>on</strong>gitudinal walls. These allowed moti<strong>on</strong>of a frame assembly used to carry four c<strong>on</strong>tainment walls, henceforth collectively referred toas wag<strong>on</strong>, into which <str<strong>on</strong>g>ice</str<strong>on</strong>g> growth was to take place and which was used to pull the <str<strong>on</strong>g>ice</str<strong>on</strong>g> block<strong>on</strong>to the <strong>sand</strong>.Sand2 mLoad cellsInsulati<strong>on</strong>Pull rodsStep 2 : Lowering and vertical loading of <str<strong>on</strong>g>ice</str<strong>on</strong>g>Ice loading withc<strong>on</strong>crete slabsLowering ofwater levelC<strong>on</strong>creteActuatorEach wag<strong>on</strong> wall c<strong>on</strong>sisted of a 19 mm-structural members. A single 50 m l<strong>on</strong>g 800thick plywood sheet 2 m in length and0.79 m in width screwed <strong>on</strong>to the wag<strong>on</strong>’swatts heating cable was encased in a seriesof horiz<strong>on</strong>tal grooves in the plywood. Theplywood sheets and the heating cable werecovered with a thin sheet of stainless steel.The purpose of this set up was to deliverenough heat to the <str<strong>on</strong>g>ice</str<strong>on</strong>g> grown in the wag<strong>on</strong>to disengage it from the walls and allow it toslip downward <strong>on</strong>to the <strong>sand</strong> bed for testing.Figure 2: Test basin with enclosing wag<strong>on</strong>.The sediment columnThe sediments c<strong>on</strong>sisted of <strong>sand</strong>, which was obtained from a quarry in the Ottawa area. D10,D30 and D60 were 0.16, 0.30 and 0.61 mm, respectively, and the angle of repose was 32.5degrees. It was laid <strong>on</strong> the floor of the basin, and compacted manually to a total thickness of280 mm, about 75 mm below the wag<strong>on</strong>’s lowest structural member. This column includedthree 2-3 mm thick coloured <strong>sand</strong> layers at a distance of about 75, 155 and 215 mm from the-176-
Proceedings oh the 18th IAHR Internati<strong>on</strong>alSymposium <strong>on</strong> Ice (2006)floor of the basin. These layers were used as markers, to help find out how much of theshearing occurred within the <strong>sand</strong> column as opposed to at the <str<strong>on</strong>g>ice</str<strong>on</strong>g> <strong>sand</strong> interface itself.Instrumentati<strong>on</strong>Two 45 kN capacity water-proofed load cell assemblies were mounted in parallel <strong>on</strong>to thedownstream wag<strong>on</strong> wall (Fig. 1). They were located at the bottom of the wag<strong>on</strong> (as close aspossible to the <str<strong>on</strong>g>ice</str<strong>on</strong>g>-<strong>sand</strong> interface) in order to minimize the amount of torque exerted <strong>on</strong>to therail at the wag<strong>on</strong>’s suspensi<strong>on</strong> points. These cells m<strong>on</strong>itored the load exerted <strong>on</strong>to the wag<strong>on</strong>by a steel bar c<strong>on</strong>nected to two stainless steel pull rods, which extended to and went through<strong>on</strong>e of the basin’s end walls. Sealed guide tubes in the wall ensured water tightness. On theother side of that wall, the rods were clamped <strong>on</strong>to a sec<strong>on</strong>d bar, itself driven by a worm gearactuator. Two gear ratios were available: 20:1 and 60:1. The actuator’s maximum traveldistance was 124 mm, which was recorded by a positi<strong>on</strong> transducer. Positi<strong>on</strong> transducers werealso used to m<strong>on</strong>itor the vertical moti<strong>on</strong> of the <str<strong>on</strong>g>ice</str<strong>on</strong>g> at midpoint al<strong>on</strong>g the four edges of the topc<strong>on</strong>crete slab (Fig. 1). The voltage output from these seven channels (two load cells and fivepositi<strong>on</strong> transducers) was acquired at a rate of 100 Hz with a 30 Hz low-pass filter.ProceduresA 20 ‰ saline soluti<strong>on</strong> was prepared in a <strong>large</strong> pit inside the CHC <str<strong>on</strong>g>ice</str<strong>on</strong>g> tank by diluting sodiumchloride into tap water. Once the <strong>sand</strong> was laid out in the basin, enough of that water wastransferred over to reach the wag<strong>on</strong>’s top rim (Step 1 in Fig. 1). The entire water surfaceoutside the wag<strong>on</strong> was then covered with insulati<strong>on</strong> and the cold room temperature wasbrought down to -15C. An air deflector was set up to orient the flow of cold air from therefrigerati<strong>on</strong> vents <strong>on</strong>to the <str<strong>on</strong>g>ice</str<strong>on</strong>g> surface. An average thickness of 260 mm was achieved withinseveral days, with a growth rate up to 6 mm per hour.The heating cable inside the wag<strong>on</strong> walls was then activated while enough water wasremoved from the test basin so as to allow the <str<strong>on</strong>g>ice</str<strong>on</strong>g> block inside the wag<strong>on</strong> to drop <strong>on</strong>to theunderlying <strong>sand</strong> bed (Step 2 in Fig. 1). It was found that, during this process, a significantamount of melting occurred al<strong>on</strong>g the four bottom edges of the <str<strong>on</strong>g>ice</str<strong>on</strong>g> block, such that these wererounded. This was not objecti<strong>on</strong>able, however, since it reduced ‘edge effects’. In additi<strong>on</strong>,before every test, the leading edge was probed manually and any sediment accumulati<strong>on</strong> infr<strong>on</strong>t of the <str<strong>on</strong>g>ice</str<strong>on</strong>g> block was removed. Half way through the test program, the <str<strong>on</strong>g>ice</str<strong>on</strong>g> became toothin for testing to proceed so a sec<strong>on</strong>d growth stage (up to 370 mm) was d<strong>on</strong>e. Such thinningeither resulted from partial melting (the floor of the CHC <str<strong>on</strong>g>ice</str<strong>on</strong>g> tank is not insulated) orabrasi<strong>on</strong>.The surface of the <str<strong>on</strong>g>ice</str<strong>on</strong>g> block was then covered with a 3 mm thick rubber foam and a 40 mmthick plywood board. These formed a base <strong>on</strong>to which a 470 kg c<strong>on</strong>crete slab was laid. Oncethe four positi<strong>on</strong> transducers were installed <strong>on</strong> top of the slab, horiz<strong>on</strong>tal loading couldproceed (Step 3 in Fig. 1). After test completi<strong>on</strong>, the actuator was brought back to its initialpositi<strong>on</strong> and another c<strong>on</strong>crete slab was added to the vertical load for the next 124-mm test,and so <strong>on</strong>, up to a total mass of six t<strong>on</strong>s. This corresp<strong>on</strong>ded to an upper bound stress <strong>on</strong> theseabed of about 15 kPa (taking into account all test parameters, as noted below).TESTINGA total of 48 <strong>tests</strong> were c<strong>on</strong>ducted, divided into four series, each of which with increasingvertical load and at a given displacement rate. Another series was d<strong>on</strong>e with a c<strong>on</strong>stant load-177-
Proceedings oh the 18th IAHR Internati<strong>on</strong>alSymposium <strong>on</strong> Ice (2006)Horiz<strong>on</strong>tal Load (F )HF=HFVtanβ + AcβAcVertical Load (F )VFigure 3: Coulomb-type fricti<strong>on</strong>.but with displacement rates varying from <strong>on</strong>e test to thenext. Displacement rates ranged from 0.0025 to 0.3mm/sec, at an ambient air temperature of - 4 ± 2 o C. Thethickness and overall shape of the <str<strong>on</strong>g>ice</str<strong>on</strong>g> block wasm<strong>on</strong>itored before and after each series (through holesdrilled into the <str<strong>on</strong>g>ice</str<strong>on</strong>g>). Water level (for determining <str<strong>on</strong>g>ice</str<strong>on</strong>g>,board and c<strong>on</strong>crete buoyancies) was also recorded. Itranged from 45 to 400 mm above the <strong>sand</strong> bed.C<strong>on</strong>stants used throughout the test program for thecalculati<strong>on</strong> of the vertical load are water density (1019kg/m 3 ), <str<strong>on</strong>g>ice</str<strong>on</strong>g> density (estimated at 900 kg/m 3 ) and woodpanel volume and density. The net vertical load takes into account all these elements. Theforce required to slide the wag<strong>on</strong> assembly <strong>on</strong>to the rails with a floating <str<strong>on</strong>g>ice</str<strong>on</strong>g> block and at testtemperature was about 200 N. It was subtracted from the horiz<strong>on</strong>tal loads measured duringtesting. On the <strong>on</strong>set of the test program, it was assumed that the relati<strong>on</strong>ship between verticaland horiz<strong>on</strong>tal loads would follow a Mohr-Coulomb type behaviour (Barker and Timco2004), that is,F= F tan β Ac(1)H V+where F H and F V are the horiz<strong>on</strong>tal and vertical loads, respectively, A is the area of the<str<strong>on</strong>g>ice</str<strong>on</strong>g>/<strong>sand</strong> interface, c is the cohesi<strong>on</strong>, tanβ is the fricti<strong>on</strong> coefficient and β is the fricti<strong>on</strong> angle(Fig. 3).Top50 mmNewgrowthVerticalHoriz<strong>on</strong>talFigure 4: Cross-secti<strong>on</strong> of the <str<strong>on</strong>g>ice</str<strong>on</strong>g> block with vertical and horiz<strong>on</strong>tal (bottomsurface) thin secti<strong>on</strong>s. Note the c<strong>on</strong>tinuity in crystal structure resulting from thenew growth, a feature typical of 'c<strong>on</strong>gelati<strong>on</strong>' <str<strong>on</strong>g>ice</str<strong>on</strong>g>.RESULTSThe <str<strong>on</strong>g>ice</str<strong>on</strong>g> blockPrior to each test, the edges <strong>on</strong> the underside of the block were probed manually to check for<str<strong>on</strong>g>ice</str<strong>on</strong>g> shape and integrity. Doing so, a 'gap' was noted al<strong>on</strong>g the outside margins of the bottom-178-
Proceedings oh the 18th IAHR Internati<strong>on</strong>alSymposium <strong>on</strong> Ice (2006)kN30201000 100 200 300 400 500Time (sec<strong>on</strong>ds)IncreasingverticalloadFigure 5: Horiz<strong>on</strong>tal load traces from <strong>on</strong>e test series,for vertical loads ranging from 9 to 63 kN.surface, such that <strong>on</strong>ly about70% of that surface was in actualc<strong>on</strong>tact with the sediments.(Since both the normal and thetangential loads are normalizedover surface area, this reducti<strong>on</strong>in effective footprint does notaffect the results of our study.)When the <str<strong>on</strong>g>ice</str<strong>on</strong>g> was unloaded andallowed to float during the testprogram, visibility was too poor(due to the fine sediments insuspensi<strong>on</strong>) to allow a glance atthe bottom surface with anunderwater camera. However, upto three refrozen <str<strong>on</strong>g>ice</str<strong>on</strong>g> cracks a fewmillimetres in thickness running across the top surface of the block were observed later afterunloading the <str<strong>on</strong>g>ice</str<strong>on</strong>g>. It is uncertain how this may have affected the <str<strong>on</strong>g>ice</str<strong>on</strong>g>-<strong>sand</strong> interacti<strong>on</strong>.)Horiz<strong>on</strong>tal load (kN302010F H = 0.47F V + 1.6F H = 0.39F V + 0.3600 20 40 60 80Vertical load (kN)STATICKINETICLinear (STATIC)Linear (KINETIC)Figure 6: Linear behaviour of thehoriz<strong>on</strong>tal/vertical load ratio. The y-intercept (up<strong>on</strong>extrapolating) represents cohesi<strong>on</strong>.the <str<strong>on</strong>g>ice</str<strong>on</strong>g> salinity was about 5 ‰ at the beginning of testing, bureflecting the temperature fluctuati<strong>on</strong>s the <str<strong>on</strong>g>ice</str<strong>on</strong>g> had underg<strong>on</strong>eAt the end of the program, the waterwas removed from the test basin andthe <str<strong>on</strong>g>ice</str<strong>on</strong>g> was secti<strong>on</strong>ed with a chain saw(Fig. 4). At that tim e, it had a totalthickness of 345 mm in the centre,thinning down to 260 mm al<strong>on</strong>g themarg ins, with a width of 1.96 m al<strong>on</strong>gall edges. The sec<strong>on</strong>d (new) <str<strong>on</strong>g>ice</str<strong>on</strong>g>growth phase led to a c<strong>on</strong>spicuoushoriz<strong>on</strong>tal layering, shown in Fig. 4.The upper porti<strong>on</strong> of the <str<strong>on</strong>g>ice</str<strong>on</strong>g> sheet wasdominated with mm-sized crystalsresembling frazil <str<strong>on</strong>g>ice</str<strong>on</strong>g>, which extendeddown ward in a columnar structure. Nosediments were incorporated into the<str<strong>on</strong>g>ice</str<strong>on</strong>g>, with the excepti<strong>on</strong> of thelowermost 30 to 40 mm, where the <str<strong>on</strong>g>ice</str<strong>on</strong>g>was slightly brownish. Interestingly,t averaged 2 ‰ at the end,throughout the test program.Fricti<strong>on</strong> coefficientsExamples of load traces (the cumulative resp<strong>on</strong>se of both load cells) are shown in Fig. 5 for aseries of <strong>tests</strong> with increasing vertical load. These, and those for all other <strong>tests</strong>, display asimilar pattern of strain softening: a regular increase in horiz<strong>on</strong>tal load with time (ordisplacement) up to a peak, followed by a sudden drop and levelling off of the load. The peakload is that required to overcome static fricti<strong>on</strong>; the flat porti<strong>on</strong> of the load trace is the resultof the kinetic fricti<strong>on</strong>. When the latter segment was not perfectly flat, an average value wasrecorded. In some instances, the load trace at that stage comprised random (as shown by someof the traces in Fig. 5) or systematic cycling, thought to result from, respectively, slip-179-
Proceedings oh the 18th IAHR Internati<strong>on</strong>alSymposium <strong>on</strong> Ice (2006)Fricti<strong>on</strong> coefficient1.000.800.600.400.200.00Sediment freezeupbegins1 2 3 4 5 6 7 8 9 10 11 12 13 14 15 16Test numberSTATICKINETICFigure 7: Variati<strong>on</strong> in fricti<strong>on</strong> coefficient during <strong>on</strong>etest series.behaviour at the <str<strong>on</strong>g>ice</str<strong>on</strong>g>-<strong>sand</strong>interface and res<strong>on</strong>ance of thewag<strong>on</strong> assembly. An averagevalue for the horiz<strong>on</strong>tal load wasalso obtained in these cases.The slope of the initial loadincrease reflects the systemstiffness. Early in theexperimental program, the pullrod bar at the actuator end wasstrengthened to reduce theamount of bending to anacceptable level. This steepenedthe slope but did not otherwiseaffect the data. In all cases, alinear relati<strong>on</strong>ship was observedbetween the vertical loads andour. Arboth the static and kinetic forces (Fig. 6), c<strong>on</strong>sistent with Coulomb-type fricti<strong>on</strong> behavilinear regressi<strong>on</strong> allowed an estimate of both the slope and the y-axis intercept, the lattecorresp<strong>on</strong>ding to the parameter Ac in Eq. 1. An average value of 1.5 and 1.4 kN for the y-intercept was derivedrespectively for the static and0.60kinetic resp<strong>on</strong>se, corresp<strong>on</strong>dingto a cohesive stress of about0.500.5 kPa.When the <str<strong>on</strong>g>ice</str<strong>on</strong>g> block wasallowed to rest <strong>on</strong> the <strong>sand</strong> bedfor a sufficient amount of time(a few days), the sediments'icti<strong>on</strong> coefficientFr0.400.300.20tan β = 0.13R + 0.36tan β = -0.04R + 0.47STATICKINETICLinear (KINETIC)Linear (STATIC)surface began to freeze. This is 0.10shown in Fig. 7 for the <strong>tests</strong>eries with various0.00displacement rates but where0.001 0.01 0.1 1the vertical load remainedDispla cement rate (mm/sec)c<strong>on</strong>stant. A substantial increaseFigure 8: Semi-logarithmic plot displaying the relati<strong>on</strong>shipin fricti<strong>on</strong> is observed,presumably related with the between the fricti<strong>on</strong> coefficient (tan β ) and displacem entdownward progress of therate (R).freezing fr<strong>on</strong>t, and induced bythe interacti<strong>on</strong> of frozen <strong>sand</strong> over unfrozen <strong>sand</strong>. Note that, in this figure, it is uncertain as towhy the static fricti<strong>on</strong> coefficient increases slightly at the beginning of the test sequence.In Fig. 8, all the data are plotted as a functi<strong>on</strong> of displacement rate. A linear regressi<strong>on</strong> drawnfor both sets of data does not display a significant trend (which remains within data scatter).The average value for these parameters, derived from <strong>tests</strong> in which the sediments werebelieved not to have been affected by freeze-up, is 0.47 (static) and 0.37 (kinetic) with astandard deviati<strong>on</strong> of 0.03 in both cases.-180-
Proceedings oh the 18th IAHR Internati<strong>on</strong>alSymposium <strong>on</strong> Ice (2006)Vertical moti<strong>on</strong> of the <str<strong>on</strong>g>ice</str<strong>on</strong>g> blockThe readings from the vertical positi<strong>on</strong> transducers showed that the <str<strong>on</strong>g>ice</str<strong>on</strong>g> block always tended tosink into the <strong>sand</strong> column while traveling horiz<strong>on</strong>tally. This penetrati<strong>on</strong>, averaging 10 mm pertest, was generally not uniform. During <strong>on</strong>e test series, for instance, the block shifted about ahoriz<strong>on</strong>tal axis oriented perpendicular to the travel directi<strong>on</strong>. As a result, the leading edge ofthe <str<strong>on</strong>g>ice</str<strong>on</strong>g> block sank more than the opposite <strong>on</strong>e. Since the wag<strong>on</strong> was pushed back to itsstarting positi<strong>on</strong> in the basin up to three times over the course of this test program, blocksinking resulted in a slight downward slope in the <strong>sand</strong> bed in the travel directi<strong>on</strong> (up to 2degrees for the last series). Both the vertical and the horiz<strong>on</strong>tal load data were correctedaccordingly.Sand columnAt the end of test program, the basin was drained and vertical pits were dug into the <strong>sand</strong>, inthe directi<strong>on</strong> of <str<strong>on</strong>g>ice</str<strong>on</strong>g> moti<strong>on</strong> and perpendicular to it. No clear signs of shear (or tangential)stresses (such as overlapping sediment layers or a rotati<strong>on</strong> comp<strong>on</strong>ent) were observed,suggesting that much of the horiz<strong>on</strong>tal displacement took place at the <str<strong>on</strong>g>ice</str<strong>on</strong>g>/<strong>sand</strong> interface.However, evidence for normal stresses was ubiqu itous, in the form of compacti<strong>on</strong>: the spacingbetween the coloured <strong>sand</strong> layers was locally reduced by up to 80%. This compacti<strong>on</strong> couldnot be m<strong>on</strong>itored during the <strong>tests</strong> but it is most li kely linked with the sinking of the slabduring its travel.DISCUSSIONA number of studies have looked at the fricti<strong>on</strong> of <str<strong>on</strong>g>ice</str<strong>on</strong>g> against itself (Kennedy et al. 2000 andreferences therein) or various material (e.g. Barn es et al. 1971, Fiorio et al. 1997, Frederkingand Barker 2002, am<strong>on</strong>gst others). Few addressed the type of interacti<strong>on</strong> relevant to the<str<strong>on</strong>g>stability</str<strong>on</strong>g> of an <str<strong>on</strong>g>ice</str<strong>on</strong>g> <str<strong>on</strong>g>pad</str<strong>on</strong>g>, that is, involving sea floor material. Shapiro and Metzner (1987)dragged two <strong>large</strong> blocks of sea <str<strong>on</strong>g>ice</str<strong>on</strong>g> up an unfrozen gravel beach with a bulldozer, yieldingstatic and kinetic fricti<strong>on</strong> coefficients of 0.50 and 0.39 respectively. Takeuchi et al. (2003)investigated the fricti<strong>on</strong> between a thin <strong>sand</strong> layer and 95 mm diameter sea <str<strong>on</strong>g>ice</str<strong>on</strong>g> specimens, atdisplacement rates ranging from 3 to 20 mm/sec and with normal loads up to 450 kPa. Theyreported static and kinetic fricti<strong>on</strong> coefficients varying from 0.35 to 0.9 and 0.30 to 0.65,respectively, with temperature and the grain diameter as the most influential parameters.Fricti<strong>on</strong> resistance decreased slightly with an increase in displacement rates and with theadditi<strong>on</strong> of water to the <strong>sand</strong> specimen. In both of these studies, the interacti<strong>on</strong> was assumedto be cohesi<strong>on</strong>less (zero fricti<strong>on</strong> with no vertical load). Barker and Timco (2003) report asmall decrease in kinetic fricti<strong>on</strong> with displacement velocities. The static fricti<strong>on</strong> obtained byUtt and Clark (1980) with small <strong>laboratory</strong> <strong>tests</strong> ranged from 0.85 to 1.47.The experimental program described herein was aimed at simulating, in a <strong>laboratory</strong>envir<strong>on</strong>ment, what is actually taking place in the field. There is no scaling involved. This iswhy the test basin was designed to accommodate an <str<strong>on</strong>g>ice</str<strong>on</strong>g> slab with such a <strong>large</strong> footprint.Moreover, the vertical stresses achieved are realistic: they corresp<strong>on</strong>ded to about 80% ofthose estimated from the Nipterk <str<strong>on</strong>g>ice</str<strong>on</strong>g> <str<strong>on</strong>g>pad</str<strong>on</strong>g> in the Beaufort Sea (Barker and Timco 2004). Giventhe linear behaviour of the force ratios, these results may be extrapolated to significantlyhigher stresses.-181-
Proceedings oh the 18th IAHR Internati<strong>on</strong>alSymposium <strong>on</strong> Ice (2006)CONCLUSIONThe salient results from this study are as follows: 1) The average static and kinetic fricti<strong>on</strong>coefficients are 0.47 (β = 25 o ) and 0.37 (β = 20 o ), respectively; 2) A Coulomb-type fricti<strong>on</strong>behaviour was observed, with an average cohesi<strong>on</strong> force of 1.5 and 1.4 kN for the static andkinetic resp<strong>on</strong>se, respectively, corresp<strong>on</strong>ding to a stress of about 0.5 kPa; 3) Fricti<strong>on</strong>coefficients did not vary with displacement rates used in this test program; 4) Sedimentfreeze-up increased fricti<strong>on</strong> significantly; 5) Most of the horiz<strong>on</strong>tal displacement appears tohave taken place at the <str<strong>on</strong>g>ice</str<strong>on</strong>g>/<strong>sand</strong> interface; and 6) The sediments record extensive evidence ofnormal shear, which is probably linked to the <str<strong>on</strong>g>ice</str<strong>on</strong>g>’s propensity to sink into the <strong>sand</strong> during itstravel.ACKNOWLEDGMENTSThis study was funded by the Program of Energy Research and Development (PERD) throughthe Northern Program at Objective Level (POL). Ed Funke of Comdor Engineering designedthe experimental set-up. M. Sayed provided comments <strong>on</strong> an early versi<strong>on</strong> of the manuscript.REFERENCESBarker, A. and Timco, G.W. (2003), “The fricti<strong>on</strong> coefficient of a <strong>large</strong> <str<strong>on</strong>g>ice</str<strong>on</strong>g> block <strong>on</strong> a<strong>sand</strong>/gravel beach”, 12 th Workshop <strong>on</strong> the Hydraulics of Ice Covered Rivers, CGU HSCommittee <strong>on</strong> River Ice Processes and the Envir<strong>on</strong>ment, Edm<strong>on</strong>t<strong>on</strong>, AB.Barker, A. and Timco, G.W. (2004), “Sliding resistance of grounded spray <str<strong>on</strong>g>ice</str<strong>on</strong>g> islands.” Proc.17 th Symposium <strong>on</strong> Ice (IAHR 2004), St. Petersburg, Russia, pp. 208-216.Barnes, P., Tabor, D. and Walker, J.C.F. (1971), “The fricti<strong>on</strong> and creep of polycrystalline<str<strong>on</strong>g>ice</str<strong>on</strong>g>.” Proc. Roy. Soc. L<strong>on</strong>d., A324, pp.127-155.Frederking, R. and Barker, A. (2002), “Fricti<strong>on</strong> of sea <str<strong>on</strong>g>ice</str<strong>on</strong>g> <strong>on</strong> various c<strong>on</strong>structi<strong>on</strong> materials.”thProc. 16 Symposium <strong>on</strong> Ice (IAHR 2002), Dunedin, New Zealand.Fiorio, B., Meyss<strong>on</strong>nier, J. and Boul<strong>on</strong>, M. (1997), “Experimental study of the fricti<strong>on</strong> of <str<strong>on</strong>g>ice</str<strong>on</strong>g>over c<strong>on</strong>crete at the centimetre <strong>scale</strong>.” Proc. 7 th Int. Offshore Polar Engr. C<strong>on</strong>f. (ISOPE1997), H<strong>on</strong>olulu, USA, pp. 466-472.Kennedy, F.E., Schuls<strong>on</strong>, E.M. and J<strong>on</strong>es, D.E. (2000), “The fricti<strong>on</strong> of <str<strong>on</strong>g>ice</str<strong>on</strong>g> <strong>on</strong> <str<strong>on</strong>g>ice</str<strong>on</strong>g> at lowsliding velocities.” Phil. Mag. A., 80, pp.1093-1110.Pratte, B.D. and Timco, G.W. (1981), “A new model basin for the testing of <str<strong>on</strong>g>ice</str<strong>on</strong>g>-structureinteracti<strong>on</strong>s.” Proc. 6 th Int. C<strong>on</strong>f. Port Ocean Eng. Arctic C<strong>on</strong>d. (POAC 1981), Vol. II,Quebec City, Canada, pp. 857-866.Shapiro, L.H. and Metzner, R.C. (1987), “Coefficients of fricti<strong>on</strong> of sea <str<strong>on</strong>g>ice</str<strong>on</strong>g> <strong>on</strong> beach gravel.”J. Offshore Mech. Arctic Engrg., 109, pp. 388-390.Takeuchi, T., Sasaki M., Miura, K., Sanbe, H., Takahashi, A. (2003), “Coefficients of fricti<strong>on</strong>of sea <str<strong>on</strong>g>ice</str<strong>on</strong>g> <strong>on</strong> <strong>sand</strong>”, Proc. 13 th Int. Offshore Polar Engr. C<strong>on</strong>f. (ISOPE 2003), H<strong>on</strong>olulu,USA, pp. 461-464.Utt, M.E. and Clark, R.A. (1980), “Coefficient of fricti<strong>on</strong> between submerged <str<strong>on</strong>g>ice</str<strong>on</strong>g> and soil”.Amer. Soc. Mech. Eng. Petroleum Divisi<strong>on</strong> Journal, No.80-PET-41, p.1-4.-182-