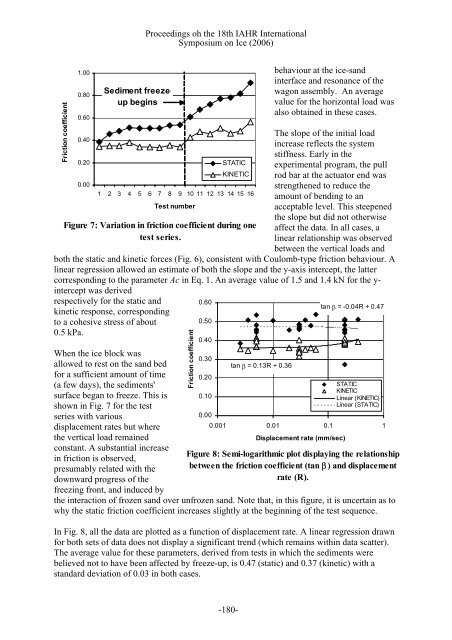
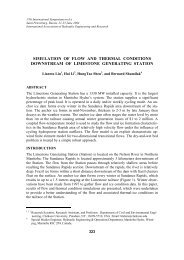
Proceedings oh the 18th IAHR Internati<strong>on</strong>alSymposium <strong>on</strong> Ice (2006)Fricti<strong>on</strong> coefficient1.000.800.600.400.200.00Sediment freezeupbegins1 2 3 4 5 6 7 8 9 10 11 12 13 14 15 16Test numberSTATICKINETICFigure 7: Variati<strong>on</strong> in fricti<strong>on</strong> coefficient during <strong>on</strong>etest series.behaviour at the <str<strong>on</strong>g>ice</str<strong>on</strong>g>-<strong>sand</strong>interface and res<strong>on</strong>ance of thewag<strong>on</strong> assembly. An averagevalue for the horiz<strong>on</strong>tal load wasalso obtained in these cases.The slope of the initial loadincrease reflects the systemstiffness. Early in theexperimental program, the pullrod bar at the actuator end wasstrengthened to reduce theamount of bending to anacceptable level. This steepenedthe slope but did not otherwiseaffect the data. In all cases, alinear relati<strong>on</strong>ship was observedbetween the vertical loads andour. Arboth the static and kinetic forces (Fig. 6), c<strong>on</strong>sistent with Coulomb-type fricti<strong>on</strong> behavilinear regressi<strong>on</strong> allowed an estimate of both the slope and the y-axis intercept, the lattecorresp<strong>on</strong>ding to the parameter Ac in Eq. 1. An average value of 1.5 and 1.4 kN for the y-intercept was derivedrespectively for the static and0.60kinetic resp<strong>on</strong>se, corresp<strong>on</strong>dingto a cohesive stress of about0.500.5 kPa.When the <str<strong>on</strong>g>ice</str<strong>on</strong>g> block wasallowed to rest <strong>on</strong> the <strong>sand</strong> bedfor a sufficient amount of time(a few days), the sediments'icti<strong>on</strong> coefficientFr0.400.300.20tan β = 0.13R + 0.36tan β = -0.04R + 0.47STATICKINETICLinear (KINETIC)Linear (STATIC)surface began to freeze. This is 0.10shown in Fig. 7 for the <strong>tests</strong>eries with various0.00displacement rates but where0.001 0.01 0.1 1the vertical load remainedDispla cement rate (mm/sec)c<strong>on</strong>stant. A substantial increaseFigure 8: Semi-logarithmic plot displaying the relati<strong>on</strong>shipin fricti<strong>on</strong> is observed,presumably related with the between the fricti<strong>on</strong> coefficient (tan β ) and displacem entdownward progress of therate (R).freezing fr<strong>on</strong>t, and induced bythe interacti<strong>on</strong> of frozen <strong>sand</strong> over unfrozen <strong>sand</strong>. Note that, in this figure, it is uncertain as towhy the static fricti<strong>on</strong> coefficient increases slightly at the beginning of the test sequence.In Fig. 8, all the data are plotted as a functi<strong>on</strong> of displacement rate. A linear regressi<strong>on</strong> drawnfor both sets of data does not display a significant trend (which remains within data scatter).The average value for these parameters, derived from <strong>tests</strong> in which the sediments werebelieved not to have been affected by freeze-up, is 0.47 (static) and 0.37 (kinetic) with astandard deviati<strong>on</strong> of 0.03 in both cases.-180-
Proceedings oh the 18th IAHR Internati<strong>on</strong>alSymposium <strong>on</strong> Ice (2006)Vertical moti<strong>on</strong> of the <str<strong>on</strong>g>ice</str<strong>on</strong>g> blockThe readings from the vertical positi<strong>on</strong> transducers showed that the <str<strong>on</strong>g>ice</str<strong>on</strong>g> block always tended tosink into the <strong>sand</strong> column while traveling horiz<strong>on</strong>tally. This penetrati<strong>on</strong>, averaging 10 mm pertest, was generally not uniform. During <strong>on</strong>e test series, for instance, the block shifted about ahoriz<strong>on</strong>tal axis oriented perpendicular to the travel directi<strong>on</strong>. As a result, the leading edge ofthe <str<strong>on</strong>g>ice</str<strong>on</strong>g> block sank more than the opposite <strong>on</strong>e. Since the wag<strong>on</strong> was pushed back to itsstarting positi<strong>on</strong> in the basin up to three times over the course of this test program, blocksinking resulted in a slight downward slope in the <strong>sand</strong> bed in the travel directi<strong>on</strong> (up to 2degrees for the last series). Both the vertical and the horiz<strong>on</strong>tal load data were correctedaccordingly.Sand columnAt the end of test program, the basin was drained and vertical pits were dug into the <strong>sand</strong>, inthe directi<strong>on</strong> of <str<strong>on</strong>g>ice</str<strong>on</strong>g> moti<strong>on</strong> and perpendicular to it. No clear signs of shear (or tangential)stresses (such as overlapping sediment layers or a rotati<strong>on</strong> comp<strong>on</strong>ent) were observed,suggesting that much of the horiz<strong>on</strong>tal displacement took place at the <str<strong>on</strong>g>ice</str<strong>on</strong>g>/<strong>sand</strong> interface.However, evidence for normal stresses was ubiqu itous, in the form of compacti<strong>on</strong>: the spacingbetween the coloured <strong>sand</strong> layers was locally reduced by up to 80%. This compacti<strong>on</strong> couldnot be m<strong>on</strong>itored during the <strong>tests</strong> but it is most li kely linked with the sinking of the slabduring its travel.DISCUSSIONA number of studies have looked at the fricti<strong>on</strong> of <str<strong>on</strong>g>ice</str<strong>on</strong>g> against itself (Kennedy et al. 2000 andreferences therein) or various material (e.g. Barn es et al. 1971, Fiorio et al. 1997, Frederkingand Barker 2002, am<strong>on</strong>gst others). Few addressed the type of interacti<strong>on</strong> relevant to the<str<strong>on</strong>g>stability</str<strong>on</strong>g> of an <str<strong>on</strong>g>ice</str<strong>on</strong>g> <str<strong>on</strong>g>pad</str<strong>on</strong>g>, that is, involving sea floor material. Shapiro and Metzner (1987)dragged two <strong>large</strong> blocks of sea <str<strong>on</strong>g>ice</str<strong>on</strong>g> up an unfrozen gravel beach with a bulldozer, yieldingstatic and kinetic fricti<strong>on</strong> coefficients of 0.50 and 0.39 respectively. Takeuchi et al. (2003)investigated the fricti<strong>on</strong> between a thin <strong>sand</strong> layer and 95 mm diameter sea <str<strong>on</strong>g>ice</str<strong>on</strong>g> specimens, atdisplacement rates ranging from 3 to 20 mm/sec and with normal loads up to 450 kPa. Theyreported static and kinetic fricti<strong>on</strong> coefficients varying from 0.35 to 0.9 and 0.30 to 0.65,respectively, with temperature and the grain diameter as the most influential parameters.Fricti<strong>on</strong> resistance decreased slightly with an increase in displacement rates and with theadditi<strong>on</strong> of water to the <strong>sand</strong> specimen. In both of these studies, the interacti<strong>on</strong> was assumedto be cohesi<strong>on</strong>less (zero fricti<strong>on</strong> with no vertical load). Barker and Timco (2003) report asmall decrease in kinetic fricti<strong>on</strong> with displacement velocities. The static fricti<strong>on</strong> obtained byUtt and Clark (1980) with small <strong>laboratory</strong> <strong>tests</strong> ranged from 0.85 to 1.47.The experimental program described herein was aimed at simulating, in a <strong>laboratory</strong>envir<strong>on</strong>ment, what is actually taking place in the field. There is no scaling involved. This iswhy the test basin was designed to accommodate an <str<strong>on</strong>g>ice</str<strong>on</strong>g> slab with such a <strong>large</strong> footprint.Moreover, the vertical stresses achieved are realistic: they corresp<strong>on</strong>ded to about 80% ofthose estimated from the Nipterk <str<strong>on</strong>g>ice</str<strong>on</strong>g> <str<strong>on</strong>g>pad</str<strong>on</strong>g> in the Beaufort Sea (Barker and Timco 2004). Giventhe linear behaviour of the force ratios, these results may be extrapolated to significantlyhigher stresses.-181-