ice pad stability on sand: large-scale laboratory tests
ice pad stability on sand: large-scale laboratory tests
ice pad stability on sand: large-scale laboratory tests

You also want an ePaper? Increase the reach of your titles
YUMPU automatically turns print PDFs into web optimized ePapers that Google loves.
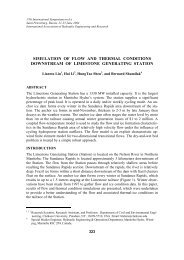
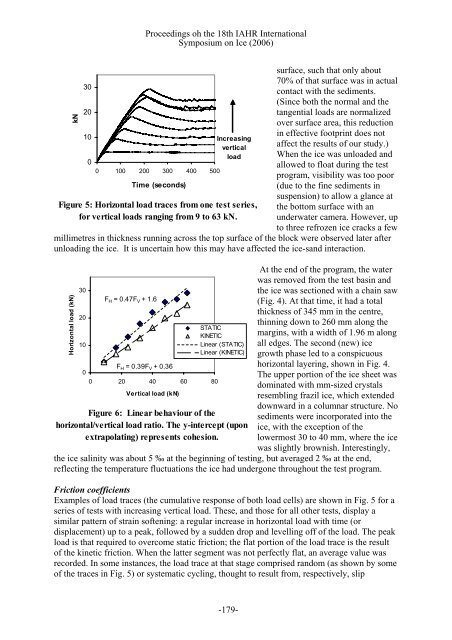
Proceedings oh the 18th IAHR Internati<strong>on</strong>alSymposium <strong>on</strong> Ice (2006)kN30201000 100 200 300 400 500Time (sec<strong>on</strong>ds)IncreasingverticalloadFigure 5: Horiz<strong>on</strong>tal load traces from <strong>on</strong>e test series,for vertical loads ranging from 9 to 63 kN.surface, such that <strong>on</strong>ly about70% of that surface was in actualc<strong>on</strong>tact with the sediments.(Since both the normal and thetangential loads are normalizedover surface area, this reducti<strong>on</strong>in effective footprint does notaffect the results of our study.)When the <str<strong>on</strong>g>ice</str<strong>on</strong>g> was unloaded andallowed to float during the testprogram, visibility was too poor(due to the fine sediments insuspensi<strong>on</strong>) to allow a glance atthe bottom surface with anunderwater camera. However, upto three refrozen <str<strong>on</strong>g>ice</str<strong>on</strong>g> cracks a fewmillimetres in thickness running across the top surface of the block were observed later afterunloading the <str<strong>on</strong>g>ice</str<strong>on</strong>g>. It is uncertain how this may have affected the <str<strong>on</strong>g>ice</str<strong>on</strong>g>-<strong>sand</strong> interacti<strong>on</strong>.)Horiz<strong>on</strong>tal load (kN302010F H = 0.47F V + 1.6F H = 0.39F V + 0.3600 20 40 60 80Vertical load (kN)STATICKINETICLinear (STATIC)Linear (KINETIC)Figure 6: Linear behaviour of thehoriz<strong>on</strong>tal/vertical load ratio. The y-intercept (up<strong>on</strong>extrapolating) represents cohesi<strong>on</strong>.the <str<strong>on</strong>g>ice</str<strong>on</strong>g> salinity was about 5 ‰ at the beginning of testing, bureflecting the temperature fluctuati<strong>on</strong>s the <str<strong>on</strong>g>ice</str<strong>on</strong>g> had underg<strong>on</strong>eAt the end of the program, the waterwas removed from the test basin andthe <str<strong>on</strong>g>ice</str<strong>on</strong>g> was secti<strong>on</strong>ed with a chain saw(Fig. 4). At that tim e, it had a totalthickness of 345 mm in the centre,thinning down to 260 mm al<strong>on</strong>g themarg ins, with a width of 1.96 m al<strong>on</strong>gall edges. The sec<strong>on</strong>d (new) <str<strong>on</strong>g>ice</str<strong>on</strong>g>growth phase led to a c<strong>on</strong>spicuoushoriz<strong>on</strong>tal layering, shown in Fig. 4.The upper porti<strong>on</strong> of the <str<strong>on</strong>g>ice</str<strong>on</strong>g> sheet wasdominated with mm-sized crystalsresembling frazil <str<strong>on</strong>g>ice</str<strong>on</strong>g>, which extendeddown ward in a columnar structure. Nosediments were incorporated into the<str<strong>on</strong>g>ice</str<strong>on</strong>g>, with the excepti<strong>on</strong> of thelowermost 30 to 40 mm, where the <str<strong>on</strong>g>ice</str<strong>on</strong>g>was slightly brownish. Interestingly,t averaged 2 ‰ at the end,throughout the test program.Fricti<strong>on</strong> coefficientsExamples of load traces (the cumulative resp<strong>on</strong>se of both load cells) are shown in Fig. 5 for aseries of <strong>tests</strong> with increasing vertical load. These, and those for all other <strong>tests</strong>, display asimilar pattern of strain softening: a regular increase in horiz<strong>on</strong>tal load with time (ordisplacement) up to a peak, followed by a sudden drop and levelling off of the load. The peakload is that required to overcome static fricti<strong>on</strong>; the flat porti<strong>on</strong> of the load trace is the resultof the kinetic fricti<strong>on</strong>. When the latter segment was not perfectly flat, an average value wasrecorded. In some instances, the load trace at that stage comprised random (as shown by someof the traces in Fig. 5) or systematic cycling, thought to result from, respectively, slip-179-