M1, M2, M3 and M4 - Canadian Coast Guard
M1, M2, M3 and M4 - Canadian Coast Guard
M1, M2, M3 and M4 - Canadian Coast Guard
You also want an ePaper? Increase the reach of your titles
YUMPU automatically turns print PDFs into web optimized ePapers that Google loves.
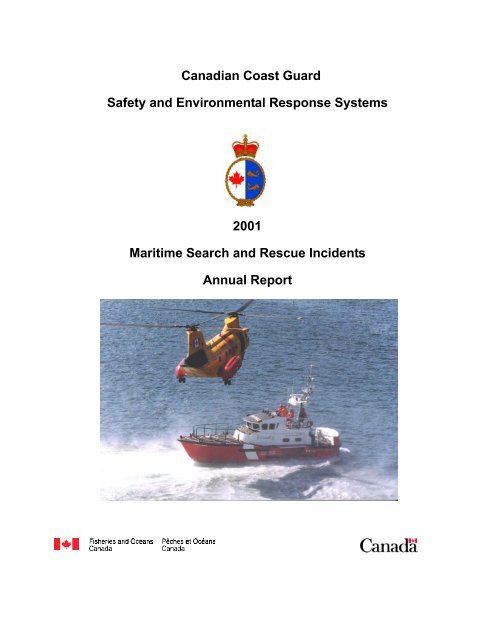
<strong>Canadian</strong> <strong>Coast</strong> <strong>Guard</strong>Safety <strong>and</strong> Environmental Response Systems2001Maritime Search <strong>and</strong> Rescue IncidentsAnnual Report
TABLE OF CONTENTSINTRODUCTION ..........................................................................................................................3TECHNICAL TERMS AND ACRONYMS ...............................................................................................4SUMMARY OF SAR INCIDENTS – 2001 – CHART ....................................................................5SUMMARY OF SAR INCIDENTS – 2001.....................................................................................6PEOPLE ASSISTED IN 2001 .......................................................................................................7TABLE 1 - TOTAL NUMBER OF LIVES SAVED AND LIVES LOST (M, A, H-1 & H-2 INCIDENTS). .82001 MARITIME INCIDENTS BY MONTH ...................................................................................9CHART 1 – NUMBER OF INCIDENTS PER MONTH (<strong>M1</strong>, <strong>M2</strong>, <strong>M3</strong> AND <strong>M4</strong>) ......................................95 YEAR TREND..........................................................................................................................10CHART 2 - TOTAL NUMBER OF SEARCH AND RESCUE INCIDENTS (M,H,A & U).......................10PERFORMANCE MEASUREMENT ...........................................................................................11A. OUTCOME: MINIMIZE LOSS OF LIFE AND INJURIES......................................................12CHART 3 – SAR SYSTEM EFFECTIVENESS PER YEAR (MARITIME SAR INCIDENTS)..............12B. OUTCOME: NUMBER AND SEVERITY OF MARITIME SAR INCIDENTS. ........................13CHART 4 – NUMBER AND SEVERITY OF MARITIME SAR INCIDENTS. ........................................13C. OUTPUT: CCG AUXILIARY INVOLVEMENT ......................................................................14CHART 6 - NUMBER OF CCGA MEMBERS:......................................................................................14CHART 7 - NUMBER OF CCGA VESSELS ........................................................................................15CHART 8 - VALUE OF CCGA VESSELS ............................................................................................15CHART 9 - NUMBER OF PLEASSURE CRAFT COURTESY CHECKS ( PCCCS) BY CCGA.........16CHART 10- NUMBER OF TASKINGS OF CCGA................................................................................16CHART 11- NUMBER OF BOATSHOWS ATTENDED BY CCGA ......................................................17D. OUTPUT: SAR COVERAGE.................................................................................................18CHART 12 – REGIONAL PRIMARY SAR COVERAGE BY CCG PATROL-MODE VESSELS. .........18E. OUTPUT: SAR REACTION TIME .........................................................................................18CHART 13 – AVERAGE REACTION TIME BY REGION (IN MINUTES) ............................................18VESSELS ASSISTED - TYPES & CAUSES OF MARITIME INCIDENTS.................................19TABLE 2 - MARITIME INCIDENTS – NATIONALLY (<strong>M1</strong>, <strong>M2</strong>, <strong>M3</strong>, AND <strong>M4</strong>) .....................................19TABLE 3 - TYPES OF MARITIME INCIDENTS ...................................................................................20TABLE 3A - TYPES OF MARITIME INCIDENTS IN ORDER OF FREQUENCY ................................21TABLE 4 - CAUSES OF MARITIME INCIDENTS IN ORDER OF FREQUENCY .............................22SAR TASKING PROFILE ...........................................................................................................231
CHART 14(A) - 2001 SAR TASKING PROFILE BY DISTRIBUTION OF ALL RESOURCES FORMARITIME INCIDENTS ONLY (<strong>M1</strong>, <strong>M2</strong>, <strong>M3</strong>, <strong>M4</strong>) ...............................................................................23CHART 14(B) - 2001 SAR TASKING PROFILE BY DISTRIBUTION OF ALL RESOURCES FORNON-MARITIME INCIDENTS (A, H, U) ..............................................................................................23TABLE 5 - SAR TASKING PROFILE DISTRIBUTION OF CCG & DFO RESOURCES......................24SAR REGIONS, JRCCS/MRSCS AND REGIONAL SAR AREAS .............................................25REGIONAL SAR AREAS............................................................................................................26CHART -15 EAST COAST / ATLANTIC..............................................................................................26CHART - 15A QUEBEC / GULF OF THE ST LAWERENCE..............................................................27CHART - 15B CENTRAL CANADA, ARCTIC & GREAT LAKES AREAS ..........................................28CHART 15C - WEST COAST / PACIFIC ............................................................................................29TABLE 6 - NUMBER OF MARITIME SAR INCIDENTS BY SAR AREA (<strong>M1</strong>, <strong>M2</strong>, <strong>M3</strong>, <strong>M4</strong>)..............30SAR REGIONS (SRR) ................................................................................................................32CHART 16 - HALIFAX SRR .................................................................................................................32HALIFAX SRR ......................................................................................................................................33CHART 16A - TRENTON SRR.............................................................................................................34TRENTON SRR....................................................................................................................................35CHART 16B - VICTORIA SRR.............................................................................................................36VICTORIA SRR ....................................................................................................................................37NEWFOUNDLAND REGION .....................................................................................................38CHART 17 - MRSC ST. JOHN’S..........................................................................................................38MRSC ST. JOHNS ..............................................................................................................................39MARITIME REGION ...................................................................................................................40CHART 17A - JRCC HALIFAX .............................................................................................................40JRCC HALIFAX ....................................................................................................................................41QUÉBEC REGION......................................................................................................................42CHART 17B - MRSC QUÉBEC...........................................................................................................42MRSC QUÉBEC...................................................................................................................................43CENTRAL & ARCTIC REGION ..................................................................................................44CHART 17C – JRCC TRENTON..........................................................................................................44CENTRAL & ARCTIC REGION - JRCC TRENTON ............................................................................45PACIFIC REGION.......................................................................................................................46CHART 17D – JRCC VICTORIA..........................................................................................................46JRCC VICTORIA ..................................................................................................................................47CHART 18 - 2001 MARITIME INCIDENTS – COMPARISON BY CCG REGION...............................48CANADIAN COAST GUARD SAR RESOURCES......................................................................49GLOSSARY OF TERMS.............................................................................................................512
INTRODUCTIONThis publication provides information on all of the SAR incidents that have occurredwithin the Department of Fisheries <strong>and</strong> Oceans area of responsibility. It also includesSAR incidents in areas of international responsibility where <strong>Canadian</strong> federal assistancewas required.These statistics were generated from data in the computerized SAR database (SISAR)maintained at <strong>Coast</strong> <strong>Guard</strong> Headquarters. It was compiled with information obtainedfrom reports originating from Joint Rescue Co-ordination Centres <strong>and</strong> Maritime RescueSub-Centres (JRCCs <strong>and</strong> MRSCs), <strong>and</strong> other information sources. In 1994, aMemor<strong>and</strong>um of Underst<strong>and</strong>ing was signed between the <strong>Canadian</strong> Forces AirComm<strong>and</strong> (AIRCOM) <strong>and</strong> the <strong>Canadian</strong> <strong>Coast</strong> <strong>Guard</strong> (CCG) to implement SISAR in theJRCCs <strong>and</strong> MRSCs. The extra data captured by AIRCOM is reflected in this summary.The selection of statistics to display in this publication was based on the frequency ofpast use.The source of information for these reports is continually being improved, in order toachieve a more in-depth underst<strong>and</strong>ing of the relevant underlying factors <strong>and</strong> the role<strong>and</strong> effectiveness of participating units in resolving incidents of all types.In line with the government’s Management for Results initiative, <strong>and</strong> the SAR Program’sResults Based Management Accountability Framework, the scope of the data collectedhas changed. We have added two variables – SAR Coverage <strong>and</strong> Reaction time. SARCoverage is the amount of time a vessel assigned to primary SAR duties is in theplanned area; future measures will add more criteria. Reaction time is the difference intime between when a SAR resource is tasked <strong>and</strong> when the resource departs for thetasking. Resources at sea will have zero as this measure. Performance Measurementis an iterative process <strong>and</strong> will improve over time.The statistics are not intended to be an all-inclusive description of <strong>Coast</strong> <strong>Guard</strong> Search<strong>and</strong> Rescue activities.3
SUMMARY OF SAR INCIDENTS – 2001 – CHART<strong>M1</strong> Cases (334)<strong>M2</strong> Cases (624)<strong>M3</strong> Cases (4308)<strong>M4</strong> Cases (1188)Total Maritime Incidents (<strong>M1</strong> + <strong>M2</strong> + <strong>M3</strong> + <strong>M4</strong>) = 64545
SUMMARY OF SAR INCIDENTS – 2001Incident Total – 8235 recorded by <strong>Coast</strong> <strong>Guard</strong> SAR authorities. (M+A+H+U)Maritime Incidents (<strong>M1</strong> + <strong>M2</strong> + <strong>M3</strong> + <strong>M4</strong>) = 6454• <strong>M1</strong> – Distress Incidents – 334 representing 5.17% of maritime incidents.• <strong>M2</strong> – Potential Distress Incidents – 624 representing 9.67% of maritime incidents.• <strong>M3</strong> – Incidents Resolved in the Uncertainty Phase – 4308 representing 66.75% ofmaritime incidents.• <strong>M4</strong> – False Alarms <strong>and</strong> Hoaxes – 1188 representing 18.41% of maritime incidentsOther Incidents (A + H + U) = 1781Aeronautical – 729Humanitarian – 625Unknown – 427• Distress Incidents – 325 representing 18.25% of other incidents.• Potential Distress Incidents – 229 representing 12.86% of other incidents.• Incidents Resolved in the Uncertainty Phase – 304 representing 17.07% of otherincidents• False Alarms <strong>and</strong> Hoaxes – 923 representing 51.82% of other incidents.6
2001 MARITIME INCIDENTS BY MONTHCHART 1 – NUMBER OF INCIDENTS PER MONTH (<strong>M1</strong>, <strong>M2</strong>, <strong>M3</strong> AND <strong>M4</strong>)160014001200Number of Incidents10008006004002000J F M A M J J A S O N DDistress 12 11 12 23 32 48 63 55 25 23 17 13Potential Distress 16 11 30 34 71 86 118 114 49 55 17 23Non Distress 65 53 75 195 384 681 1033 968 468 169 114 103False Alarms / Hoax 56 33 51 67 113 124 220 205 114 75 58 72Total 149 108 168 319 600 939 1434 1342 656 322 206 211MonthTotal Maritime Incidents (<strong>M1</strong> + <strong>M2</strong> + <strong>M3</strong> + <strong>M4</strong>) = 64549
5 YEAR TRENDCHART 2 - TOTAL NUMBER OF SEARCH AND RESCUE INCIDENTS (M,H,A & U)90008000700060005000400030002000100001997 1998 1999 2000 2001Distress 684 681 697 707 659Potential Distress 799 885 929 1030 853Non-Distress 3638 3762 4430 4286 4612False Alarm/Hoax 1596 1589 2003 1885 2111Total Incidents 6717 6917 8059 7908 8235Note:The number of False Alarms / Hoaxes cases increased by 26% or 414 (<strong>M4</strong>) cases between1998 <strong>and</strong> 1999. This increase is attributable to the implementation of GMDSS data in 1999.10
PERFORMANCE MEASUREMENTThe purpose of Performance Measurement is to measure or enhance the measurementof performance in DFO, track <strong>and</strong> monitor results, promote the use of performanceinformation in our every day decision-making, <strong>and</strong> report on the achievement ofcommitments, priorities <strong>and</strong> objectives to Senior Management, Parliament <strong>and</strong> to DFO’sclients.In order to do this for SAR, a number of performance areas were identified. In thefollowing section we will define those performance areas, the target, how each wasmeasured, <strong>and</strong> the results.As this is a relatively new practice, there are a couple of performance areas whichcannot be reported on as of yet due to unavailabilty of information. We will endeavourto collect data on those areas in order to be able to report on them in the future.11
A. OUTCOME: MINIMIZE LOSS OF LIFE AND INJURIESThe objective of the SAR System is to save 100% of Lives at Risk in Distress <strong>and</strong>Potential Distress.Lives at Risk, including Lives Saved <strong>and</strong> Lives Lost, are counted in Distress <strong>and</strong>Potential Distress incidents only. All other incidents are lives assisted only.This is defined as the Lives saved versus the lives at riskThe International definition of lives at risk, lives lost, <strong>and</strong> lives saved is slightly different tothat used in Canada. The International Aeronautical <strong>and</strong> Maritime Search <strong>and</strong> Rescue(IAMSAR) Manual, Volume I, paragraph 5.6.9 states:“ Lives lost before SAR system notification were not saveable; therefore, they are exludedfrom the life-saving effectiveness measure. Lives lost after notification reflect the potentialnumber of additional lives that may have been saved. Studies suggest that about onethird of the deaths that occur after SAR system notification happen soon thereafter beforehelp can arrive, or due to such serious injury or sickness that saving life was not possible.The remaining lives lost may be attributed to a less than optimal SAR system.”The <strong>Canadian</strong> system measures all lives lost, not just those lost after notification of theincident. We feel that lives lost, even before notification, indicate the effectiveness of theSAR system by demonstrating a level of prevention, as well as a level of response. Theestablished SAR Program level of service is 90%.Nationally, 97.33 % percent of lives at risk were saved in the year 2001 (Maritimeincidents only). The five year average is 97.31%.The five year trend for the SAR system effectiveness is as follows:CHART 3 – SAR SYSTEM EFFECTIVENESS PER YEAR (MARITIME SAR INCIDENTS)12
B. OUTCOME: NUMBER AND SEVERITY OF MARITIME SARINCIDENTS.This will be measured by the number of incidents <strong>and</strong> the distribution between <strong>M1</strong>, <strong>M2</strong>,<strong>M3</strong>, <strong>and</strong> <strong>M4</strong> type incidents over five (5) years.CHART 4 – NUMBER AND SEVERITY OF MARITIME SAR INCIDENTS.Note: Refer to note in CHART 2 – FIVE YEAR TREND – re: GMDSS implementation in 1999.13
C. OUTPUT: CCG AUXILIARY INVOLVEMENTThe <strong>Canadian</strong> <strong>Coast</strong> <strong>Guard</strong> Auxiliary (CCGA) is a highly effective volunteer organizationthat assists the <strong>Coast</strong> <strong>Guard</strong> in SAR response <strong>and</strong> prevention acitivities. Theinvolvement of the CCGA in the National SAR Program is measured as follows:CHART 6 - NUMBER OF CCGA MEMBERS:5500500045004000350030001995 1996 1997 1998 1999 2000 2001# of CCGA Members 3348 3443 3986 4097 4663 4523 466614
CHART 7 - NUMBER OF CCGA VESSELS180016001400120010001995 1996 1997 1998 1999 2000 2001# of CCGA Vessels 1321 1278 1399 1461 1535 1592 1432CHART 8 - VALUE OF CCGA VESSELS$300,000,000.00$250,000,000.00$200,000,000.001998 1999 2000 2001Value of CCGA Vessels $216,813,688.00 $254,715,022.00 $268,374,805.00 $285,834,226.00NOTE: As a result of CCGA-Pacific’s Fleet Modernization efforts in 2001, a number of CCGA vessels were dis-enrolled.Consequently, the number of vessels in CCGA Pacific's Fleet decreased (CHART 7).During this same time period, CCGA memberships increased in Newfoundl<strong>and</strong> <strong>and</strong> Maritimes, which included a significantnumber of high-valued commercial fishing vessels. As a result, nationally the number of CCGA vessels decreased, but theoverall value of the CCGA fleet increased. (CHART8).15
CHART 9 - NUMBER OF PLEASSURE CRAFT COURTESY CHECKS ( PCCCS) BYCCGACHART 10- NUMBER OF TASKINGS OF CCGANote: A SAR tasking is defined as a request for a vessel or aircraft to render assistance during a SAR incident.In some instances, more than one vessel/aircraft may be actioned to render assistance to an incident. Therefore,the number of vessels that responded to assist may be greater than the actual total number of incidents.In 2001, there were a total of 6454 Maritime SAR incidents. During this time period, CCGA vessels were taskeda total of 1842 times to 1714 incidents. The CCG acknowledges the CCGA’s valuable contribution to the SARSystem.16
CHART 11- NUMBER OF BOATSHOWS ATTENDED BY CCGA17
D. OUTPUT: SAR COVERAGEThe target for SAR Coverage is 100%. This is currently measured by the number ofdays each month, a resource that is assigned to as primary SAR, is in the planned area.As we have just begun tracking this, a 5 year average will be reported when the data isavailable. The data only applies to CCG vessels providing Primary Patrol-Mode SARcoverage. In the future we will exp<strong>and</strong> our reporting to cover CCG vessels providingPrimary Station-Mode SAR coverage as well. Nationally, our SAR Coverage is 87.00%.This is broken up regionally as follows:CHART 12 – REGIONAL PRIMARY SAR COVERAGE BY CCG PATROL-MODEVESSELS.100%80%60%40%20%0%Percentage of SARCoverage %Pacific Québec Maritimes Newfoundl<strong>and</strong>93% 87% 76% 93%E. OUTPUT: SAR REACTION TIMEReaction time is defined as the difference in time between when a SAR resource istasked <strong>and</strong> when the resource departs for the tasking. All primary SAR vessels arerequired to have a maximum reaction time of 30 minutes. The national average reactiontime is 11.4 minutes.Regionally, the average reaction time is broken up as follows:CHART 13 – AVERAGE REACTION TIME BY REGION (IN MINUTES)3020100Pacific Central & Arctic Québec Maritimes Newfoundl<strong>and</strong>Reaction Time 13 6 5 12 21Region18
VESSELS ASSISTED - TYPES & CAUSES OF MARITIME INCIDENTSTABLE 2 - MARITIME INCIDENTS – NATIONALLY (<strong>M1</strong>, <strong>M2</strong>, <strong>M3</strong>, AND <strong>M4</strong>)Type#Vessels%LivesSavedLivesLost/MissingMostCommonIncidentTypePleasure CraftPersonal Watercraft 126 2.96 35 1 DisabledCanoe/Kayak 218 5.11 132 8 CapsizedOpen Boat 242 5.68 125 1 DisabledMotorcraft 2705 63.47 789 13 DisabledSailcraft 908 21.3 247 6 DisabledSailboard 63 1.48 21 0 DisabledTotal Pleasure Craft 4262 100 1349 29Fishing VesselsFishing Vessel GT>15 GRT 653 47.39 376 4 DisabledFishing Vessel GT12.2m 209 15.17 96 6 DisabledFishing Vessel GRT
TABLE 3 - TYPES OF MARITIME INCIDENTSTotal number of Maritime Incidents in 2001 = 6454350032993250300027502500225020001750150012501199100073775050025023821620420194925245372513 20DisabledFalse AlarmGroundedMedicalCapsizedOtherTaking on WaterDisorientedOn FireFounderedMan OverboardStr<strong>and</strong>edPerson in WaterMissing Person(s)Suicide Attempt20
TABLE 3A - TYPES OF MARITIME INCIDENTS IN ORDER OF FREQUENCYNote:Types of Maritime Incidents (i.e. <strong>M1</strong>, <strong>M2</strong>, <strong>M3</strong>, <strong>and</strong> <strong>M4</strong>) are reported in order of mostfrequent to least frequent in occurrence.Incident Type Total % Total Saved Total Lost &MissingDisabled 3299 51.12% 637 0False Alarm 1199 18.58% 0 0Grounded 737 11.42% 244 0Medical 238 3.69% 225 5Capsized 216 3.35% 325 24Other 204 3.16% 295 6Taking on Water 201 3.11% 401 1Disoriented 94 1.46% 14 0On Fire 92 1.43% 299 0Foundered 52 0.81% 112 11Man Overboard 45 0.70% 50 18Str<strong>and</strong>ed 37 0.57% 24 0Person in Water 25 0.39% 30 5Missing Person(s) 13 0.20% 5 3Suicide Attempt 2 0.03% 2 06454 100.00% 2663 7321
TABLE 4 - CAUSES OF MARITIME INCIDENTS IN ORDER OF FREQUENCYNote:Causes of Maritime Incidents (<strong>M1</strong>, <strong>M2</strong>, <strong>M3</strong>, <strong>and</strong> <strong>M4</strong>) are reported in order of mostfrequent to least frequent in occurrenceIn order of most to least frequent TOTAL %Mechanical Failure 2424 37.56%Unknown 702 10.88%Navigational Error 455 7.05%Mistaken Belief 443 6.86%Other 424 6.57%Weather 348 5.39%Out of Fuel 271 4.20%Propeller Fouled 165 2.56%Electrical Failure 162 2.51%Lack of Knowledge 153 2.37%Adrift (No POB-Persons onboard) 134 2.08%Illness 132 2.05%Accidental Activation 118 1.83%Failure to Report 101 1.56%Injury 85 1.32%Hull/Rigging Failure 70 1.08%Collision with Object 49 0.76%Hoax 41 0.64%Fatigue 33 0.51%Ice 33 0.51%Tides/Currents 29 0.45%Suspected Drug/Alcohol 22 0.34%Overload/Stability 20 0.31%Dangerous Piloting 16 0.25%Collision with Ship 15 0.23%Suicide or Attempt 6 0.09%Poor Maintenance 2 0.03%Cargo Shift 1 0.02%6454 100.00%22
SAR TASKING PROFILEIn 2001, 9076 taskings were initiated to respond to 8235 SAR incidents, which included6454 maritime incidents. A SAR tasking is defined as a request for a vessel or aircraftto render assistance during a SAR incident. More than one vessel/aircraft may beactioned to render assistance to an incident.CHART 14(A) - 2001 SAR TASKING PROFILE BY DISTRIBUTION OF ALLRESOURCES FOR MARITIME INCIDENTS ONLY (<strong>M1</strong>, <strong>M2</strong>, <strong>M3</strong>, <strong>M4</strong>)CHART 14(B) - 2001 SAR TASKING PROFILE BY DISTRIBUTION OF ALLRESOURCES FOR NON-MARITIME INCIDENTS (A, H, U)23
TABLE 5 - SAR TASKING PROFILE DISTRIBUTION OF CCG & DFO RESOURCESResourceVessel TypeDescription# ofTaskings% ofTaskingsIRB Inshore Rescue Boat 1083 21.64%Lifeboats(Type 100, 300s & 47ft)Multi Task Lifeboats <strong>and</strong> Utility Craft 1061 21.20%FRC Fast Rescue Craft 928 18.54%100 Small Multi Task Utility Craft 734 14.67%ACV Air Cushion Vehicle (Hovercraft) 301 6.01%400 Small Multi-Task Cutter 297 5.93%DFO - C&P Inshore <strong>and</strong> Offshore Fishery Patrol Vessels. 148 2.96%1100 Major Navaids Tender / Light Icebreaker 105 2.10%DFO - SCIENCE Survey <strong>and</strong> Research Vessels 71 1.42%500 Intermediate Multi Task Cutter 44 0.88%600 Offshore Ice Strengthened Mulit Task Cutter 42 0.84%1000 Ice Strengthened Medium Navaids Tender 40 0.80%800 Small Navaids Tender 36 0.72%1200 Medium Gulf / River Icebreaker 30 0.60%1050 Medium Navaids Tender / Light Icebreaker 21 0.42%200 Small Multi Task Ice Strengthened Cutter 15 0.30%700 Special River Navaids Tender 4 0.08%1300 Heavy Gulf Icebreaker 2 0.04%For further information on the <strong>Canadian</strong> <strong>Coast</strong> <strong>Guard</strong> Fleet, please visit our web site at:http://www.ccg-gcc.gc.ca/vessels-navires/main_e.asp24
SAR REGIONS, JRCCS/MRSCS AND REGIONAL SAR AREASWithin international agreements for maritime SAR, Canada has three SAR Regions(SRRs): Halifax SRR, Trenton SRR, <strong>and</strong> Victoria SRR, the total area of which extendsfrom the Canada/US border to the North Pole <strong>and</strong> from approximately 800 nauticalmiles in the Pacific Ocean to 1000 nautical miles in the Atlantic Ocean.SAR REGION BOUNDARIESTRENTON SRRVICTORIA SRRHALIFAX SRRThe <strong>Canadian</strong> <strong>Coast</strong> <strong>Guard</strong> jointly staffs three Joint Rescue Co-ordination Centres(JRCCs) with the <strong>Canadian</strong> Forces. The JRCCs are located in Victoria, BritishColumbia; Trenton, Ontario; <strong>and</strong> Halifax, Nova Scotia. Each JRCC is responsible forthe planning, co-ordination, conduct <strong>and</strong> control of aeronautical <strong>and</strong> maritime SARoperations within their SRR. Two Maritime Rescue Sub-centres (MRSCs) in QuébecCity, Québec <strong>and</strong> St. John’s, Newfoundl<strong>and</strong> assist the JRCCs workload in areas of highmarine activity.25
REGIONAL SAR AREASCHART -15 EAST COAST / ATLANTICMARITIME REGIONNEWFOUNDLAND REGION26
CHART - 15A QUEBEC / GULF OF THE ST LAWERENCE27
CHART - 15B CENTRAL CANADA, ARCTIC & GREAT LAKES AREAS28
CHART 15C - WEST COAST / PACIFIC29
TABLE 6 - NUMBER OF MARITIME SAR INCIDENTS BY SAR AREA(<strong>M1</strong>, <strong>M2</strong>, <strong>M3</strong>, <strong>M4</strong>)Region Rank SARAreaSAR Area Descriptive NameNumber ofIncidentsper SARAreaMaritime 1 004 Gulf of St. Lawrence (East of Anticosti Is.) 5112 007 Southwestern Shore (N.S.) 4093 006 Bay of Fundy (N.S.) 1534 008 Eastern Shore (N.S.) 885 005 Cape Breton (N.S.) (North East <strong>Coast</strong>) 776 011 Northwest Atlantic 271265Newfoundl<strong>and</strong> 1 033 East <strong>Coast</strong> (Nfld.) 1452 032 North East <strong>Coast</strong> (Nfld.) 1283 034 Outside <strong>Canadian</strong> Waters 1254 031 West <strong>Coast</strong> (Nfld.) 365 009 Labrador <strong>Coast</strong> 24457Québec 1 140 Cornwall to Grondines 8752 141 Grondines to Cap à L'Aigle (Saguenay River included) 1353 001 Cap à L'Aigle to Sept Îles 734 002 Sept-Îles to Blanc Sablon(Gaspésie & Île de la Madeleine included)50113330
Region Rank SARAreaSAR Area Descriptive NameNumber ofIncidentsper SARAreaCentral & Arctic 1 105 Lake St. Claire/Detroit River 2172 107 Eastern Lake Erie 2003 108 Western Lake Ontario 1914 103 Georgian Bay 1245 109 Eastern Lake Ontario 1166 110 Gananoque to Cornwall (Ont.) 767 104 Lake Huron 588 106 Western Lake Erie 559 200 Lake Winnipeg * 5010 102 North Channel St. Mary's River 4011 100 Western Lake Superior 2812 101 Eastern Lake Superior 1013 155 Hudson Bay/James Bay 914 260 High Arctic 7* Note: SAR AREA 200 - Lake Winnipeg – (H) Incidents Only1181Pacific 1 303 Southern Strait of Georgia (B.C.) 5762 304 Northern Strait of Georgia (B.C.) 4053 302 Gulf Isl<strong>and</strong>s (B.C.) 2664 301 Juan de Fuca Strait (B.C.) 2535 305 Central <strong>Coast</strong> (B.C.) 2466 306 North <strong>Coast</strong> (B.C.) 2197 307 West <strong>Coast</strong> Vancouver Isl<strong>and</strong> 1868 308 Pacific Offshore 202171Note: Though Canada’s Joint Rescue Co-ordination Centers (JRCCs) <strong>and</strong> Maritime Rescue Sub-centres(MRSCs) provided assistance to waters external to <strong>Canadian</strong> International boundaries, the dataprovided above only include those waters which are within the <strong>Canadian</strong> <strong>Coast</strong> <strong>Guard</strong>’s area ofresponsibility31
SAR REGIONS (SRR)CHART 16 - HALIFAX SRR*Including JRCC Halifax, MRSC Québec <strong>and</strong> MRSC St. John’s<strong>M1</strong> Cases (123)<strong>M2</strong> Cases (179)<strong>M3</strong> Cases (1377)<strong>M4</strong> Cases (327)32
HALIFAX SRRJRCC Halifax, MRSC Québec <strong>and</strong> MRSC St. John’sThe objective of the SAR System is to save 100% of Lives at Risk in Distress <strong>and</strong>Potential Distress Incidents. Of the 2006 maritimes incidents incidents that occurred inthe Halifax SRR, 97.66% of the Lives at Risk were saved in 2001.Maritime Incidents (<strong>M1</strong> +<strong>M2</strong> +<strong>M3</strong> +<strong>M4</strong>) – 2006• <strong>M1</strong> – Distress Incidents – 123 representing 6.13 % of maritime incidents.• <strong>M2</strong> – Potential Distress Incidents – 179 representing 8.92 %of maritime incidents.• <strong>M3</strong> – Incidents resolved in the Uncertainty Phase – 1377 representing 68.64 % of maritime incidents.• <strong>M4</strong> – False Alarms <strong>and</strong> Hoaxes – 327 representing 16.30 % of maritime incidentsPeople AssistedLives at Risk• Lives Saved – 1004• Lives Lost – 24Total People assisted, including general calls for assistance – 6638Other Incidents (A + H + U) = 386• Distress Incidents – 57 representing 14.77% of other incidents.• Potential Distress Incidents – 43 representing 10.88% of other incidents.• Incidents resolved in the Uncertainty Phase – 112 representing 29.02% of other incidents• False Alarms <strong>and</strong> Hoaxes – 175 representing 45.34% of other incidents.People AssistedLives at Risk• Lives Saved – 392• Lives Lost – 30Total People assisted, including general calls for assistance – 237633
CHART 16A - TRENTON SRR*Including JRCC Trenton <strong>and</strong> MRSC Québec<strong>M1</strong> Cases (81)<strong>M2</strong> Cases (117)<strong>M3</strong> Cases (1745)<strong>M4</strong> Cases (276)34
TRENTON SRRJRCC Trenton <strong>and</strong> MRSC QuébecThe objective of the SAR System is to save 100% of Lives at Risk in Distress <strong>and</strong>Potential Distress Incidents. Of the 2219 maritime incidents that occurred in theTrenton SRR, 94.58% of the Lives at Risk were saved in 2001.Maritime Incidents (<strong>M1</strong> +<strong>M2</strong> +<strong>M3</strong> +<strong>M4</strong>) – 2219• <strong>M1</strong> – Distress Incidents – 81 representing 3.65% of maritime incidents.• <strong>M2</strong> – Potential Distress Incidents – 117 representing 5.27% of maritime incidents.• <strong>M3</strong> – Incidents resolved in the Uncertainty Phase – 1745 representing 78.64% of maritime incidents.• <strong>M4</strong> – False Alarms <strong>and</strong> Hoaxes – 276 epresenting 12.44% of maritime incidentsPeople AssistedLives at Risk• Lives Saved – 507• Lives Lost – 29Total People assisted, including general calls for assistance – 5923Other Incidents (A + H + U) = 676• Distress Incidents – 169 representing 25% of other incidents.• Potential Distress Incidents – 49 representing 7.25% of other incidents.• Incidents Resolved in the Uncertainty Phase – 85 representing 12.57% of other incidents• False Alarms <strong>and</strong> Hoaxes – 373 representing 55.18% of other incidents.People AssistedLives at Risk• Lives Saved – 292• Lives Lost – 72Total People assisted, including general calls for assistance – 61035
CHART 16B - VICTORIA SRR<strong>M1</strong> Cases (130)<strong>M2</strong> Cases (328)<strong>M3</strong> Cases (1186)<strong>M4</strong> Cases (585)36
VICTORIA SRRJRCC VictoriaThe objective of the SAR System is to save 100% of Lives at Risk in Distress <strong>and</strong>Potential Distress Incidents. Of the 2229 maritime incidents that occurred in the VictoriaSRR, 98.29% of the Lives at Risk were saved in 2001.Maritime Incidents (<strong>M1</strong> +<strong>M2</strong> +<strong>M3</strong> +<strong>M4</strong>) – 2229• <strong>M1</strong> – Distress Incidents – 130 representing 5.83% of maritime incidents.• <strong>M2</strong> – Potential Distress Incidents – 328 representing 14.72% of maritime incidents.• <strong>M3</strong> – Incidents resolved in the Uncertainty Phase – 1186 representing 53.21% of maritime incidents.• <strong>M4</strong> – False Alarms <strong>and</strong> Hoaxes – 585 representing 26.24% of maritime incidentsPeople AssistedLives at Risk• Lives Saved – 1152• Lives Lost – 20Total People assisted, including general calls for assistance – 18,225 (see note below)Note: 2001 figure (14,303) includes two <strong>M4</strong> incidents involving Military Aircraft Carriers with 6275 personsonboard for each incident. Excluding both of these incidents, the total for <strong>M4</strong> People Assisted for JRCCVictoria in 2001 would be 5074.Other Incidents (A + H + U) = 738• Distress Incidents – 99 representing 13.77% of other incidents.• Potential Distress Incidents – 138 representing 19.19% of other incidents.• Incidents resolved in the Uncertainty Phase – 107 representing 14.88% of other incidents• False Alarms <strong>and</strong> Hoaxes – 375 representing 52.16% of other incidents.People AssistedLives at Risk• Lives Saved – 391• Lives Lost – 47Total People assisted, including general calls for assistance – 107237
NEWFOUNDLAND REGIONCHART 17 - MRSC ST. JOHN’S<strong>M1</strong> Cases (37)<strong>M2</strong> Cases (56)<strong>M3</strong> Cases (341)<strong>M4</strong> Cases (42)38
MRSC ST. JOHNSMaritime Incidents (<strong>M1</strong> +<strong>M2</strong> +<strong>M3</strong> +<strong>M4</strong>) – 476• <strong>M1</strong> – Distress Incidents – 37 representing 7.77 % of maritime incidents.• <strong>M2</strong> – Potential Distress Incidents – 56representing 11.76 %of maritime incidents.• <strong>M3</strong> – Incidents resolved in the Uncertainty Phase – 341 representing 71.64 % of maritime incidents.• <strong>M4</strong> – False Alarms <strong>and</strong> Hoaxes – 42 representing 8.83 % of maritime incidentsPeople AssistedLives at Risk• Lives Saved – 274• Lives Lost – 10Total People assisted, including general calls for assistance – 2144Other Incidents (A + H + U) = 31• Distress Incidents – 1 representing 29.04 % of other incidents.• Potential Distress Incidents – 3 representing 9.68 % of other incidents.• Incidents resolved in the Uncertainty Phase – 4 representing 12.90 % of other incidents• False Alarms <strong>and</strong> Hoaxes – 15 representing 48.38 % of other incidents.People AssistedLives at Risk• Lives Saved – 11• Lives Lost – 8Total People assisted, including general calls for assistance – 20MRSC St John's(M,A,H & U)100806040200J F M A M J J A S O N DMRSC St. John's 12 7 9 58 55 71 94 78 44 49 20 10Month / Mois39
MARITIME REGIONCHART 17A - JRCC HALIFAX*Excluding MRSC Québec <strong>and</strong> MRSC St. John’s<strong>M1</strong> Cases (77)<strong>M2</strong> Cases (109)<strong>M3</strong> Cases (956)<strong>M4</strong> Cases (262)40
JRCC HALIFAX*Excluding MRSC Québec <strong>and</strong> MRSC St. John’sMaritime Incidents (<strong>M1</strong> +<strong>M2</strong> +<strong>M3</strong> +<strong>M4</strong>) – 1404• <strong>M1</strong> – Distress Incidents – 77 representing 5.48 % of maritime incidents.• <strong>M2</strong> – Potential Distress Incidents – 109 representing 7.76%of maritime incidents.• <strong>M3</strong> – Incidents resolved in the Uncertainty Phase – 956 representing 68.09% of maritime incidents.• <strong>M4</strong> – False Alarms <strong>and</strong> Hoaxes – 262 representing 18.66% of maritime incidentsPeople AssistedLives at Risk• Lives Saved – 664• Lives Lost – 12Total People assisted, including general calls for assistance – 4175Other Incidents (A + H + U) = 341• Distress Incidents – 45 representing 13.20% of other incidents.• Potential Distress Incidents – 36 representing 10.56% of other incidents.• Incidents resolved in the Uncertainty Phase – 106 representing 31.09% of other incidents• False Alarms <strong>and</strong> Hoaxes – 154 representing 45.16% of other incidents.People AssistedLives at Risk• Lives Saved – 373• Lives Lost – 20Total People assisted, including general calls for assistance – 2345JRCC Halifax(M,A,H & U)4003002001000J F M A M J J A S O N DJRCC Halifax 75 53 66 96 197 218 291 307 169 93 86 94Month / Mois41
QUÉBEC REGIONCHART 17B - MRSC QUÉBEC<strong>M1</strong> Cases (46)<strong>M2</strong> Cases (70)<strong>M3</strong> Cases (936)<strong>M4</strong> Cases (83)42
MRSC QUÉBECMaritime Incidents (<strong>M1</strong> +<strong>M2</strong> +<strong>M3</strong> +<strong>M4</strong>) –1135• <strong>M1</strong> – Distress Incidents – 46 representing 4.02 % of maritime incidents.• <strong>M2</strong> – Potential Distress Incidents – 70 representing 6.17 %of maritime incidents.• <strong>M3</strong> – Incidents resolved in the Uncertainty Phase – 936 representing 82.47 % of maritime incidents.• <strong>M4</strong> – False Alarms <strong>and</strong> Hoaxes – 83 representing 7.34 % of maritime incidentsPeople AssistedLives at Risk• Lives Saved – 281• Lives Lost – 10Total People assisted, including general calls for assistance – 3061Other Incidents (A + H + U) = 101• Distress Incidents – 32 representing 31.68% of other incidents.• Potential Distress Incidents – 34 representing 18.81 % of other incidents.• Incidents resolved in the Uncertainty Phase – 21 representing 20.79% of other incidents• False Alarms <strong>and</strong> Hoaxes – 27 representing 28.72% of other incidents.People AssistedLives at Risk• Lives Saved – 41• Lives Lost – 21Total People assisted, including general calls for assistance – 71MRSC Québec(M,A,H & U)4003002001000J F M A M J J A S O N DMRSC Québec 7 5 6 24 79 266 364 290 132 46 8 9Month / Mois43
CENTRAL & ARCTIC REGIONCHART 17C – JRCC TRENTON* Excluding MRSC Québec<strong>M1</strong> Cases (44)<strong>M2</strong> Cases (61)<strong>M3</strong> Cases (889)<strong>M4</strong> Cases (216)44
CENTRAL & ARCTIC REGION - JRCC TRENTON*Excluding MRSC QuébecMaritime Incidents (<strong>M1</strong> +<strong>M2</strong> +<strong>M3</strong> +<strong>M4</strong>) – 1210• <strong>M1</strong> – Distress Incidents – 44 representing 3.65% of maritime incidents.• <strong>M2</strong> – Potential Distress Incidents – 61 representing 5.27% of maritime incidents.• <strong>M3</strong> – Incidents resolved in the Uncertainty Phase – 889 representing 78.64% of maritime incidents.• <strong>M4</strong> – False Alarms <strong>and</strong> Hoaxes – 216 epresenting 12.44% of maritime incidentsPeople AssistedLives at Risk• Lives Saved – 292• Lives Lost – 21Total People assisted, including general calls for assistance – 3181Other Incidents (A + H + U) = 589• Distress Incidents – 140 representing 23.77 % of other incidents.• Potential Distress Incidents – 33 representing 5.61 % of other incidents.• Incidents resolved in the Uncertainty Phase –66 representing 11.21 % of other incidents• False Alarms <strong>and</strong> Hoaxes – 350 representing 59.43 % of other incidents.People AssistedLives at Risk• Lives Saved – 259• Lives Lost – 53Total People assisted, including general calls for assistance – 550JRCC Trenton(M,A,H & U)6004002000J F M A M J J A S O N DJRCC Trenton 17 24 31 51 159 257 477 393 208 92 50 40Month / Mois45
PACIFIC REGIONCHART 17D – JRCC VICTORIA<strong>M1</strong> Cases (130)<strong>M2</strong> Cases (328)<strong>M3</strong> Cases (1186)<strong>M4</strong> Cases (585)46
JRCC VICTORIAMaritime Incidents (<strong>M1</strong> +<strong>M2</strong> +<strong>M3</strong> +<strong>M4</strong>) – 2229• <strong>M1</strong> – Distress Incidents – 130 representing 5.83% of maritime incidents.• <strong>M2</strong> – Potential Distress Incidents – 328 representing 14.72% of maritime incidents.• <strong>M3</strong> – Incidents resolved in the Uncertainty Phase – 1186 representing 53.21% of maritime incidents.• <strong>M4</strong> – False Alarms <strong>and</strong> Hoaxes – 585 representing 26.24% of maritime incidentsPeople AssistedLives at Risk• Lives Saved – 1152• Lives Lost – 20Total People assisted, including general calls for assistance – 18,225 (see note below)Note: 2001 figure (14,303) includes two <strong>M4</strong> incidents involving Military Aircraft Carriers withapproimatically 6275 persons onboard for each incident. Excluding both of these incidents, the total for<strong>M4</strong> People Assisted for JRCC Victoria in 2001 would be 5074.Other Incidents (A + H + U) = 738• Distress Incidents – 99 representing 13.77% of other incidents.• Potential Distress Incidents – 138 representing 19.19% of other incidents.• Incidents resolved in the Uncertainty Phase – 107 representing 14.88% of other incidents• False Alarms <strong>and</strong> Hoaxes – 375 representing 52.16% of other incidents.People AssistedLives at Risk• Lives Saved – 391• Lives Lost – 47Total People assisted, including general calls for assistance – 1072Note: This data was previously presented under the SAR REGIONS section of this publication.JRCC Victoria(M,A,H & U)6004002000J F M A M J J A S O N DJRCC Victoria 143 111 159 193 293 327 451 527 269 176 139 160Month / Mois47
CHART 18 - 2001 MARITIME INCIDENTS – COMPARISON BY CCG REGION<strong>M1</strong>, <strong>M2</strong>, <strong>M3</strong> <strong>and</strong> <strong>M4</strong>2500Number of Incidents2000150010005000Pacific Central & Arctic Québec Maritimes Newfoundl<strong>and</strong>PacificCentral &ArcticQuébec Maritimes Newfoundl<strong>and</strong>Distress 130 44 46 77 37Potential Distress 328 61 70 109 56Non-Distress 1186 889 936 956 341False Alarms / Hoax 585 216 83 262 42Total 2229 1210 1135 1404 476Total for 2001 = 6454 Maritime IncidentsNational Summary of Incidents byClassification M, A, H & U(Number of Incidents / Percentage)Marine, 6454,78%Unknown,427, 5%Humanitarian,625, 8%Aeronautical,729, 9%48
CANADIAN COAST GUARD SAR RESOURCESTYPE DESCRIPTION600 High Endurance SARVessel500 Intermediate SARVesselOPERATIONSCapable of forward deployment <strong>and</strong> offshoreoperations in most weather conditions, fully equippedfor extended SAR patrols. High endurance, longrange, moderate to fast speed. Full SAR facilitiesonboard. Ice strengthened. 18 knots in sea state 4Capable of forward deployment <strong>and</strong> exposed coastalwaters operations in most weather conditions, fullyequipped for SAR patrols. High endurance withmoderate range: 15 knots in sea state 5.400 Small SAR Vessel Capable of operations in semi-sheltered water inmost weather conditions. Station mode, highendurance, moderate range, <strong>and</strong> moderate to fastspeed. 20 knots in sea state 0.300 Multi-Task Lifeboat Medium range lifeboat with moderate to high speed inmoderate weather conditions, in sheltered waters -station mode.300A Self-Righting HighEndurance LifeboatAll weather lifeboat capable of coastal watersoperations in most weather conditions. Station mode,high endurance, moderate range, moderate to fastspeed, self-righting. 18 knots in sea state 0.300B Self-Righting HighSpeed LifeboatFast lifeboat capable of coastal waters operations inmost weather conditions. Station mode, moderaterange, fast speed, self-righting.25 knots in sea state 0.200 Ice Strengthened SmallSAR VesselCapable of operations in inshore ice infested waters.Station mode with intermittent patrol capability.Moderate range. 10 knots in sea state 0.49
100 Small Rescue Craft Fast craft capable of operations in sheltered watersunder most weather conditions. Station mode. 22knots in sea state 0IRB Inshore Rescue BoatACV Air Cushion VehicleSmall, fast rescue boat capable of limited rescueoperations in inshore/sheltered waters. Stationmode. 25 knots in sea state 0.Fast air cushion vehicle capable of operations in alllittoral zones <strong>and</strong> inshore/near shore waters undermoderate weather conditions. High speed, stationmode. 50 knots in sea state 0.50
GLOSSARY OF TERMSADRIFTAERONAUTICALINCIDENTAIRCRAFTCAPSIZEDINCIDENTCCGAA vessel has broken away from her moorings/anchor(s) <strong>and</strong>is floating at r<strong>and</strong>om; or a vessel is discovered ab<strong>and</strong>oned atsea <strong>and</strong> remains afloat (e.g. not capsized).An aeronautical incident is a search <strong>and</strong> rescue (SAR)incident involving an aircraft.The original vehicle of transport of the person(s) in distressor in need of assistance was an airborne vehicle, regardlessof the geographic area in which the vehicle came to rest.A vessel has overturned.An individual SAR incident to which is assigned a uniqueidentifier.<strong>Canadian</strong> <strong>Coast</strong> <strong>Guard</strong> Auxiliary (Marine Volunteers).COLLISION WITHOBJECTCOLLISION WITHSHIPCollision with a wharf, pier, breakwater, dolphin, buoy orsuch similar object but not running aground.A collision between two or more vessels. ( includes MobileOffshore Drilling Unit).DISABLEDDISORIENTEDDISTRESSDISTRESSSIGNALA situation wherein a vessel with people on board is notunder comm<strong>and</strong> due to human or climatic factors ormechanical breakdown (sailboards, sailboats in high winds,nets caught in prop, strong currents, <strong>and</strong> dead engine).A vessel’s operator is unable to fix his/her position <strong>and</strong>assistance is required to prevent the vessel st<strong>and</strong>ing intodanger.A SAR incident wherein there is reasonable certainty thatone or more individuals are threatened by grave <strong>and</strong>imminent danger <strong>and</strong> require immediate assistance.Any signal recognized internationally as indicating a craft,person or persons in distress.51
FALSE ALARMGROUNDEDHOAXHUMANITARIANINCIDENTInitial information, be it true or not, indicates that a vessel,person or craft is in need of assistance <strong>and</strong> wheresubsequent information or investigation proves to beunjustified or fabricated, such as a mistaken report of a flare.A vessel is aground or ashore (i.e. resting on solid ground forwant of sufficient water).Conveying of information which is done with the intent todeceive.A search <strong>and</strong> rescue (SAR) incident (not aeronautical ormaritime) which requires a response by the SAR system.LIVES LOSTLIVES SAVEDLIVES AT RISKMARITIMEINCIDENTMRSCMECHANICALFAILUREMEDICALOTHERPERSONOVERBOARDThose persons who died or went missing during the courseof a distress incident.Those persons who were saved as a direct result of adistress or a potential distress incident.The sum total of lives saved <strong>and</strong> lives lost in distress <strong>and</strong>potential distress incidents.A search <strong>and</strong> rescue (SAR) incident involving a vessel or aperson, including the medical evacuation (MEDEVAC) ofperson(s) from a vessel.Marine Rescue Sub-Centre.Any mechanical problem including engine, propeller,transmission or steering gear failure.The provision of assistance to a person requiring immediateassistance as a result of injury or illness not associated withmarine casualty or incident involving a vessel or craft.A marine SAR incident not explicitly categorized by any otherdefinition. This may include such items as sightings ofdebris. It does not include humanitarian aid or aid to civilauthorities such as pollution checks, recovering flotsam,jetsam or lagan that may be a hazard to navigation, aidschecks, etc.A person in the water normally as a result of falling over aship’s or vessel’s side.52
PRIMARY CGRESOURCESJRCCRESPONSESAR INCIDENTSECONDARYRESOURCESSORTIETAKING ONWATERTOTAL TIME ONSORTIETASKINGSUNKNOWNINCIDENTThose <strong>Coast</strong> <strong>Guard</strong> vessels established <strong>and</strong> equippedspecifically for SAR <strong>and</strong> manned with SAR trained crews.Joint Rescue Coordination Centre.Action taken by any unit to render assistance.A reported incident which requires a response by the SARsystem.Aircraft or vessels established for other than SAR, but whichcan be expected to respond (when available) to SARtaskings.Action of a resource rendering assistance. Each actioncomprises a sortie.A vessel’s watertight integrity is lost through somemalfunction, leak, rupture, etc., <strong>and</strong> the resultant influx ofwater is unmanageable without extraordinary measures.Total time on sortie from homeport/station or diversion fromanother mission until return homeport/station.Deployment of a SAR resource to render assistance.An incident which commences as a search <strong>and</strong> rescueincident of an unknown type <strong>and</strong> the source of which isuntraced.53


