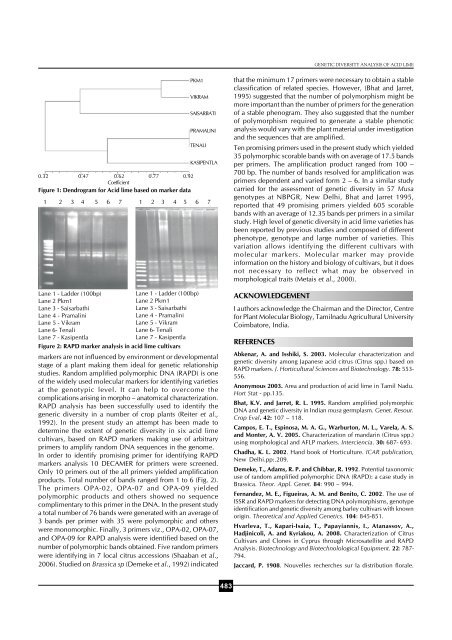
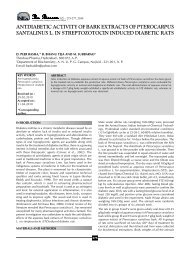
M. KUMAR et al.,<strong>lime</strong> genotypes. The objectives <strong>of</strong> the study were to achieve abetter understanding <strong>of</strong> genetic variation and to investigatetheir inter-relationship. In India collection and conservation<strong>of</strong> citrus species/ types started long back in the mid <strong>of</strong> 19 thcentury. During the past, collection and conservation wereprimarily made for the quality <strong>of</strong> fruits. The current researchefforts are addressed to collection <strong>of</strong> gene pool with distinctdesirable traits, which can be utilized for improvement <strong>of</strong>cultivars. The great genetic <strong>diversity</strong> is under serious threat <strong>of</strong>rapid extinction or depletion <strong>of</strong> the germplasm mainly due topopulation pressure and farmers preference (Singh. 2004).Thepresent study was undertaken to evaluate certain importantcultivars <strong>of</strong> <strong>acid</strong> <strong>lime</strong> (<strong>Citrus</strong> aurantifolia Swingle).MATERIALS AND MATHODSPlant materialA total <strong>of</strong> 6 <strong>acid</strong> <strong>lime</strong> genotypes used in this study were collectedfrom the citrus orchard <strong>of</strong> Horticultural college and ResearchInstitute, Periyakulam, Tamilnadu, India.DNA isolationTotal genomic DNA was isolated from fully expanded leavesusing the CTAB (hexadecyltrimethylammonium-bromide)method (Murray and Thompson, 1980) with few modifications.Briefly, 2g <strong>of</strong> leaves were ground in liquid nitrogen to a finepowder. The powder was added to 6 mL <strong>of</strong> extraction buffer(100 mM Tris–HCl pH 8.0, 20mM EDTA, 1.4 M NaCl, 2%(wv-1) CTAB, 2–mercaptoethanol 2% and 1% (wv-1) PVP andincubated at 65ºC for 30 min. The DNA was extracted withchlor<strong>of</strong>orm – octanol (24: 1). The DNA was washed with 70%ethanol and dissolved in 100-400µL <strong>of</strong> TE (10mM Tris–HClpH 8.0, 1 mM EDTA and 0.2mg mL-1 RNase). The DNAconcentration was determined spectrophotometrically at260nm. Stock DNA samples were stored at –20ºC and dilutedto 20ng uL-1 when in use.PCR procedureThe RAPD primers were purchased from OperonTechnologies Alameda, CA, USA. A total <strong>of</strong> 40 decameroligonucleotides <strong>of</strong> arbitrary sequence were tested for PCRamplification. The basic protocol reported by William et al.(1990) for PCR was performed in a total volume <strong>of</strong> 12.5µL,containing 25ng <strong>of</strong> template DNA, 0.4 µM <strong>of</strong> single primer,0.6 U Taq DNA polymerase (Bangalore Genei, India), 0.20µM<strong>of</strong> each dNTP, 1.5mM MgCl2, 10 mM Tris–HCl, and 50 mMKCl. DNA amplification was carried out in a PTC- 10096VThermocycler (MJ Research, Inc, USA) and the thermal cyclerconditions for PCR reactions were an initial denaturation cycle<strong>of</strong> 1 min and 30 s at 94ºC was followed by 45 cycles comprising1 min at 94ºC, 1 min at 36ºC and 2 min at 72 ºC. An additionalcycle <strong>of</strong> 7 min at 72ºC was used for final extension.Amplification products were separated by electrophoresis (8.3V cm-1) in 1.5% agarose gels and stained in ethidium bromide.A photographic record was taken under UV illumination.Data <strong>analysis</strong>Only clear and repeatable amplification products were scoredas 1 for present bands and 0 for absent ones. The specificbands useful for identifying species and cultivars were namedwith a primer number followed by the approximate size <strong>of</strong> theamplified fragment in base pairs. Polymorphism was calculatedbased on the presence or absence <strong>of</strong> bands. The 0 or 1 datamatrix was created and used to calculate the genetic distanceand similarity using “Simqual” a subprogram <strong>of</strong> the NTSYS-PCprogram (numerical taxonomy and multivariate <strong>analysis</strong> systemprogram) (Rohlf, 1993). The genetic associations betweenaccessions were evaluated by calculating the Jaccard’s similaritycoefficient for pair wise comparisons based on the proportions<strong>of</strong> shared bands produced by the primers (Jaccard, 1908).The dendrogram was constructed by using a distance matrixusing the unweighed pairgroup method with arithmeticaverage (UPGMA) sub-program <strong>of</strong> NTSYS-PC.RAPD - PCR <strong>analysis</strong>DNA from six <strong>acid</strong> <strong>lime</strong> cultivars was amplified using a set <strong>of</strong>10 RAPD primer pairs OPA-02, OPG-02, OPG-05, OPO-12,OPA-07, OPB-05, OPA-09, OPH-15, OPA-17 and OPH-20.The RAPD primers which are located near to were selected inthe present study. Those RAPD primers which amplified thepresent set <strong>of</strong> germplasm were used for <strong>diversity</strong> <strong>analysis</strong> afteroptimization <strong>of</strong> PCR conditions. Finally 10 primers whichshowed good amplification were selected.RESULTS AND DISCUSSIONCluster based on dendrogramThe similarity values obtained for each pair wise comparison<strong>of</strong> RAPD markers among the six <strong>acid</strong> <strong>lime</strong> cultivars were usedto construct dendrogram based on Jaccard’s coefficient andthe results are presented (Fig. 1). Total <strong>of</strong> 76 alleles <strong>of</strong> which35 were polymorphic detected by ten RAPD markers. The six<strong>acid</strong> <strong>lime</strong> cultivars formed 4 clusters at nearly 60.5% similaritylevels. Among the different clusters, the cluster size variedfrom 2 (cluster I and III) to 1 (cluster II, IV). The cluster I consisted<strong>of</strong> PKM -1 and Vikram. The cluster II consisted <strong>of</strong> Saisarbathi.The cluster III consists <strong>of</strong> Pramalini and Tenali. The cluster IVconsisted <strong>of</strong> Kasipentla. Among the cultivars, Pramalini andTenali showed nearly 92% similarity followed by PKM-1 andVikram which showed nearly 80% similarity. Kasipentalashowed nearly 58% similarity, and Saisarbathi nearly 46%similarity. On drawing a vertical line in the dendrogram (Fig.1) along the point corresponding to a distance <strong>of</strong> 0.92 all thesix <strong>acid</strong> <strong>lime</strong> cultivars got divided into 4 clusters. All thecultivars <strong>of</strong> distance 0.32 came under single cluster. At adistance <strong>of</strong> 0.90 all the cultivars formed single stand six clusters.At a distance <strong>of</strong> 0.92 Tenali and Pramalini formed singlecluster, Whereas at a distance <strong>of</strong> 0.82 single cluster was formedby PKM – 1 and Vikram. At a distance <strong>of</strong> 0. 58, Pramalini,Tenali and Kasipentla came under single cluster. At a distance<strong>of</strong> 0.46 PKM – 1, Vikram and Saisarbati were found to formsingle cluster. Among the six <strong>acid</strong> <strong>lime</strong> cultivars, Saisarbatihad maximum genetic <strong>diversity</strong>.Molecular characterizationMorphological traits have been extensively used to determinethe relationship among plants and its varieties (Ortiz et al.,1998). However, morphological markers do not <strong>of</strong>ten reflectgenetic relationships because <strong>of</strong> their interaction with theenvironment epistasis and the largely unknown genetic control<strong>of</strong> the traits (Smith and Smith, 1998). In contrast, molecular482
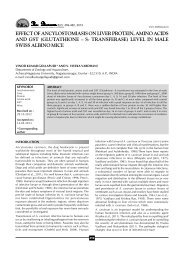
GENETIC DIVERSITY ANALYSIS OF ACID LIME0.32 0.47 0.62 0.77 0.92CoefficientFigure 1: Dendrogram for Acid <strong>lime</strong> based on marker dataLane 1 - Ladder (100bp)Lane 2 Pkm1Lane 3 - SaisarbathiLane 4 - PramaliniLane 5 - VikramLane 6- TenaliLane 7 - KasipentlaFigure 2: RAPD marker <strong>analysis</strong> in <strong>acid</strong> <strong>lime</strong> cultivarsPKM1Lane 1 - Ladder (100bp)Lane 2 Pkm1Lane 3 - SaisarbathiLane 4 - PramaliniLane 5 - VikramLane 6- TenaliLane 7 - KasipentlaVIKRAMSAISARBATIPRAMALINITENALIKASIPENTLA1 2 3 4 5 6 7 1 2 3 4 5 6 7markers are not influenced by environment or developmentalstage <strong>of</strong> a plant making them ideal for genetic relationshipstudies. Random amplified polymorphic DNA (RAPD) is one<strong>of</strong> the widely used molecular markers for identifying varietiesat the genotypic level. It can help to overcome thecomplications arising in morpho – anatomical characterization.RAPD <strong>analysis</strong> has been successfully used to identify thegeneric <strong>diversity</strong> in a number <strong>of</strong> crop plants (Reiter et al.,1992). In the present study an attempt has been made todetermine the extent <strong>of</strong> genetic <strong>diversity</strong> in six <strong>acid</strong> <strong>lime</strong>cultivars, based on RAPD markers making use <strong>of</strong> arbitraryprimers to amplify random DNA sequences in the genome.In order to identify promising primer for identifying RAPDmarkers <strong>analysis</strong> 10 DECAMER for primers were screened.Only 10 primers out <strong>of</strong> the all primers yielded amplificationproducts. Total number <strong>of</strong> bands ranged from 1 to 6 (Fig. 2).The primers OPA-02, OPA-07 and OPA-09 yieldedpolymorphic products and others showed no sequencecomp<strong>lime</strong>ntary to this primer in the DNA. In the present studya total number <strong>of</strong> 76 bands were generated with an average <strong>of</strong>3 bands per primer with 35 were polymorphic and otherswere monomorphic. Finally, 3 primers viz., OPA-02, OPA-07,and OPA-09 for RAPD <strong>analysis</strong> were identified based on thenumber <strong>of</strong> polymorphic bands obtained. Five random primerswere identifying in 7 local citrus accessions (Shaaban et al.,2006). Studied on Brassica sp (Demeke et al., 1992) indicatedthat the minimum 17 primers were necessary to obtain a stableclassification <strong>of</strong> related species. However, (Bhat and Jarret,1995) suggested that the number <strong>of</strong> polymorphism might bemore important than the number <strong>of</strong> primers for the generation<strong>of</strong> a stable phenogram. They also suggested that the number<strong>of</strong> polymorphism required to generate a stable phenotic<strong>analysis</strong> would vary with the plant material under investigationand the sequences that are amplified.Ten promising primers used in the present study which yielded35 polymorphic scorable bands with on average <strong>of</strong> 17.5 bandsper primers. The amplification product ranged from 100 –700 bp. The number <strong>of</strong> bands resolved for amplification wasprimers dependent and varied form 2 – 6. In a similar studycarried for the assessment <strong>of</strong> genetic <strong>diversity</strong> in 57 Musagenotypes at NBPGR, New Delhi, Bhat and Jarret 1995,reported that 49 promising primers yielded 605 scorablebands with an average <strong>of</strong> 12.35 bands per primers in a similarstudy. High level <strong>of</strong> genetic <strong>diversity</strong> in <strong>acid</strong> <strong>lime</strong> varieties hasbeen reported by previous studies and composed <strong>of</strong> differentphenotype, genotype and large number <strong>of</strong> varieties. Thisvariation allows identifying the different cultivars withmolecular markers. Molecular marker may provideinformation on the history and biology <strong>of</strong> cultivars, but it doesnot necessary to reflect what may be observed inmorphological traits (Metais et al., 2000).ACKNOWLEDGEMENTI authors acknowledge the Chairman and the Director, Centrefor Plant Molecular Biology, Tamilnadu Agricultural UniversityCoimbatore, India.REFERENCESAbkenar, A. and Isshiki, S. 2003. Molecular characterization andgenetic <strong>diversity</strong> among Japanese <strong>acid</strong> citrus (<strong>Citrus</strong> spp.) based onRAPD markers. J. Horticultural Sciences and Biotechnology. 78: 553-556.Anonymous 2003. Area and production <strong>of</strong> <strong>acid</strong> <strong>lime</strong> in Tamil Nadu.Hort Stat - pp.135.Bhat, K.V. and Jarret, R. L. 1995. Random amplified polymorphicDNA and genetic <strong>diversity</strong> in Indian musa germplasm. Genet. Resour.Crop Eval. 42: 107 – 118.Campos, E. T., Espinosa, M. A. G., Warburton, M. L., Varela, A. S.and Monter, A. V. 2005. Characterization <strong>of</strong> mandarin (<strong>Citrus</strong> spp.)using morphological and AFLP markers. Interciencia. 30: 687- 693.Chadha, K. L. 2002. Hand book <strong>of</strong> Horticulture. ICAR publication,New Delhi.pp:.209.Demeke, T., Adams, R. P. and Chibbar, R. 1992. Potential taxonomicuse <strong>of</strong> random amplified polymorphic DNA (RAPD): a case study inBrassica. Theor. Appl. Genet. 84: 990 – 994.Fernandez, M. E., Figueiras, A. M. and Benito, C. 2002. The use <strong>of</strong>ISSR and RAPD markers for detecting DNA polymorphisms, genotypeidentification and genetic <strong>diversity</strong> among barley cultivars with knownorigin. Theoretical and Applied <strong>Genetic</strong>s. 104: 845-851.Hvarleva, T., Kapari-Isaia, T., Papayiannis, I., Atanassov, A.,Hadjinicoli, A. and Kyriakou, A. 2008. Characterization <strong>of</strong> <strong>Citrus</strong>Cultivars and Clones in Cyprus through Microsatellite and RAPDAnalysis. Biotechnology and Biotechnolological Equipment. 22: 787-794.Jaccard, P. 1908. Nouvelles recherches sur la distribution florale.483