info document - Paris School of Economics
info document - Paris School of Economics
info document - Paris School of Economics

You also want an ePaper? Increase the reach of your titles
YUMPU automatically turns print PDFs into web optimized ePapers that Google loves.
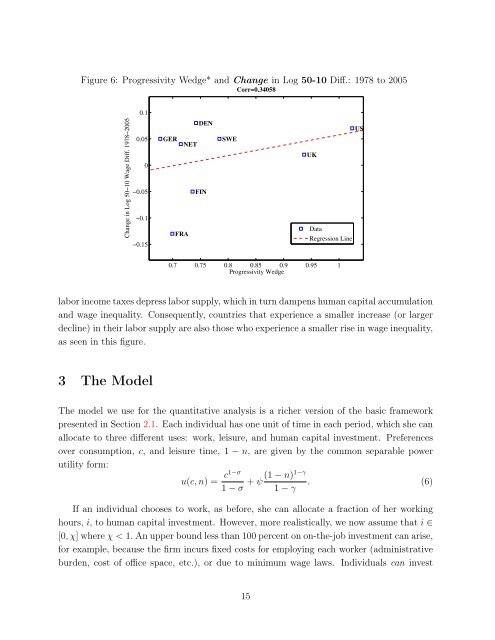
Figure 6: Progressivity Wedge* and Change in Log 50-10 Diff.: 1978 to 2005Corr=0.34058Change in Log 50−10 Wage Diff. 1978−20050.10.050−0.05−0.1−0.15DENGERNETSWEFINFRAUSUKDataRegression Line0.7 0.75 0.8 0.85 0.9 0.95 1Progressivity Wedgelabor income taxes depress labor supply, which in turn dampens human capital accumulationand wage inequality. Consequently, countries that experience a smaller increase (or largerdecline) in their labor supply are also those who experience a smaller rise in wage inequality,as seen in this figure.3 The ModelThe model we use for the quantitative analysis is a richer version <strong>of</strong> the basic frameworkpresented in Section 2.1. Each individual has one unit <strong>of</strong> time in each period, which she canallocate to three different uses: work, leisure, and human capital investment. Preferencesover consumption, c, and leisure time, 1 − n, are given by the common separable powerutility form:u(c, n) = c1−σ1 − σ(1 − n)1−γ+ ψ . (6)1 − γIf an individual chooses to work, as before, she can allocate a fraction <strong>of</strong> her workinghours, i, to human capital investment. However, more realistically, we now assume that i ∈[0, χ] where χ < 1. An upper bound less than 100 percent on on-the-job investment can arise,for example, because the firm incurs fixed costs for employing each worker (administrativeburden, cost <strong>of</strong> <strong>of</strong>fice space, etc.), or due to minimum wage laws. Individuals can invest15