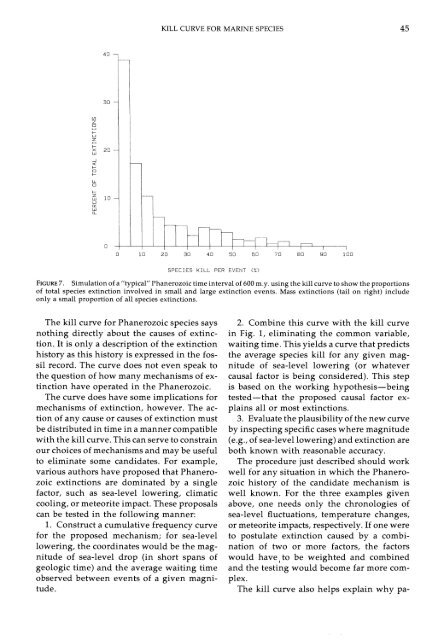
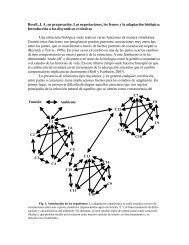
KILL CURVE FOR MARINE SPECIESSPECIES KILL PER E'JENT(i:)FIGURE7. Simulation of a"typicalr' <strong>Phanerozoic</strong> time interval of 600 m.y. using the kill curve to show the proportionsof total species extinction involved in small and large extinction events. Mass extinctions (tail on right) includeonly a small proportion of all species extinctions.The kill curve for <strong>Phanerozoic</strong> species saysnothing directly about the causes of extinction.It is only a description of the extinctionhistory as this history is expressed in the fossilrecord. The curve does not even speak tothe question of how many mechanisms of extinctionhave operated in the <strong>Phanerozoic</strong>.The curve does have some implications formechanisms of extinction, however. The actionof any cause or causes of extinction mustbe distributed in time in a manner compatiblewith the kill curve. This can serve to constrainour choices of mechanisms and may be usefulto eliminate some candidates. <strong>For</strong> example,various authors have proposed that <strong>Phanerozoic</strong>extinctions are dominated by a singlefactor, such as sea-level lowering, climaticcooling, or meteorite impact. These proposalscan be tested in the following manner:1. Construct a cumulative frequency curvefor the proposed mechanism; for sea-levellowering, the coordinates would be the magnitudeof sea-level drop (in short spans ofgeologic time) and the average waiting timeobserved between events of a given magnitude.2. Combine this curve with the kill curvein Fig. 1, eliminating the common variable,waiting time. This yields a curve that predictsthe average species kill for any given magnitudeof sea-level lowering (or whatevercausal factor is being considered). This stepis based on the working hypothesis-beingtested-that the proposed causal factor explainsall or most extinctions.3. Evaluate the plausibility of the new curveby inspecting specific cases where magnitude(e.g., of sea-level lowering) and extinction areboth known with reasonable accuracy.The procedure just described should workwell for any situation in which the <strong>Phanerozoic</strong>history of the candidate mechanism iswell known. <strong>For</strong> the three examples givenabove, one needs only the chronologies ofsea-level fluctuations, temperature changes,or meteorite impacts, respectively. If one wereto postulate extinction caused by a combinationof two or more factors, the factorswould have, to be weighted and combinedand the testing would become far more complex.The kill curve also helps explain why pa-
46 DAVID M. RAUPleontologists have had such difficulty definingthe term "mass extinction." Because thekill curve is a smooth, continuous curve, oneshould not expect to find a clear demarcationbetween high- and low-intensity events; anymore than a seismologist expects to recognizea clear boundary between large and smallearthquakes, or a meteorologist expects an obviousboundary between a hurricane and asevere storm. From a procedural standpoint,the paleontologist must therefore choose betweenthe alternatives of (1) using a continuousintensity scale to describe extinction(analogous to the Richter scale for earthquakes)and (2) defining mass extinction bydrawing a totally arbitrary boundary (analogousto the convention of using windspeedof >32.7 m/s to define a hurricane).Despite the foregoing arguments, the fossilrecord does give a strong intuitive impressionof two kinds of extinction, mass extinctionand background extinction. To the extent thatthis perception is real, it is probably due tothe steepness of the middle region of the killcurve. In a typical 100-n1.y. interval of geologictime, there may be one or two largeevents, a few small but identifiable events,and hundreds or thousands of extinctions toosmall to distinguish stratigraphically. Thus,with the relatively small sample available (the<strong>Phanerozoic</strong> record), one gets an impressionof a choppier distribution of the risk of extinctionthan actually exists.AcknowledgmentsThe research described here was supportedby the National Aeronautics and Space Administration(USA) under grant NAG W-1527.I thank J. J. Sepkoski, Jr. and <strong>David</strong> Jablonskifor many fruitful discussions. Special thanksare due J. J. Sepkoski, Jr. for making availablehis unpublished compilation of the ranges of<strong>Phanerozoic</strong> marine genera.Literature CitedFOOTE,M. J. 1988. Survivorship analysis of Cambrian and Ordov~ciantrilobites. Paleobiology 14:258-271GUMBEL, E. J. 1957. Statistics of Extremes. Columbia UniversityPress; New York.HARLAND,hT. B., R. L. ARMSTRONG, A. V. COX, L. 5. CRAIG, A. GSMITH,AND D. G. SMITH. 1989. A Geologic Time Scale 1989.Cambridge University Press; Cambridge.HOWELL, B. F ,JR. 1979 Earthquake risk in eastern Pennsylvania.Earth and Mineral Sciences 48.63-64 KENNEDY, W J 1977. Ammonite evolution. Pp. 251-304 In Hallam,A. (ed.), Patterns of Evolution. Elsev~er Scientihc PublishingCompany, Amsterdam.MCLAREN,D. J. 1982. Frasnian-Famennian extinctions. GeologicalSociety of America Special Paper 190:477-484MULLER,A. H. 1961. Grossablaufe der Stammesgeschichte. GustavFischer Verlag; Jena.NEWELL, N. D 1952 Periodlclty In invertebrate evolution. Journalof Paleontology 26:371-385.RAuP, D. M. 1978. Cohort analysis of generlc survlvorship. Paleobiology4.1-15.RAUP, D. M. 1979. Size of the Permo-Triassic bottleneck and itsevolutionary implications. Science 206:217-218.RAUP, D. M. 1985. Mathematical models of cladogenesis. Paleobiology11 :42-52.RAUP,D. M. 1988. Changing views of natural catastrophe. Pp.5-77. In Adler, M. J. (ed.), Great Ideas Today (1988). EncyclopaediaBritannica; Chicago.RAuP, D. M. In Press. Impact as a general cause of extinction:a feasibility test. Geological Society of America Special Paper24i.RAUP, D. M., AND G E. BOYAJIAN. 1988. Patterns of generlcextinction in the fossil record. Paleobiology 14:109-125.RAUP,D. M., AND J. J. SEPKOSKI, JR. 1982. Mass extinctions inthe marine fossil record. Science 215:1501-1503.RICKARDS, R. B. 1977 Patterns of evolution in the graptolites.Pp. 333-358. irr Hallam, A. (ed.), Patterns of Evolution. ElsevierScientific Publishing Company; Amsterdam.SCHINDEWOLF, 0.H. 1962. Neokatastrophismus? Deutsche GeologischesGesellschafte Zeitschrifte 114:430-445.SEPKOSKI, J.J., JR. 1982. A compendium of fossil marine families.Milwaukee Public Museum Contributions in Biology and Geology51.SEPKOSKI, J. J., JR. 1986. <strong>Phanerozoic</strong> overview of mass extinction.Pp. 277-295. In <strong>Raup</strong>, D. M., and D. Jablonski (eds.), Patternsand Processes in the History of Life. Springer; Berlin.SEPKOSKI, J. J., JR. 1989. Periodicity in extinction and the problemof catastrophism in the history of life. Journal of the GeologicalSociety of London 146:7-19.SIMPSON, G. G. 1953. The Major Features of Evolution. ColumbiaUniversity Press; New York.STANLEY, S. M. 1979 Macroevolution. Pattern and Process. W.H. Freeman and Company; San FranciscoSTIGLER, S M. 1987. Testing hypotheses or fitting models? Pp.147-159. In Nitecki, M. H., and A. Hoffman (eds.), NeutralModels in Biology Oxford University Press; Oxford.VALENTINE, J W, 1969 Patterns of taxonomic and ecologic structureof the shelf benthos during <strong>Phanerozoic</strong> time. Palaeontology12:684-709.VALENTINE, J. W. 1970 How many marine invertebrate fossilspecies? Journal of Paleontology 44:410-415.VALENTINE, J. W., T. C. FOIN, AND D. PEART. 1978. A provincialmodel of <strong>Phanerozoic</strong> marine diversity. Paleobiology 4:55-66.VAN VALEN, L. 1973. A new evolutionary law. EvolutionaryTheory 1:l-30Appelzdix: Data for Survivorsh~p Arralysis <strong>David</strong> M. <strong>Raup</strong> and J. John Sepkoski*Table A1 provides the raw data for the cohort analysis describedin this paper. The data were assembled by D.M.R. fromstratigraphic ranges compiled by J.J.S.A total of 17,621 genera' Department of the Geophys~cal Sc~ences, Unlvers~ty of Chlcago, Chicago,Ill~no~s 60637