A Kill Curve For Phanerozoic Marine Species David M. Raup ...
A Kill Curve For Phanerozoic Marine Species David M. Raup ...
A Kill Curve For Phanerozoic Marine Species David M. Raup ...

You also want an ePaper? Increase the reach of your titles
YUMPU automatically turns print PDFs into web optimized ePapers that Google loves.
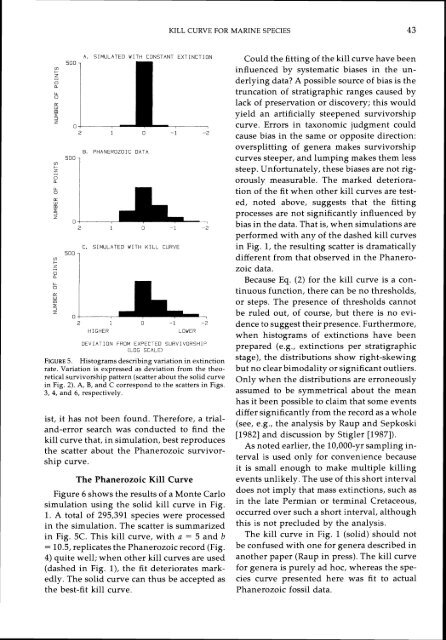
KILL CURVE FOR MARINE SPECIES43mmA. SIMULATED WITH CONSTANT EXTINCTION8. PHANEROZOIC DA-Aso0 1500,C. SIMULATED WITH KILL C3RVEHIGHERLOWERDEVIATION FROM EXPECTED SURVIVORSHIi(LOG SCALE)FIGURE5. Histograms describing variation in extinctionrate. Variation is expressed as deviation from the theoreticalsurvivorship pattern (scatter about the solid curvein Fig. 2). A, B, and C correspond to the scatters in Figs.3, 4, and 6, respectively.ist, it has not been found. Therefore, a trialand-errorsearch was conducted to find thekill curve that, in simulation, best reproducesthe scatter about the <strong>Phanerozoic</strong> survivorshipcurve.The <strong>Phanerozoic</strong> <strong>Kill</strong> <strong>Curve</strong>Figure 6 shows the results of a Monte Carlosimulation using the solid kill curve in Fig.1. A total of 295,391 species were processedin the simulation. The scatter is summarizedin Fig. 5C. This kill curve, with a = 5 and b= 10.5, replicates the <strong>Phanerozoic</strong> record (Fig.4) quite well; when other kill curves are used(dashed in Fig. I), the fit deteriorates markedly.The solid curve can thus be accepted asthe best-fit kill curve.Could the fitting of the kill curve have beeninfluenced by systematic biases in the underlyingdata? A possible source of bias is thetruncation of stratigraphic ranges caused bylack of preservation or discovery; this wouldyield an artificially steepened survivorshipcurve. Errors in taxonomic judgment couldcause bias in the same or opposite direction:oversplitting of genera makes survivorshipcurves steeper, and lumping makes them lesssteep. Unfortunately, these biases are not rigorouslymeasurable. The marked deteriorationof the fit when other kill curves are tested,noted above, suggests that the fittingprocesses are not significantly influenced bybias in the data. That is, when simulations areperformed with any of the dashed kill curvesin Fig. 1, the resulting scatter is dramaticallydifferent from that observed in the <strong>Phanerozoic</strong>data.Because Eq. (2) for the kill curve is a continuousfunction, there can be no thresholds,or steps. The presence of thresholds cannotbe ruled out, of course, but there is no evidenceto suggest their presence. Furthermore,when histograms of extinctions have beenprepared (e.g., extinctions per stratigraphicstage), the distributions show right-skewingbut no clear bimodality or significant outliers.Only when the distributions are erroneouslyassumed to be symmetrical about the meanhas it been possible to claim that some eventsdiffer significantly from the record as a whole(see, e.g., the analysis by <strong>Raup</strong> and Sepkoski[I9821 and discussion by Stigler [1987]).As noted earlier, the 10,000-yr sampling intervalis used only for convenience becauseit is small enough to make multiple killingevents unlikely. The use of this short intervaldoes not imply that mass extinctions, such asin the late Permian or terminal Cretaceous,occurred over such a short interval, althoughthis is not precluded by the analysis.The kill curve in Fig. 1 (solid) should notbe confused with one for genera described inanother paper (<strong>Raup</strong> in press). The kill curvefor genera is purely ad hoc, whereas the speciescurve presented here was fit to actual<strong>Phanerozoic</strong> fossil data.