Soil Fertility and Plant Nutrition 2, Course Module - University of Idaho
Soil Fertility and Plant Nutrition 2, Course Module - University of Idaho
Soil Fertility and Plant Nutrition 2, Course Module - University of Idaho

Create successful ePaper yourself
Turn your PDF publications into a flip-book with our unique Google optimized e-Paper software.
<strong>Soil</strong> <strong>Fertility</strong><strong>and</strong><strong>Plant</strong> <strong>Nutrition</strong> 2<strong>Soil</strong>s 446-02<strong>Course</strong> <strong>Module</strong>Lecture Note Packet
Purpose <strong>of</strong> <strong>Course</strong><strong>Soil</strong> <strong>Fertility</strong> <strong>and</strong> <strong>Plant</strong> <strong>Nutrition</strong> 2 is a short course consisting <strong>of</strong> 15lectures. This short course covers the elements phosphorus, potassium,sulfur, calcium, magnesium, boron, chlorine, copper, iron, manganese,molybdenum, nickel, <strong>and</strong> zinc. This course emphasizes principles <strong>of</strong> soilfertility management <strong>and</strong> the availability <strong>of</strong> plant nutrients <strong>and</strong> theirrelationship to plant growth <strong>and</strong> fertilization practices.This short course is the second in a series <strong>of</strong> six modules in soil fertility<strong>and</strong> plant nutrition <strong>of</strong>fered by the <strong>University</strong> <strong>of</strong> <strong>Idaho</strong>. Your comments on thiscourse will be appreciated.
Outline <strong>of</strong> <strong>Course</strong><strong>Soil</strong>s 446<strong>Module</strong> 2: <strong>Soil</strong> <strong>Fertility</strong> <strong>and</strong> <strong>Plant</strong> <strong>Nutrition</strong> 2Lesson 1: Introduction; Fertilizer PlacementLesson 2: PhosphorusLesson 3: PhosphorusLesson 4: PhosphorusLesson 5: PotassiumLesson 6: SulfurLesson 7: Potassium FertilizersNote: there are no Lessons 8 <strong>and</strong> 9Lesson 10: Calcium; MagnesiumLesson 11: BoronLesson 12: ZincLesson 13: Molybdenum; ChlorineLesson 14: Copper, IronLesson 15: Iron; Manganese
Table <strong>of</strong> ContentsPage #Lesson 1: Introduction; Fertilizer Placement .......................................................... 7A. Nutrient Coverage ........................................................................................ 7B. Basic Methods <strong>of</strong> Solid Fertilizer Application .............................................. 8Lesson 2: Phosphorus ........................................................................................... 13A. General Information about Phosphorus .................................................... 13B. The P Cycle in <strong>Soil</strong>s ................................................................................... 14C. P Reactions in <strong>Soil</strong>s ................................................................................... 15D. Is P an Environmental Problem? ............................................................... 19E. Organic P .................................................................................................... 19Lesson 3: Phosphorus ........................................................................................... 21F. Historical <strong>and</strong> Current Phosphorus Use .................................................... 21G. Fertilizer Calculations <strong>and</strong> Terminilogy...................................................... 23H. Phosphate Fertilizers .................................................................................. 25Lesson 4: Phosphorus ........................................................................................... 32I. Phosphorus Uptake by <strong>Plant</strong>s.................................................................... 32J. Using P Fertilizers ...................................................................................... 34K. <strong>Soil</strong> Testing ................................................................................................. 38Lesson 5: Potassium.............................................................................................. 41A. General Information about Potassium ....................................................... 41B. Potassium in <strong>Soil</strong>s ...................................................................................... 42C. <strong>Plant</strong> <strong>and</strong> <strong>Soil</strong> Potassium Relationships.................................................... 46D. Potassium in the Pacific Northwest ........................................................... 48Lesson 6: Sulfur ..................................................................................................... 50A. General Information about Sulfur ............................................................... 50B. The Sulfur Cycle .......................................................................................... 52C. Sulfur Retention <strong>and</strong> Transformations in <strong>Soil</strong>s.......................................... 54D. Deficiencies <strong>of</strong> Sulfur ................................................................................. 56E. Fertilizer Recommendations for S in the PNW ......................................... 57Lesson 7: Potassium <strong>and</strong> Sulfur Fertilizers .......................................................... 59A. Historical <strong>and</strong> Current K Use ..................................................................... 59B. K Fertilizer Calculations ............................................................................. 60C. Potassium Fertilizers .................................................................................. 61D. Sulfur Fertilizers ......................................................................................... 62E. Fertilizer Calculations................................................................................. 66
Page #Note: There are no Lessons 8 <strong>and</strong> 9Lesson 10: Calcium; Magnesium .......................................................................... 71A. Calcium <strong>and</strong> Magnesium ............................................................................ 71B. General Comments .................................................................................... 73C. <strong>Soil</strong> <strong>and</strong> <strong>Plant</strong> Ca <strong>and</strong> Mg .......................................................................... 73D. Specifics — Calcium <strong>and</strong> Magnesium ....................................................... 74E. Calcium <strong>and</strong> Magnesium Fertilizers .......................................................... 76F. Calcium <strong>and</strong> Magnesium as Lime Materials ............................................. 77Lesson 11: Boron ................................................................................................... 80A. Boron Introduction ...................................................................................... 80B. Factors Affecting Crop Response to Boron............................................... 81C. Corrections <strong>of</strong> Boron Deficiencies in Field Situations .............................. 82D. Boron Fertilizer Sources ............................................................................ 83E. Boron Fertilizer Applications ...................................................................... 84F. <strong>Idaho</strong> Recommendations for Boron ........................................................... 85Lesson 12: Zinc ...................................................................................................... 86A. Zinc Introduction ......................................................................................... 86B. Factors Affecting Crop Response to Zinc.................................................. 87C. Corrections <strong>of</strong> Zinc Deficiencies in Field Situations ................................. 88D. Zinc Fertilizer Sources ............................................................................... 88E. Zinc Fertilizer Applications ......................................................................... 89F. <strong>Idaho</strong> Recommendations for Zinc .............................................................. 91Lesson 13: Molybdenum; Chlorine........................................................................ 92A. Molybdenum Introduction........................................................................... 92B. Factor Affecting Crop Response to Molybdenum ..................................... 93C. Correction <strong>of</strong> Molybdenum Deficiencies in Field Situations ..................... 93D. Molybdenum Fertilizer Sources ................................................................. 94E. Molybdenum Fertilizer Applications ........................................................... 95F. <strong>Idaho</strong> Recommendations for Molybdenum................................................ 97A. Forms <strong>and</strong> Function <strong>of</strong> Chlorine ................................................................. 97B. Factors Affecting Crop Response to Chlorine ........................................... 98C. Correction <strong>of</strong> Chlorine Deficiencies in Field Situations ............................ 98Lesson 14: Copper; Iron ........................................................................................ 99A. Copper Introduction..................................................................................... 99B. Factors Affecting Crop Response to Copper .......................................... 100C. Correction <strong>of</strong> Copper Deficiencies in Field Situations ............................ 101D. Copper Fertilizer Sources ........................................................................ 101E. Copper Fertilizer Applications .................................................................. 102F. <strong>Idaho</strong> Recommendations for Copper....................................................... 104
Page #Lesson 14: Copper; Iron (cont.)A. Iron Introduction ........................................................................................ 105B. Factors Affecting Crop Response to Iron ................................................ 105Lesson 15: Iron; Manganese ............................................................................... 107C. Correction <strong>of</strong> Iron Deficiencies in Field Situations .................................. 107D. Iron Fertilizer Sources .............................................................................. 107E. Iron Fertilizers Applications ...................................................................... 108F. <strong>Idaho</strong> Recommendations for Iron ............................................................ 109A. Manganese Introduction........................................................................... 110B. Factors Affecting Crop Response to Manganese ................................... 110C. Correction <strong>of</strong> Manganese Deficiencies in Field Situations ..................... 112D. Manganese Fertilizer Sources ................................................................. 113E. Manganese Fertilizer Applications........................................................... 114F. <strong>Idaho</strong> Recommendations for Manganese ............................................... 115Appendix MaterialsCIS 757 Fertilizer PlacementPNW 276 Current Nutrient Status <strong>of</strong> <strong>Soil</strong>s in <strong>Idaho</strong>, Oregon, <strong>and</strong> WashingtonCIS 165 Sulfur Fertilizer Improves Yield <strong>and</strong> Quality <strong>of</strong> S<strong>of</strong>t White WinterWheatCIS 1085 Boron in <strong>Idaho</strong>CIS 1088 Zinc in <strong>Idaho</strong>CIS 1087 Molybdenum in <strong>Idaho</strong>CIS 682 Copper in <strong>Idaho</strong>
LESSON 1IntroductionFertilizer PlacementA. Nutrient Coverageu14 soil derived essential nutrientsu N covered in 446-01uThe other 13 covered in this classMACROSP —K —S —Ca —Mg —MICROSB —Cl —Cu —Fe —Mn —Mo —
Zn —Ni —B. Basic Methods <strong>of</strong> Solid Fertilizer Application1. Broadcast Method2. Pup-Up3. B<strong>and</strong>ing1. Broadcast Methodsa. Broadcast topdressb. Broadcast incorporate(moldboard plow)c. Broadcast incorporate(chisel plow)d. Broadcast incorporate(disk)
uuuEach method <strong>of</strong> broadcast is an adequate one for theapplication <strong>of</strong> some nutrientsEach method is poor for some <strong>of</strong> the plant nutrients appliesA majority <strong>of</strong> fertilizer applied in the U.S. is put on as broadcastapplicationsBroadcast, preplant (PP) applications <strong>of</strong> solid fertilizers hasbecome very popular in recent years due to:1. The desire to lessen the time involved in h<strong>and</strong>ling fertilizers2.3. To reduce fertilizer injury to seedlings4. Development <strong>of</strong> bulk blends to put a lot <strong>of</strong> material on at onetimeBiggest problems with broadcast applications are:1.2.The following plant nutrients are generally broadcast:1.2.3.4.
5.6.7.8.Separate Cases:9. Potassium — generally applied either way (broadcast or b<strong>and</strong>)broadcast —b<strong>and</strong>ing — preferred in soils contianing a lot <strong>of</strong> vermiculite<strong>and</strong>/or illite — where K fixation occursFor K — in most soils it does not make any difference!!10.Phosphorus — broadcast only when you have moderate to highP levels already in the soil — at soil pHs 5.5 to 6.5Generally not boradcast:11.12.13.14.2. Pop-upuurefers to the placement <strong>of</strong> small amounts <strong>of</strong> nutrients in directseed contactusually for row crops
Pop-upuumore common in colder climatesP gives plant vigor in cold soils3. B<strong>and</strong> FertilizersuB<strong>and</strong> placement <strong>of</strong> nutrients here is intended to mean:uthe placement <strong>of</strong> the fertilizer in b<strong>and</strong>s on one or both sides<strong>of</strong> the seeds or seedlingsa. B<strong>and</strong> — Single Sideb. B<strong>and</strong> — Double Sidec. B<strong>and</strong> — Below Seedd. B<strong>and</strong> — Split Boot
uuFertilizer is place away from the seed to prevent salt damageFertilizer is commonly placed at a depth greater than the seedbecause:1. Prevents salt damage2. Avoids weed germinationuB<strong>and</strong> placement <strong>of</strong> nutrients is popular forP, K, Some MicrosTOPDRESS — Imply post-emergence applicationsSIDEDRESS — Post-emergence usually surface b<strong>and</strong>
LESSON 2PHOSPHORUSA. General Information about PhosphorusuuMacronutrient<strong>Plant</strong> Available Forms:–––uFunction in the <strong>Plant</strong>PPuMobility in <strong>Plant</strong>–uConcentration in <strong>Plant</strong>s:––
uDeficiency SymptomsPPB. The Phosphorus Cycle in <strong>Soil</strong>suuuSee diagram <strong>of</strong> P cycle in your text for more details (Havlinet al.)
C.Phosphorus Reactions in <strong>Soil</strong>s1. Basic ConceptsIn the soil:<strong>Plant</strong> Available PNon-Available P<strong>Soil</strong> Solution P Labile P Non-labile PNot <strong>Plant</strong> Available2. Basic Terms <strong>and</strong> DefinitionsSOIL SOLUTION P — includes H 2PO 4-, HPO 42-, PO 43-; consideredplant available P; approximately 1% <strong>of</strong> the P in the soilLABILE P — not plant available; consists <strong>of</strong> the more soluble Al-P<strong>and</strong> Ca-P compounds in the soil; replaces soil solution P asplant uptake occursNON-LABILE P — not plant available; consists <strong>of</strong> very insolubleCa-P, Al-P, <strong>and</strong> Fe-P compounds; can replace labile P as it istransformed to soil solution P
P Fixation — any change that fertilizer P undergoes that lessensits availability to plantsP Adsorption — retention <strong>of</strong> P at the surface <strong>of</strong> somethingP Absorption — retention within a solid phase (plants absorb P)Sorption — P solubility has been reduced (no mechanism implied)3. How is P Retained in <strong>Soil</strong>s?uclays; the higher the percentage clay in the soil the greater theP retention–– the more clay you haveP ACID SOILS — have Al <strong>and</strong> FeAdd Al +++Add FeP ALKALINE SOILS —Add Ca ++P NEUTRAL TO SLIGHTLY ACID SOILS (pH 6.0-7.2)––
Relation <strong>of</strong> soil pH to labile <strong>and</strong> non-labile P compounds in thesoil:Where is max P availability?– where most <strong>of</strong> the P is in the labile form — pH 5.5–6.5–
Relationship <strong>of</strong> soil pH to labile <strong>and</strong> non-labile P in soils:<strong>Soil</strong> pH Labile P Non-labile P-----------------------%-----------------------4 < 20 > 8056789 < 10 > 90Initial P in soils:---------------------------------- P form ----------------------------------<strong>Soil</strong> pH Fe-P Al-P(N) Al-P(L) Ca-P(L) Ca-P(N) Apatite---------------------------------- ppm P -----------------------------------Mollisol 6.2 – 4 12 118 170 16Aridisol 8.1 – – – 80 370 180Ultisol 5.6 20 85 102 30 26 –Ultisol 4.8 80 71 15 1 – –Now add 300 lbs PMollisol 6.2 –Aridisol 8.1 – – –Ultisol 5.6 –Ultisol 4.8 – –What does the table say?– When you add fertilizer P —– Where pH values are favorable —
D.Is P an Environmental Problem?a. Human Health–b. Groundwater––c. Surface waters– major problem —– erosion <strong>of</strong> soils puts P into surface water bodies–––E. Organic PhosphorusuuOrganic P is a major source <strong>of</strong> P in many soils; may constituteup to 50% <strong>of</strong> P in many USA soilsOrganic P is mineralized by microbes into the plant availableform; once made available is subject to fixation processesin the soil
u––
LESSON 3PHOSPHORUSF. Historical <strong>and</strong> Current Phosphorus UseuMost <strong>of</strong> the P produced in the world is used in agricultureu Worldwide P fertilizer use has grown dramatically since 1960------P fertilizer use (tons)------Year USA World total1960 2,572,000 9,970,0001980 5,431,000 31,700,0001999 4,345,000 31,018,000–
–– Major users are: China (8.8 m tons), USA (4.3 m tons), India(2.9 m tons), Brazil (1.5 m tons), France (1.0 m tons)uP fertilizer production is concentrated in four regions <strong>of</strong> theworld:–– most P in the USA is produced in 5 states
uFuture Phosphorus MaterialsCountry*** Reserves* Resources**-------------------- tons --------------------Morocco 5,900,000,000 21,000,000,000USAOtherWorld total 11,000,000,000 33,000,000,000* Reserves are based on a production cost <strong>of</strong> $36.00 per ton** Resources are based on a production cost <strong>of</strong> $90.00 per ton*** World has reserves for 80 years, resources for 240 yearsG. Fertilizer Calculations <strong>and</strong> Terminology1. Calculation <strong>of</strong> P Content in Fertilizersa. N - P - KuHistorically, the P content <strong>of</strong> fertilizers has been expressedin terms <strong>of</strong> its P 2O 5equivalentuub. Conversion FactorsuTo convert %P to %P 2O 5<strong>and</strong> %P 2O 5to %P:
uFor instance, if we wanted to know the %P 2O 5in dicalciumphosphate (CaHPO 4) we would first calculate the %P:Ca = 40; H = 1; 0 = 16; P = 31
2. Phosphate Fertilizer TechnologyuThe solubility <strong>of</strong> P in different carriers (fertilizers) is variable.Therefore certain terms should be understood:Water Soluble Phosphorus — fertilizer extracted with water;expressed as a percentage by weight <strong>of</strong> sampleCitrate Soluble Phosphorus — residue from water soluble PCitrate Insoluble Phosphorus — the residue remaining fromthe water <strong>and</strong> citrate extraction is analyzed. Theamount <strong>of</strong> P remaining is termed citrate-insolubleAvailable Phosphorus —Example: 0 – 18 – 0 — Rock phosphateTotal Phosphorus —H.Phosphate FertilizersuThe original sources <strong>of</strong> P fertilizers were bones <strong>and</strong> sewagewastes from ancient cities
u––1. Organic P Fertilizer MaterialsuThe organic P fertilizer materials used in the USA consist <strong>of</strong>:–––uManures are becoming a more important source <strong>of</strong> PDairy cattleSwinePoultryHorsesSludge (municipal)% P (average)2. Inorganic P FertilizersuAlmost all commercial P fertilizers are made from rockphosphate
Phosphorus Fertilizer Manufacture:a. Rock phosphateuuRock phosphate by itself is not a good fertilizer. It must betreated with chemicals to break Ca-P bonds <strong>and</strong> render thecontained P more plant available
. Acid Treated PhosphatesuSulfuric AciduPhosphoric Acid - manufactured by treating rockphosphate with sulfuric acid (high concentration)P Rock phosphate + sulfuric acid (high concentration)P White or Furnace Acid––––Phosphoric acid contains:17 – 24% PP H 3PO 4can be used directly in calcareous soils byinjection or added to irrigation water
c. Calcium Orthophosphates — traditional P fertilizersuOrdinary Superphosphate (OSP)– made by reacting– known as OSP (ordinary superphosphate) or NSP (normalsuperphosphate) or SSP (single superphosphate)–uTriple Superphosphate (TSP)– made by reacting––d. Ammonium Phosphatesuu Are completely water soluble (100% available P)
uMonoammonium phosphate (MAP)–––uDiammonium phosphate (DAP)–––––e. Ammonium Polyphosphates (APP)–– 100% available P––
–f. Acidity– Liquid APP can be reacted with urea to produce ureaammoniumphosphate (UAP)– UAP is a solid <strong>and</strong> has a common grade <strong>of</strong> 28 – 12 – 0–––
LESSON 4PHOSPHORUSI. Phosphorus Uptake by <strong>Plant</strong>s1. Yield ResponseOne can expect a yield response to P when:uu2. Crop QualityuuThere is frequently a quality effect in addition to the yieldincrease which has an influence on the dollar return for thecropCorn data from Illinois: There was a definite improvement inquality following P application in Illinois. This improvementcame about as a result <strong>of</strong> earlier crop maturityP 2O 5Rate Moisture in Grain Dockageat Harvestlb/acre % $/bu080Cost <strong>of</strong> P per acre = $14.40Quality <strong>of</strong> grain per acre = $33.00
3. Moisturea. General AspectsuAdequate fertility including P helps crops use moistureefficiently. The following aspects are affected by P:––––b. <strong>Soil</strong> Moisture <strong>and</strong> AlfalfauComments:– Alfalfa is more efficient at using water when adequate Pis applied–
J. Using Phosphorus Fertilizersu When P fertilizers are added to soils fixation takes place in a 2stage process:Phase A —Phase B —uWant to reduce the speed <strong>of</strong> fixationOptions:PP
1. Availability <strong>of</strong> P Fertilizersa. Water Solubility <strong>and</strong> Granule SizeBAND APPLICATIONSWater Sol P (%)----------Fertilizer Material----------OSP (-6 +14)* OSP (-35)**Wheat dry weight (grams)70 7.34 7.4057 7.19 7.0653 7.00 6.5132 5.72 4.9814 4.49 4.51No P 2.93 2.93* -6 +14 means the fertilizer material passes through a 6 mesh sieve butis held by a 14 mesh sieve** -35 means the fertilizer material passes through a 35 mesh sieveLSD = 0.51 for yield differenceTable meaning:uu
BROADCAST INCORPORATED APPLICATIONSWater Sol P (%)----------Fertilizer Material----------OSP (-6 +14)* OSP (-35)**Wheat dry weight (grams)70 4.77 2.9657 4.37 2.4753 3.00 2.2032 2.87 1.6714 2.40 1.70No P 1.30 1.30LSD = 1.40Table meaning:uuu2. Temperature <strong>and</strong> PlacementPlacement Regimes–––
Wheat yields as a function <strong>of</strong> P placement:---------------Placement---------------B<strong>and</strong>ed B<strong>and</strong>edLocation Broadcast below seed with seed LSD---------------yield bu/ac---------------MoscowS<strong>and</strong>point (colder)Table comments:PPP
K. <strong>Soil</strong> Testing — PhosphorusA lot <strong>of</strong> soil test correlation research has been done with PSOIL pH FePO 4AlPO 4CaPO 4Apatite34567891011uu<strong>Soil</strong> test extractants for P differ because <strong>of</strong> the form <strong>of</strong> P held insoilsIn alkaline soils most P is held as Ca-P so you want:uIn acid soils most P is held as Al-P so you want:
uIn neutral pH soils P is held as both Al-P <strong>and</strong> Ca-P so you want:Common phosphorus soil tests:<strong>Soil</strong> testBray IBray IIExtractants0.025N HCl + 0.03N NH 4F0.1N HCl + 0.03N NH 4FNorth Carolina 0.05N HCl + 0.025N H 2SO 4(double acid)Troug 0.002N H 2SO 4Citric AcidEngerMorgan1% citric acid0.02N Ca-lactate + 0.02N HCl0.54N HOAc + 0.7N NaOAcOlsen 0.5M NaHCO 3Phosphorus tests in the Pacific Northwest:Acid soils:PPNuetral/alkaline soils:P
P research needs:1. St<strong>and</strong>ardization in region for wheat:<strong>Soil</strong> testNaOAcNaHCO 3Critical P level4 ppm10 ppm2. Correlation between P values for different soil tests3. Development <strong>of</strong> a better (universal) soil test4. More international st<strong>and</strong>ardizaitonThe <strong>Idaho</strong> Situation:
LESSON 5POTASSIUMA.General Information about PotassiumuuMacronutrient<strong>Plant</strong> Available Form–uMobility in <strong>Plant</strong>–uFunction in the <strong>Plant</strong>––– energy relations–u<strong>Plant</strong> Content– average:– range:
uDeficiency SymptomsP spots, yellowish-brownish color along margins <strong>of</strong> olderleavesPPotassium uptake by plants:Crop Yield K (lbs/acre)Corn120 bu200 buWheat100 buPotatoes600 cwtAlfalfa6 tonsB. Potassium in <strong>Soil</strong>s1. Content in <strong>Soil</strong>suOn an elemental basis, many soils contain large amounts <strong>of</strong>potassiumuuIn the USA: 0.2 – 1.8% K– Western USA– Southcentral States– Southeast States– Northeast States
2. Chemical Forms <strong>of</strong> Potassium in <strong>Soil</strong>sMineral K non-exchangeable K exchangeable K soil soln. K–P consists <strong>of</strong> 90 to 98% <strong>of</strong> the K in the soil– exchangeable K <strong>and</strong> soil solution K are plant available forms<strong>of</strong> KP consists <strong>of</strong> 2 to 10% <strong>of</strong> the K in the soil3. Losses <strong>of</strong> Potassium from <strong>Soil</strong>sa. Crop Removalub. Leaching LossesuThe annual loss <strong>of</strong> N, P, <strong>and</strong> K in drainage water from columns<strong>of</strong> fertilized <strong>and</strong> unfertilized s<strong>and</strong>y soils in South Carolina:--------------------Annual Loss--------------------Treatment Nitrogen Phosphorus Potassium--------------------------kg/ha-------------------------FertilizedUnfertilizedProportion <strong>of</strong>added nutrientlost 56% 1% 44%
c. ErosionuuPotassium losses are seldom taken as seriously as N lossesbecause <strong>of</strong> the differences within the soil pr<strong>of</strong>ile<strong>Soil</strong> pr<strong>of</strong>ile distribution <strong>of</strong> N, P <strong>and</strong> K:
4. Weathering <strong>of</strong> Unavailable Potassium in <strong>Soil</strong>sa. Mineralogical Formsi. Feldsparsii. MicaMuscovite–Biotite–iii. Clay mica (illite)5. Potassium FixationuuSame as ammonium fixationPhysical processu
Ca ++ Mg ++ K + Al +++ 2:1 clayC. <strong>Plant</strong> <strong>and</strong> <strong>Soil</strong> Potassium Relationships1. Potassium Status Defined in <strong>Plant</strong> Availabilitya. Immediately Available–b. Moderately Available––c. Very Slowly Available–2. Management Practices to Reduce Leaching Lossesa. Amount <strong>and</strong> Nature <strong>of</strong> CECEase <strong>of</strong> Cation Release:1:1 clay
. Broadcasting vs B<strong>and</strong>ing:Rules <strong>of</strong> thumb:––– B<strong>and</strong> in potential for K fixation–Keys:3 meq / 100g
D.Potassium in the Pacific Northwest1. <strong>Soil</strong> KuuuSee Map2. <strong>Soil</strong> Test ValuesExtractant:NaOAc ––NaHCO 3––Potassium fertilizer rates for winter wheat based on soil tests forboth sodium bicarbonate <strong>and</strong> sodium acetate.----------<strong>Soil</strong> Test K ----------Apply (lbs/acre)Sodium acetate Sodium bicarbonate K 2O K------------ppm K ------------0 to 35 0 to 4035 to 75 40 to 70over 75 over 70
LESSON 6SULFURA.General Information about Sulfur1. Forms <strong>and</strong> Function <strong>of</strong> Sulfura. Function <strong>of</strong> Sulfur in <strong>Plant</strong>su–––uub. <strong>Plant</strong> Available Forms <strong>of</strong> Sulfuruuc. Sulfur Mobility in <strong>Plant</strong>suu
ud. Sulfur Content in <strong>Plant</strong>suue. Sulfur Deficiency Symptoms in <strong>Plant</strong>s:u<strong>Plant</strong>s turn yellow-greenuuf. Sulfur Levels in PNW <strong>Soil</strong>suWidely deficient in soils <strong>of</strong> the Pacific Northwestg. <strong>Soil</strong> Testing for SuPoor soil test; must use in combination with other methods <strong>of</strong>diagnosisSulfur uptake by common crops:Crop Yield S (lbs/acre)Corn120 bu200 bu
WheatPotatoesAlfalfa100 bu600 cwt6 tonsB.The Sulfur CycleuuChemical phaseMicrobiological phase(from <strong>Soil</strong> <strong>Fertility</strong> <strong>and</strong> Fertilizers by Havlin, Beaton, Tisdale, <strong>and</strong>Nelson)uu1. Sources <strong>of</strong> Sulfur in <strong>Soil</strong>sa. Igneous Rocksu
ub. AtmosphereuuSO 2can be directly absorbed by plant leavesuc. Organic MatteruOrganic matter is generally the largest source <strong>of</strong> soils intemperate regionsud. Secondary MineralsuuuuC.Sulfur Retention <strong>and</strong> Transformations in <strong>Soil</strong>s1. Organic SulfurMineralization — conversion <strong>of</strong> unavailable S (organic S) to SO 42-
uImmobilization — conversion <strong>of</strong> plant available S to organic SuuuuSulfur oxidation <strong>and</strong> mineralization processes are carriedout by microbes2. S Transformationsa. Sulfur MineralizationuuDRY — Microbes die <strong>and</strong> add bodies to OMWET — DEAD bodies mineralized
. SO 42-udominant form <strong>of</strong> plant available S in soilsu SO 42-u SO 42-c. Sulfate Retention in <strong>Soil</strong>sAcid soils:uPuif no AECAlkaline soils:
uD.Deficiencies <strong>of</strong> Sulfur1. <strong>Soil</strong>sThe following conditions create a tendency for deficiencies <strong>of</strong>sulfur:uucoarse textured soilsuuulow concentration <strong>of</strong> industry (lack <strong>of</strong> air pollution)uP The more <strong>of</strong> the above tendencies — the greater the chance <strong>of</strong>sulfur deficienciesuThe <strong>Idaho</strong> situation:llllLow organic matter in southern <strong>Idaho</strong>ulDeficiencies found throughout the state — except in areas <strong>of</strong>the south where irrigation water contains plenty <strong>of</strong> sulfur
<strong>and</strong> in forests which are not fertilized with nitrogen2. <strong>Plant</strong>s<strong>Soil</strong> N:S =<strong>Plant</strong> N:S =Amino acids —uuIf S is limiting in the soil, plants can not use high rates <strong>of</strong> NE. Fertilizer Recommendations for Sulfur in the PNW1. <strong>Soil</strong> Test Correlation DatauYield response data (correlation) in the PNW is pooru2. Will Sulfur Additions Improve Yields?u Yes —uS additions may improve crop quality (see wheat qualityh<strong>and</strong>out)3. Sulfur Rates to Apply:
u<strong>Soil</strong> test values below 10 ppm:PuMaximum rates <strong>of</strong> S to apply:P4. Frequency <strong>of</strong> S <strong>Soil</strong> TestinguuTake soil samples to the effective rooting depth <strong>of</strong> cropuLESSON 7
POTASSIUM AND SULFUR FERTILIZERSA.Historical <strong>and</strong> Current K UseuOver 98% <strong>of</strong> the K produced in the world is used in agricultureu------K fertilizer use (tons)------Year USA World total1960 2,153,300 8,710,0001980 6,245,100 24,054,0001999 5,015,800 21,110,000– K use peaked in the USA in 1981 (6,319,500 tons)–– Major users are: USA (4.9 m tons), China (3.1 m tons), Brazil(1.7 m tons), France (1.5 m tons), India (1.2 m tons)uPotassium fertilizer production is concentrated in 55 mines in
just a few countries:–– in North America most K is produced in SaskatoonuFuture Potassium Materials:Country Reserves Resources---------------------- tons ------------------------Canada 4,500,000,000 10,500,000,000Russia/Belarus 2,600,000,000 3,400,000,000World total 8,000,000,000 17,000,000,000B. Potassium Fertilizer Calculations1. N - P - Kuu% K ¹ % K 2O2. Conversion Factors
u To convert % K to % K 2O <strong>and</strong> % K 2O to % K:% K% K 2OC.Potassium Fertilizers1. Potassium Chloride (KCl)––– also known as muriate <strong>of</strong> potash– > 85% <strong>of</strong> K sold in the USA is KCl––– comes primarily from Canada2. Potassium Sulfate (K 2SO 4)–––– also known as sulfate <strong>of</strong> potash–
–– more expensive than KCl3. Organic K Sources– Animal wastes (0.2 – 2% K)––4. Other Inorganic K Sources– Potassium nitrate (KNO 3)P– Potassium magnesium sulfate (K 2SO 4l MgSO 4)PD.Sulfur Fertilizers1. The PastuuTraditionally:
OSPAmmonium SPuNewer High Analysis Materials:MAPTSP2. Modern Sources:uSupply sulfur because <strong>of</strong> need; nutrient is not a give-awayanymorea. Ammonium Sulfate (NH 4) 2SO 4––– major S source–b. Ammonium phosphate — ammonium sulfate
––– common source–c. Gypsum CaSO 4l XH 2O––– S. <strong>Idaho</strong>– N. <strong>Idaho</strong>d. Elemental sulfur– an unavailable form <strong>of</strong> S––e. Sulfur coated urea (SCU)
––– S is elemental Sf. Urea-ammonium sulfate––g. Ammonium nitrate-sulfate–– two forms <strong>of</strong> N (NH 4, NO 3)E. Fertilizer Calculations
Sample Problems:1. Formulate 3 tons (6,000 lbs) <strong>of</strong> a 0-0-25 fertilizer using thefollowing sources:a. Potassium source: KClb. Potassium source: K 2SO 42. Formulate 2 tons <strong>of</strong> a 10-0-10 fertilizer. Your fertilizer sources
are KCl <strong>and</strong> urea:3. Formulate 5 tons <strong>of</strong> a 12-6-8 fertilizer using urea, triplesuperphosphate, <strong>and</strong> potassium sulfate:4. Formulate 4 tons <strong>of</strong> a 20-0-0-8 fertilizer using ammonium sulfate
<strong>and</strong> urea:5. Formulate 5 tons <strong>of</strong> a 6-3-10-2 fertilizer using 16-20-0-15,0-44-0, 34-0-0, <strong>and</strong> 0-0-60:6. Formulate 3 tons <strong>of</strong> a 10-10-10-5 fertilizer using urea,
ammonium sulfate, potassium chloride, <strong>and</strong> triplesuperphosphate:7. Formulate 6 tons <strong>of</strong> a 10-0-25-4 fertilizer using ammoniumnitrate, potassium chloride, <strong>and</strong> potassium sulfate:8. Formulate 5 tons <strong>of</strong> a 10-10-0-4 fertilizer using monoammonium
phosphate, ammonium sulfate, <strong>and</strong> urea:
LESSON 10CalciumMagnesiumA. Calcium <strong>and</strong> Magnesium1. Forms <strong>and</strong> Functions <strong>of</strong> Ca <strong>and</strong> Mga. FunctionCALCIUM:uuuMAGNESIUM:ub. <strong>Plant</strong> Available FormsCALCIUM:uMAGNESIUM:uc. Mobility in <strong>Plant</strong>sCa –Mg –
d. Content in <strong>Plant</strong>sCa ––Mg––e. Deficiency Symptoms in <strong>Plant</strong>sCALCIUM:uuMAGNESIUM:uuf. Ca <strong>and</strong> Mg Levels in PNW <strong>Soil</strong>sCALCIUM:uNot a problemMAGNESIUM:uProblems are limited to low Mg levels in grass pasturesGRASS TETANY
CALCIUM AND MAGNESIUM<strong>Plant</strong> uptakeCorn Yield Ca Mglbs/acreCornWheatPotatoesAlfalfa120 bu200 bu100 bu600 cwt6 tonsB.General CommentsCa ++ <strong>and</strong> Mg ++ in the soil solution can be:1. lost in drainage water2. absorbed by microbes3. absorbed by plants4. adsorbed onto surrounding clay particles5. repreceipitated as a secondary Ca ++ <strong>and</strong>/or Mg ++ compoundC.<strong>Soil</strong> <strong>and</strong> <strong>Plant</strong> Ca <strong>and</strong> Mg1. Origin <strong>and</strong> forms <strong>of</strong> Calciuma. Origin in Rocks <strong>and</strong> Mineralsuuuuu
. Availabilityu <strong>Soil</strong> solution Ca ++u Exchangeable Ca ++2. Origin <strong>and</strong> Forms <strong>of</strong> Magnesiuma. Origin in Rocks <strong>and</strong> Mineralsuuuuub. Availabilityu <strong>Soil</strong> solution Mg ++u Exchangeable Mg ++D.Specifics — Calcium <strong>and</strong> Magnesium1. CALCIUMuuCalcium is rarely limiting crop growth in the Western USACalcium content <strong>of</strong> arid aoils is high — high levels <strong>of</strong>:u CaCO 3u CaSO 4uThe only place we have Ca problems is where the soils are veryacid (Al +++ crowds out Ca ++ on CEC)
uCalcium should occupy at least 15% <strong>of</strong> the CEC sites on clays(In <strong>Idaho</strong>, Ca generally occupies at least 85% <strong>of</strong> the sites)2. MAGNESIUMuuMagnesium is generally not limiting crop production in thePacific NorthwestPROBLEMS:GRASS TETANY –Forage Protein Content –Legumes –
E. Calcium <strong>and</strong> Magnesium Fertilizers1. CALCIUMuCalcium nitrateuCalcium cyanimideuPhosphate rockuGypsumuLime2. MAGNESIUMuMagnesium sulfateuMagnesium-Ammonium phosphate
uPotassium-Magnesium sulfateuMagnesium oxideuDolomiteF. Calcium <strong>and</strong> Magnesium as Lime MaterialsuuCa <strong>and</strong> Mg are most <strong>of</strong>ten applied as lime materials to raise soilpH valuesCommon lime materials include:Lime Material Quality(1) Chemical Composition(2) Particle Size
State REgulations<strong>Idaho</strong>:Washington:Lime Requirement Tests<strong>Idaho</strong> Lime Requirement Test:
Washington:Oregon:When to request a lime requirement test:uuu
LESSON 11BoronA.Boron Introduction(Reading Assignment: Current Information SeriesNo. 1085, Boron in <strong>Idaho</strong>)1. Forms <strong>and</strong> Function <strong>of</strong> Borona. Function <strong>of</strong> Boron in <strong>Plant</strong>suuub. <strong>Plant</strong> Available Forms <strong>of</strong> Boronc. Boron Mobility in <strong>Plant</strong>sd. Boron Content in <strong>Plant</strong>se. Boron Deficiency Symptoms in <strong>Plant</strong>s
f. Boron Levels in PNW <strong>Soil</strong>sB.Factors Affecting Crop Response to Boron1. <strong>Soil</strong> pHuu2. <strong>Soil</strong> Moistureu3. <strong>Soil</strong> Organic Matteru<strong>Soil</strong> OM weathers to release plant available boronu4. <strong>Soil</strong> TextureuCoarse textured soils tend to be deficient because <strong>of</strong> leachingprocesses5. <strong>Soil</strong> Reservesu
uuC.Correction <strong>of</strong> Boron Deficiencies in Field SituationsuuuB deficiencies most <strong>of</strong>ten occur on coarse textured soils (lowOM), <strong>and</strong> in humid areas where precipitation has leached Bout <strong>of</strong> the soil pr<strong>of</strong>ile<strong>Plant</strong>s that are members <strong>of</strong> the grass family have a lower Brequirement than other plant species; monocots need onlyabout 25% as much B as do dicotsBoron deficiencies are most common on alfalfa <strong>and</strong> on certainroot <strong>and</strong> cruciferous crops such as turnips, cabbage,cauliflower, <strong>and</strong> rutabagasuuuBoron deficiencies in <strong>Idaho</strong> are widespread
D.Boron Fertilizer SourcesuInorganic sources <strong>of</strong> BuBoron fertilizer sources include:u Borated gypsum —u Borax —u Boric acid —u Solubor —u Boron frits —u Fertilizer borate 46 or 65 —
E. <strong>Soil</strong> Applications <strong>of</strong> Boron1. <strong>Soil</strong> ApplicationsuuAn application rate <strong>of</strong> 1 to 3 lbs B/acre is needed for soiltreatments <strong>of</strong> legumes <strong>and</strong> certain root <strong>and</strong> cruciferous rootcrops, while lower rates <strong>of</strong> 0.5 to 1 lb B/acre are needed forother cropsPlacement:uCropsuu2. Foliar Boron ApplicationsuPopular on tree fruitsuuProblem with foliar applications on row crops is a lack <strong>of</strong> Bmobility in plants; requiring repeated applications duringthe growing season for satisfactory resultsu
uFor a B deficient crop the need is <strong>of</strong>ten 0.5 lb B/acre; the 0.5 lbshould be divided by the number <strong>of</strong> times it will be appliedover the season to get the correct rate for each application3. Boron Seed Treatmentsu NEVER ! ! !4. Residual Boron Fertilization EffectsuPersistence determined by soil type, form <strong>of</strong> B applied, <strong>and</strong>climate; from 1 to 5 years5. Boron Toxicity ProblemsuuuResults when plants take up too much BNarrow range between deficiency <strong>and</strong> toxicityApply B at low rates — after needs established by soil testingF. <strong>Idaho</strong> Recommendations for Boron1. Critical <strong>Soil</strong> Test Level2. <strong>Soil</strong> Test Extractantsu3. Recommendationsu<strong>Soil</strong> test every 3 years when a B dem<strong>and</strong>ing crop is in therotationu
LESSON 12ZincA.Zinc Introduction(Reading Assignment: Current Information SeriesNo. 1088, Zinc in <strong>Idaho</strong>)1. Forms <strong>and</strong> Function <strong>of</strong> Zinca. Function <strong>of</strong> Zinc in <strong>Plant</strong>suuub. <strong>Plant</strong> Available Forms <strong>of</strong> Zincc. Zinc Mobility in <strong>Plant</strong>sd. Zinc Content in <strong>Plant</strong>se. Zinc Deficiency Symptoms in <strong>Plant</strong>sf. Zinc Levels in PNW <strong>Soil</strong>s
B.Factors Affecting Crop Response to Zinc1. <strong>Soil</strong> pHuMost Zn deficiencies occur in high pH soiluuLow pH soils usually contain adequate levels <strong>of</strong> Zn2. <strong>Soil</strong> Organic Matteruu3. Adsorption in Calcareous <strong>Soil</strong>suAffected by level <strong>of</strong>:uuuMagnesiteDolomiteCalciteuZn can replace Mg in the lattice <strong>of</strong> magnesite <strong>and</strong> dolomite4. Climateu
uIncreased temperature <strong>and</strong> daylength will <strong>of</strong>ten cause Znsymptoms to disappear5. <strong>Soil</strong> Phosphorus LeveluuHigh levels <strong>of</strong> soil P tend to promote Zn deficienciesWhen P:Zn ratios in plants are wide, deficiency symptomssometimes develop6. <strong>Soil</strong> ReservesuuC.Correction <strong>of</strong> Zinc Deficiencies in Field SituationsuuZn deficiencies have been recognized for a long timeProblems: low OM soils, calcareous soils, soils leveled forirrigationD.Zinc Fertilizer SourcesuuuBoth organic <strong>and</strong> inorganic sources <strong>of</strong> Zn can be used tocorrect deficienciesINORGANICORGANIC
uZn sources include:u Zinc sulfate —u Zinc chelates —u Zinc frits —u Zinc oxide —u Other sources —E. <strong>Soil</strong> Applications <strong>of</strong> Zinc1. <strong>Soil</strong> Applications <strong>of</strong> Zincu<strong>Soil</strong> applications are by far the most common <strong>and</strong> successfulmethods <strong>of</strong> correcting deficiencies for most crops
uZinc placement:2. Foliar Zinc ApplicationsuTemporary — only use in emergenciesuu3. Zinc Seed TreatmentsuNo proven success; most work with beans4. Residual Effectsu<strong>Soil</strong> applications <strong>of</strong> 5 to 10 lbs/acre last at least 3 years;probably more than 5 years
5. Zinc Toxicity ProblemsuF. <strong>Idaho</strong> Recommendations for Zinc1. Critical <strong>Soil</strong> Test Level2. RecommendationsuuuApplication rates range from 2 to 25 lbs/acre depending on thesituation <strong>and</strong> the cropIn <strong>Idaho</strong>, recommendation rates typically range from 5 to 10 lbsZn/acre for high Zn dem<strong>and</strong>ing cropsMany <strong>Idaho</strong> crops are not responsive to Zn additionsu
LESSON 13MolybdenumChlorineA.Molybdenum Introduction(Reading Assignment: Current Information SeriesNo. 1087, Molybdenum in <strong>Idaho</strong>)1. Forms <strong>and</strong> Function <strong>of</strong> Molybdenuma. Function <strong>of</strong> Molybdenum in <strong>Plant</strong>suuub. <strong>Plant</strong> Available Form <strong>of</strong> Moc. Molybdenum Mobility in <strong>Plant</strong>sd. Molybdenum Content in <strong>Plant</strong>s
e. Molybdenum Deficiency Symptoms in <strong>Plant</strong>sf. Molybdenum Levels in PNW <strong>Soil</strong>sB.Factors Affecting Crop Response to Molybdenum1. <strong>Soil</strong> pHuuMo availability is pH dependant; greatest availability in high pHsoils2. <strong>Soil</strong> TextureuSince Mo is mobile in soils, s<strong>and</strong>y soils, or areas with highprecipitation may tend toward Mo deficiencies3. <strong>Soil</strong> ReservesuDeficiencies can exist on leached s<strong>and</strong>s, acid Inceptisols,Spodosols, <strong>and</strong> HistosolsC.Correction <strong>of</strong> Molybdenum Deficiencies in FieldSituationsuMo deficiencies are found worldwide; especially in Australia,New Zeal<strong>and</strong>, <strong>and</strong> the USA
uuMo deficiencies are most <strong>of</strong>ten observed on legumes since Mois required for nitrogen fixationCommonly deficient crops in <strong>Idaho</strong> include:uuuuMolybdenum deficient areas in <strong>Idaho</strong> include:D.Molybdenum Fertilizer MaterialsuuuInorganic sources can be used to correct Mo deficienciesOrganic sources are not usedInorganic Mo sources include:u Sodium molybdate —u Ammonium molybdate —
u Molybdenum trioxide —u Molybdenum frits —u Molybdenum sulfide —E. <strong>Soil</strong> Applications <strong>of</strong> Molybdenum1. <strong>Soil</strong> Applications <strong>of</strong> MolybdenumuuThe quantity <strong>of</strong> Mo needed to correct deficiencies is very small(maximum <strong>of</strong> 1 lb Mo/acre)Difficult to distribute such a small amount over an acre2. Foliar Applications <strong>of</strong> Molybdenumuuu
3. Molybdenum Seed TreatmentsuuMost common method <strong>of</strong> correcting Mo problems in soilsCan be applied with Rhizobium inoculumu4. Residual Fertilizer Effectsuu<strong>Soil</strong>/seed application may last several years (5 or more) inneutral to alkaline soilsAcid soils may require applications every 2 to 4 years5. Molybdenum Toxicity Problemsuuu Animals eating plants lack Mo tolerance MOLYBDENOSISCu deficiency
F. <strong>Idaho</strong> Recommendations for Molybdenum1. Critical <strong>Soil</strong> Test Level2. RecommendationuChlorineA.Forms <strong>and</strong> Function <strong>of</strong> Chlorine1. Function <strong>of</strong> Chlorine in <strong>Plant</strong>s2.`<strong>Plant</strong> Available Forms <strong>of</strong> Chlorine
B.Factors Affecting Crop Response to ChlorineuC.Correction <strong>of</strong> Chlorine Deficiencies in Field Situationsu
LESSON 14CopperIronA. Copper Introduction(Reading Assignment: Current Information SeriesNo. 682, Copper in <strong>Idaho</strong>)1. Forms <strong>and</strong> Function <strong>of</strong> Coppera. Function <strong>of</strong> Cu in <strong>Plant</strong>sub. <strong>Plant</strong> Available Form <strong>of</strong> Copperuc. Copper Mobility in <strong>Plant</strong>sd. Copper Content in <strong>Plant</strong>se. Copper Deficiency Symptoms in <strong>Plant</strong>suuIndistinctDeficiencies appear in younger leaves firstf. Copper Levels in PNW <strong>Soil</strong>s
B.Factors Affecting Crop Response to Copper1. <strong>Soil</strong> pHuuCu is more available in acid soils; however, Cu deficiencies arerarely observed on alkaline soilsConsequently, most deficiencies occur in low pH soils2. <strong>Soil</strong> Organic MatteruCu forms complexes with organic matter; these complexesreduce Cu availabilityu3. Competition with other Micronutrientsu<strong>Soil</strong>s high in Fe ++ are <strong>of</strong>ten Cu deficient; antagonism4. Aluminum in the <strong>Soil</strong> SolutionuAl is competitive <strong>and</strong> will inhibit Cu uptakeu5. <strong>Soil</strong> Reservesu
uC.Correction <strong>of</strong> Copper Deficiencies in Field SituationsuCopper deficiencies have been associated with:1. soils high in organic matter, or2. highly weathered s<strong>and</strong>y mineral soilsu Peat soils are usually low in Cu ++30% OMuDeficiencies in various crops produce abnormal coloring,abnormal development, reduced fruit <strong>and</strong> grain quality, <strong>and</strong>reduced grain yieldD.Copper Fertilizer MaterialsuuBoth inorganic <strong>and</strong> organic sources <strong>of</strong> Cu can be used tocorrect deficienciesCommon sources include:u Copper sulfate —u Copper chelates —
u Copper frits —E. Copper Fertilizer Applications1. <strong>Soil</strong> Applications <strong>of</strong> CopperuuCu is more frequently soil applied than used as a foliar sprayInorganic sources — copper sulfate is the most commonlyused Cu sourceuApplication recommendations:u Organic sources —uuu2. Foliar Copper ApplicationsuBordeaux mixtures — contain copper sulfate <strong>and</strong> wererecognized to stimulate growth <strong>and</strong> yields <strong>of</strong> plants thatwere not related to the control <strong>of</strong> fungal diseasesu Cu foliar sprays —
uu Cu spray materials —u3. Copper Seed TreatmentsuuOccasional responses to seed applications <strong>of</strong> Cu have beenobserved — but these responses are uncommon <strong>and</strong> notreliableAvoid this type <strong>of</strong> treatment4. Residual Copper Fertilization EffectsuuUsually long lasting — up to 8 yearsDepending on rate <strong>and</strong> type <strong>of</strong> soil application5. Copper Toxicity ProblemsuToo many applications <strong>of</strong> Cu may lead to toxicity problemsIn Florida —In Australia —
Remedy —F. <strong>Idaho</strong> Recommendations for Copper1. Critical <strong>Soil</strong> Test Levelu2. <strong>Soil</strong> Test Extractantsu3. Recommendationsu High Organic Matter <strong>Soil</strong>s: >8%uApply 3 to 5 lbs Cu/acre as a soil application; if organicmatter >25% raise the application rate to 5 to 8 lbs Cu/acreWheat:Wheat + High organic matter:
A.Iron Introduction1. Forms <strong>and</strong> Function <strong>of</strong> Irona. Function <strong>of</strong> Iron in <strong>Plant</strong>suuub. <strong>Plant</strong> Available Form <strong>of</strong> Ironuc. Iron Mobility in <strong>Plant</strong>sud. Fe Content in <strong>Plant</strong>sue. Fe Deficiency Symptons in <strong>Plant</strong>suuAppears first in younger leavesInterveinal chlorosisf. Fe Levels in PNW <strong>Soil</strong>suB.Factors Affecting Crop Response to Iron1. <strong>Soil</strong> pHuuFe deficiencies are common in high pH soilsFe deficiencies also occur in very acid soils, where Fe <strong>and</strong> Mnantagonisms exist
2. <strong>Soil</strong> MoistureuExcess irrigation <strong>of</strong> calcareous soils can cause iron chlorosis;it is estimated that 50% <strong>of</strong> the Fe problems observed in Utahsoils could be prevented with better water management3. <strong>Soil</strong> AerationuPoor drainage promotes Fe availabilityu Fe +++ Fe ++4. Presence <strong>of</strong> BicarbonateuHCO 3in irrigation water induces Fe chlorosis. Water qualitydependantu HCO3 induces P solubility which interferes with Fenutrition5. <strong>Soil</strong> ReservesuLow levels <strong>of</strong> Fe are <strong>of</strong>ten found under the followingconditions:uuuu
LESSON 15IronManganeseC.Correction <strong>of</strong> Iron Deficiencies in Field SituationsuuCalcareous soils are most likely to be Fe deficientThere are many Fe sensitive crops. These crops include:uBeans, corn, sorghum, fruit trees, grasses, legumes, rice,nut trees, tomatoes, <strong>and</strong> many vegetablesuuFe deficiencies can be observed in the irrigated arid regions <strong>of</strong>the PNW<strong>Idaho</strong> problems include:uuuuD.Iron Fertilizer SourcesuuBoth inorganic <strong>and</strong> organic Fe fertilizer sources have beenusedFe sources include:u Ferrous sulfate —
u Ferric sulfate —u Iron chelates —u Iron frits —E. Iron Fertilizer Applications1. <strong>Soil</strong> Applications <strong>of</strong> IronuuuGreat variation in successInorganic sources have many problemsOrganic sources are better but costly2. Foliar Iron ApplicationsuAdvantages:1. Elimination <strong>of</strong> complicated soil reactions2.3.4. More rapid response to applicationuDisadvantages:1. Greater chance <strong>of</strong> toxicity2. Don’t correct soil problem3. Repeated applications may be necessary
3. Applications in Irrigation WateruUse same iron sources used in foliar applications4. Residual EffectsuPoor responses to soil applied iron fertilizers has lead to a lack<strong>of</strong> data5. Iron Toxicity ProblemsuuuOnly toxicity potential is with foliar spray applicationsF. <strong>Idaho</strong> Recommendations for Iron1. Critical <strong>Soil</strong> Test Level2. Recommendations
A.Manganese Introduction1. Forms <strong>and</strong> Function <strong>of</strong> Manganesea. Function <strong>of</strong> Mn in <strong>Plant</strong>suub. <strong>Plant</strong> Available Form <strong>of</strong> Mnuc. Mn Mobility in <strong>Plant</strong>sud. Mn <strong>Plant</strong> Contentue. Mn Levels in PNW <strong>Soil</strong>suB.Factors Affecting Crop Response to Manganese1. <strong>Soil</strong> pHuIn acid soils the divalent form <strong>of</strong> Mn (Mn ++ ) is generally foundu At high soil pH values the tetravalent form (MnO 2)predominates
2. <strong>Soil</strong> Moistureu Poor drainage reducing conditions which favorincreased availabilityuFe <strong>and</strong> Mn precipitate <strong>and</strong> clog drainage tiles3. <strong>Soil</strong> AerationuLow aeration increases soil Mn ++ supply for plant roots(toxicity?)4. <strong>Soil</strong> MicroorganismsuBecause Mn exists in several oxidation states <strong>of</strong> dissimilaravailability to plants, the availability <strong>of</strong> micr<strong>of</strong>lora totransform Mn has considerable importanceuOXIDATIONuConversion from plant available to unavailable form;u Mn ++ MnO 2(Mn ++++ )uProcess is biological; occurs under high pH conditions(pH 5.5 - 8.9)Organisms responsible:uuMn oxidizers <strong>of</strong>ten comprise 5-15% <strong>of</strong> total living micr<strong>of</strong>lorapopulationuProblem when a soil over-limed
uREDUCTION:uConversion <strong>of</strong> plant unavailable to available form <strong>of</strong> Mn;u MnO 2Mn ++u MnO 2+ 4H + + 2e- Mn ++ + 2H 2OuuProcess is biological; occurs under acid conditions,waterlogged conditionsOrganisms responsible:uUnder very acid conditions or prolonged waterloggingtoo much Mntoxicityu Lateral flow H 2O <strong>of</strong>f, get Mn deficienciesC.Correction <strong>of</strong> Manganese Deficiencies in FieldSituationsuuuuMn deficiencies most <strong>of</strong>ten occur on well-drained soils <strong>of</strong> highpHGrains <strong>and</strong> large seeded legumes are most <strong>of</strong>ten Mn deficientLime additions can induce a Mn deficiencyProblem areas in PNW:u
uuuD.Manganese SourcesuuBoth organic <strong>and</strong> inorganic sources <strong>of</strong> Mn can be used tocorrect deficienciesCommon Mn fertilizer sources include:u Manganese sulfate —u Manganese oxide —u Manganese-EDTA —u Manganese carbonate —
u Manganese chloride —u Manganese frits —E. Manganese Fertilizer Applications1. <strong>Soil</strong> ApplicationsuuMost common method to correct Mn deficiencySoluble Mn quickly reverts to unavailable forms — so theeffectiveness can be influenced by method <strong>of</strong> applicationuu2. Foliar Manganese ApplicationsuMn deficiencies <strong>of</strong> fruit trees are almost always corrected byfoliar spraysu
F. <strong>Idaho</strong> Recommendations for Manganese1. Critical <strong>Soil</strong> Test Levelu2. Recommendationu
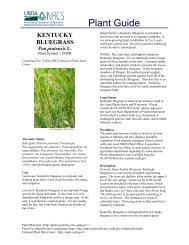
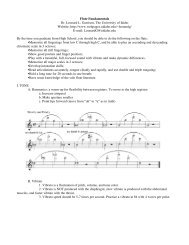
Essential <strong>Plant</strong> MicronutrientsBoron in <strong>Idaho</strong>R. L. Mahler, <strong>Soil</strong> ScientistBoron (B)—like chlorine (Cl), copper (Cu), iron(Fe), manganese (Mn), molybdenum (Mo), nickel (Ni),<strong>and</strong> zinc (Zn)—is a micronutrient necessary for plantgrowth. Micronutrients are so named because plantsrequire them in lesser amounts than nitrogen (N), phosphorus(P), potassium (K), <strong>and</strong> sulfur (S). Nevertheless,too little or too much boron will reduce plant yield thesame as a lack <strong>of</strong> nitrogen.Boron regulates transport <strong>of</strong> sugars through membranes,cell division, cell development, <strong>and</strong> auxin metabolism.Without adequate levels <strong>of</strong> boron, plants maycontinue to grow <strong>and</strong> add new leaves but fail to producefruits or seeds. A continuous supply <strong>of</strong> boron is importantfor adequate plant growth <strong>and</strong> optimum yields.Low soil levels <strong>of</strong> boron have been found to limitplant growth in many parts <strong>of</strong> <strong>Idaho</strong> (Fig. 1). Cropsgrown on northern <strong>Idaho</strong> soils have been shown torespond to boron fertilizer applications since the 1950s.Recent research has indicated that lack <strong>of</strong> boron may bea limiting factor for tree growth in northern Idah<strong>of</strong>orests. In addition, several crops north <strong>of</strong> the SnakeRiver in southern <strong>Idaho</strong> also have been shown responsive.As l<strong>and</strong> continues to be intensively cultivated inother areas <strong>of</strong> southern <strong>Idaho</strong>, responses to boron fertilizerare likely to increase.Factors Affecting Crop Response<strong>Soil</strong> texture, soil organic matter content, <strong>and</strong> soilmoisture (annual precipitation, irrigation) are the threemost important factors affecting boron availability insoils. Coarse textured soils (s<strong>and</strong>s, loamy s<strong>and</strong>s, s<strong>and</strong>yloams) that are low in organic matter are <strong>of</strong>ten low inplant-available boron. Boron deficiencies are especiallypronounced in high rainfall areas (greater than 25 inches)where boron may have been leached from the soilpr<strong>of</strong>ile. Over-irrigation may cause the same results.The availability <strong>of</strong> boron in the soil is also influencedby pH. Maximum boron availability occurs betweensoil pH 5 <strong>and</strong> 7. Most soils in northern <strong>Idaho</strong> fall into thisrange, however, many soils <strong>of</strong> southern <strong>Idaho</strong> have pHvalues above the optimum range for boron availability.<strong>Soil</strong>s in northern <strong>Idaho</strong> with optimum pH values are<strong>of</strong>ten low in available boron because <strong>of</strong> high crop usage<strong>of</strong> this element over the past several decades.Boron■ Often Deficient■ Occasionally Deficient■ Seldom DeficientFig. 1. Areas in <strong>Idaho</strong> with soils deficient in boron.Cooperative Extension System ❖ Agricultural Experiment Station CIS 1085
<strong>Soil</strong> moisture <strong>and</strong> organic matter contentare also factors that affect crop response toavailable soil boron. Organic matter is themajor source <strong>of</strong> boron in most soils. Consequently,soils that are highly eroded ornaturally low in organic matter tend to below in boron. Boron deficiencies are alsomore prevalent in dry conditions (causedby lack <strong>of</strong> organic matter decomposition)<strong>and</strong> in soils with less than 2 percent organicmatter.Boron Deficiency SymptomsBoron deficiencies first appear at thegrowing point <strong>of</strong> plants. Growing tips maydie, <strong>and</strong> plant growth fails when no boron ispresent. When fruits on trees or vegetablesare growing rapidly or when tuberous roots<strong>of</strong> fleshy plants are exp<strong>and</strong>ing rapidly, theplants develop a larger amount <strong>of</strong> meristemtissue to provide for this growth. A lack <strong>of</strong>adequate boron to the meristem at this timemay result in s<strong>of</strong>t or necrotic (dead) spots inthe fruit or tuber. In addition to a reduction<strong>of</strong> top growth, a boron deficiency also retardsroot growth (Fig. 2).• Alfalfa—Boron deficiency in alfalfain its mildest form goes unrecognized becauseit occurs as a reduction in flowering<strong>and</strong> seed set. Such mild deficiency reflectsa decrease in seed yield but is seldom detectablein hay yields from any single cutting.Reduced flowering may delay cutting<strong>and</strong> could result in poorer quality hay.Boron deficiencies in alfalfa are commonlymistaken for drought damage. Withoutsufficient boron, the youngest leaves <strong>of</strong>the plant become chlorotic. The upper portion<strong>of</strong> the plant becomes yellow or red incolor (<strong>of</strong>ten called “alfalfa yellows” whichshould not be mistaken with the alfalfavirus disease) while the lower, older leavesremain green <strong>and</strong> healthy. As the deficiencyprogresses, the internodes <strong>of</strong> theyoung top growth become increasinglyshorter until the plant assumes a rosetteappearance (circular cluster <strong>of</strong> leaves <strong>and</strong>other plant parts, see Figs. 3 <strong>and</strong> 4). At thisstage, the growing tip may become dormantor die.• Sugarbeets—The first symptoms occurin the crown’s young, center leaves.The young leaves will appear smaller <strong>and</strong>chlorotic, <strong>and</strong> the petioles tend to be brittle.Eventually, the petioles will become se-Fig. 2. Lack <strong>of</strong> boron stunts plant vegetative growth <strong>and</strong> greatly reducesroot growth (right). Decreased root growth reduces the plants’ability to obtain water <strong>and</strong> nutrients from the soil.Fig. 3. Boron deficiency in alfalfa evidenced by yellowed <strong>and</strong> stuntedleaves on plants at right.Fig. 4. Differing degrees <strong>of</strong> boron deficiency in alfalfa plants.
Fig. 5. Severe boron deficiency in young sugarbeet plants. Note thatthe deficiency is so severe that the leaves are difficult to identify.Fig. 6. Boron deficiency in young clover leaves. The leaves on the rightexhibit typical boron deficiency symptoms. The leaves are smaller,slightly deformed, <strong>and</strong> exhibit a bronzing on the leaf margins.Fig. 7. Boron deficiency results in smaller, deformed, <strong>and</strong> darker potatotubers (left). During vegetative growth boron-deficient plantsproduced 20 percent less biomass—but the real difference becomesapparent at harvest.Fig. 8. Boron deficiencyin grapes (right) isknown as “hen <strong>and</strong>chick” symptom.verely cracked, <strong>and</strong> the young leaves willdie. The growing point <strong>of</strong> the crown may die<strong>and</strong> rot. Under a severe boron deficiencyplant leaves become severely deformed(Fig. 5).• Tree Fruits—Variable boron deficiencysymptoms occur on tree fruits. Inapples, the fruit becomes corky, <strong>and</strong> the skinmay die; wounds or greenish round spotsoccur on the fruit. Other types <strong>of</strong> fruit treesmay show symptoms such as cracked fruit,blossom blast (failure <strong>of</strong> flowers to open, orfailure <strong>of</strong> fruit or seeds to mature), chloroticfruit skins, <strong>and</strong> surface pitting <strong>of</strong> the fruit.• Peas, Lentils, <strong>and</strong> Chickpeas—A minorboron deficiency is usually visually unrecognizable;however, seed set will <strong>of</strong>ten bereduced by up to 25 percent. As the deficiencybecomes more severe, deformationwill occur at the growing tip <strong>of</strong> the plant.• Clovers—Boron deficiency in clover<strong>of</strong>ten results in poor st<strong>and</strong>s, reduced growth,<strong>and</strong> poor seed set. The upper leaves arefrequently smaller in size <strong>and</strong> may exhibitbronzing around the margins (Fig. 6).• Rapeseed <strong>and</strong> Canola—Reduced seedset is a characteristic boron deficiency inboth rapeseed <strong>and</strong> canola. <strong>Plant</strong>s appearstunted at the growing tip, <strong>and</strong> the new leavesare <strong>of</strong>ten deformed <strong>and</strong> brittle.• Potatoes—Potato plants deficient inboron usually have reduced biomass. Withsevere deficiencies the leaves near the growingtip appear stunted. Lack <strong>of</strong> boron reducesboth tuber quality <strong>and</strong> quantity (Fig. 7).• Grapes—Characteristic boron deficiencysymptoms in grapes include chlorosis<strong>of</strong> the terminal leaves, dieback <strong>of</strong> the shoottips, <strong>and</strong> poor fruit set. Under severe deficiencysymptoms, clusters <strong>of</strong> fruit <strong>of</strong>ten dryup or burn <strong>of</strong>f, leaving only cluster stemswith occasional berries. This condition isknown as the “hen <strong>and</strong> chick” symptom(Fig. 8).<strong>Soil</strong> Analysis <strong>and</strong> <strong>Plant</strong> TissueSampling<strong>Soil</strong>s should be tested for available boronthree years after a soil application <strong>of</strong> boronwas made <strong>and</strong> when the fourth year crop willbe alfalfa, peas, lentils, chickpeas, canola,rapeseed, or a root crop. If an annual rowcrop was sprayed with boron (foliar application)the previous year, a boron soil test is
needed for the next crop because foliar applications areintercepted by the plant canopy <strong>and</strong> boron does notreach the soil.Deficiencies can be most easily avoided by frequently(every third year) having a soil analyzed foravailable boron. For testing, a soil sample should becollected from the surface 12 inches <strong>of</strong> a soil pr<strong>of</strong>ile. Asoil test level <strong>of</strong> 0.5 ppm boron is sufficient for highboron dem<strong>and</strong>ing crops (alfalfa, grain legumes, canola,rapeseed, root crops) while a soil test level <strong>of</strong> 0.3 ppmboron is sufficient for low boron requiring crops.The boron status <strong>of</strong> plants can be monitored throughoutthe growing season through the use <strong>of</strong> plant tissuetesting. Monitoring boron levels in high-value cashcrops can help to prevent severe boron nutrient deficiencysymptoms from developing. Table 1 lists theplant parts <strong>and</strong> stages <strong>of</strong> plant growth to sample forboron tissue analysis for major <strong>Idaho</strong> crops. Take careto sample the correct plant part at the correct stage <strong>of</strong>plant growth <strong>and</strong> to sample in a manner that is representative<strong>of</strong> the field.Detection <strong>of</strong> Boron ProblemsIf you suspect a possible boron deficiency, have thesoil tested for available boron. When soils test less than0.5 ppm boron, addition <strong>of</strong> a fertilizer containing boronis recommended. <strong>Plant</strong>s belonging to the grass (cereals,corn) family generally require only about 25 percent asmuch boron for normal growth as do dicotyledons(beans, potatoes, tomatoes, sugarbeets, etc.). Borondeficiencies are usually most pronounced on alfalfa <strong>and</strong>on certain root <strong>and</strong> cruciferous crops (sugarbeets, cabbage,cauliflower, rutabagas, <strong>and</strong> turnips). More boronfertilizer is used on alfalfa than any other crop in <strong>Idaho</strong>.Crop Response to BoronApplications in <strong>Idaho</strong>Field trials conducted on peas, lentils, chickpeas,alfalfa, clover, birdsfoot trefoil, rapeseed, <strong>and</strong> canola innorthern <strong>Idaho</strong> between 1970 <strong>and</strong> 1995 showed thesecrops respond to applications <strong>of</strong> boron fertilizers whensoils were initially boron deficient. Average yield increasesattributable to fertilizer boron applications <strong>of</strong>one pound per acre (soils initially contained less than0.5 ppm B) are shown in Table 2. Cereal crops have notbeen responsive to boron applications.Boron FertilizerSeveral fertilizer sources <strong>of</strong> boron are available foruse in <strong>Idaho</strong> (Table 3). Borax, borated gypsum, Solubor,<strong>and</strong> boric acid are the most commonly used boronfertilizers in <strong>Idaho</strong>. All four sources <strong>of</strong> boron are gener-Table 1. Procedures for sampling <strong>Idaho</strong> crops for boron tissue levels.No. <strong>of</strong> plantsCrop Stage <strong>of</strong> growth <strong>Plant</strong> part to sample to sample CNR*Field cropsAlfalfa Before or at 1/10 bloom stage Upper 3 to 4 inches 40 to 50 20 to 30 ppmClovers Before bloom Mature leaf blades taken about 40 to 50 20 to 30 ppm1/3 <strong>of</strong> the way down from top<strong>of</strong> the plantPeas, lentils, Early to mid-season Mature leaf blades taken about 30 to 40 20 to 30 ppmchickpeas1/3 <strong>of</strong> the way down from top<strong>of</strong> the plantSugarbeets Early to mid-season 4 th petiole 30 to 40 20 to 40 ppmPotatoes Early to mid-season 4 th petiole 30 to 40 20 to 30 ppmFruit cropsApples, apricots Mid-season Leaves near base <strong>of</strong> current 50 to 100 20 to 25 ppmpeaches, pears,year’s growth or from spurscherriesStrawberries Mid-season Youngest fully exp<strong>and</strong>ed mature 50 to 75 20 to 30 ppmleavesVegetable cropsRoot crops Before root or bulb Center mature leaves 20 to 30 30 to 60 ppm(carrots, onions, enlargementbeets, etc.)Sweet corn 1. Before tasseling The entire fully mature leaf below 20 to 30the whorl2. At tasseling The entire leaf at the ear node 20 to 30*CNR—Critical Nutrient Ranges for boron in plant tissue.
ally applied to the soil. Borax <strong>and</strong> borated gypsum areused as solid forms <strong>of</strong> boron fertilizers, while boric acid<strong>and</strong> Solubor are versatile boron sources that can be usedeither for soil or foliar application.Methods <strong>and</strong> Application RatesThe two principal methods <strong>of</strong> correcting boron deficienciesin the field are by (1) soil application <strong>and</strong> (2)foliar application to the plant. Boron deficiencies aremost commonly corrected by applying boron fertilizerto the soil. While foliar sprays <strong>of</strong> boron compounds are<strong>of</strong>ten beneficial, soil applications remain effective muchlonger. Most boron compounds used in foliar sprays canbe mixed with other liquid fertilizers for applications tothe soil. Seed applications <strong>of</strong> boron should not be usedas they can be toxic.• <strong>Soil</strong> Treatments—A fertilizer application rate <strong>of</strong>1 to 2 pounds <strong>of</strong> boron per acre is needed for soiltreatments on certain legumes <strong>and</strong> root crops. Lowerrates (0 to 1 lb per acre) are needed for other crops.Applying boron to the soil is the most efficient way <strong>of</strong>meeting the nutritional needs <strong>of</strong> most <strong>Idaho</strong> crops.Significant responses to soil-applied boron are <strong>of</strong>tenreported for alfalfa, peas, lentils, chickpeas, rapeseed,<strong>and</strong> canola in northern <strong>Idaho</strong>.Table 2. Average yield increases <strong>of</strong> crops grown in northern<strong>Idaho</strong> when fertilized with 1 pound <strong>of</strong> boronper acre. (Note: <strong>Soil</strong>s were initially boron deficientbefore fertilizer applications.)Crop Average yield increase, %LegumesAlfalfa 13Birdsfoot trefoil 9Chickpeas 15Clovers 9Lentils 23Peas 17Non-legumesCanola 15Rapeseed 12If using a solid fertilizer material such as boratedgypsum, borate 48, or borate 68, boron can be surfacebroadcast on the soil <strong>and</strong> plowed or disked in beforeseedbed preparation. Often boron materials such asboric acid or Solubor are first liquified then sprayed onthe soil surface. Fertilizer boron should never be b<strong>and</strong>edbecause at high concentrations it can be toxic to seeds,seedlings, <strong>and</strong> plant roots.• Foliar Treatments—Foliar boron applicationsare commonly used on perennial tree fruits. Foliar boronis compatible <strong>and</strong> can be mixed with many pesticidesprays. Foliar boron application rates <strong>of</strong> 0.1 to 0.4 poundper acre are sufficient for most tree fruits. Foliar boroncan also be used to prevent boron deficiencies in rapidlygrowing annual crops.Foliar applications must be made several times duringthe growing season because boron is not mobile inthe plant. As new growth appears, repeated spraying arerequired to get boron into the new growth. Five to sevenfoliar applications <strong>of</strong> boron over the growing seasonmay be needed to get the same plant yield effects as 1pound <strong>of</strong> boron broadcast <strong>and</strong> incorporated into the soilbefore planting.Because <strong>of</strong> the high cost <strong>of</strong> repeated applications,foliar spraying <strong>of</strong> row crops should be used only whenboron is needed to prevent yield reductions. Annual rowcrops generally require about one pound <strong>of</strong> boron peracre. The one pound can be divided by the number <strong>of</strong>times boron will be sprayed over the season to give thecorrect rate for each application.• Reduced Tillage Situations—In reduced tillagesituations most fertilizers are <strong>of</strong>ten b<strong>and</strong>ed. Boron cannotbe b<strong>and</strong>ed! Potential B application strategies in suchsituations include: (1) apply B fertilizer as a surfacebroadcast in the solid or liquid forms, or (2) apply Bfertilizer as a tank-mix application together with apesticide.• Residual Effects—Boron persistence in soils islargely determined by the soil type <strong>and</strong> the form <strong>of</strong>boron applied to the soil. Boron will rapidly leach fromTable 3. Boron fertilizer materials available for use on <strong>Idaho</strong> crops.Rates per acreBoron material Chemical formula % boron 0.5 lb B 1 lb B 2 lb B(B)(application <strong>of</strong> material, lb)Borated gypsum CaSO 4, 2H 2O + Na 2B 4O 71 50 100 200Borax Na 2B 4O 710H 2O 11.4 4.4 8.8 17.6Boric acid H 3BO 317 2.9 5.8 11.8Boron frits variable 10 to 17 ----------------------- depends on % B -----------------------Fertilizer Borate 48 Na 2B 4O 75H 2O 14.3 3.5 7 14Fertilizer Borate 68 Na 2B 4O 720.2 2.5 5 9.9Solubor Na 2B 4O 75H 2O + 20.5 2.4 4.8 9.8Na 2B 10O 1610H 2O
s<strong>and</strong>y soils that are overirrigated or that have highrainfall but will persist for several years in soils high insilt <strong>and</strong> clay. <strong>Soil</strong>-applied boron rates <strong>of</strong> 1 to 2 poundsper acre will generally result in sufficient soil levels <strong>of</strong>boron for at least three years for all but very s<strong>and</strong>y soils.Foliar applications leave little soil residual boron sincemost <strong>of</strong> the applied boron is taken up by the plant <strong>and</strong> notthe soil.Boron ToxicityBoron toxicity can result when plants have taken uptoo much boron; excessive levels <strong>of</strong> boron are toxic toplant growth. The best way to avoid boron toxicityproblems is through proper management <strong>of</strong> fertilizer<strong>and</strong> a crop rotation program. Boron should be applied tothe soil at low rates only after a demonstrated need hasbeen established through plant tissue <strong>and</strong>/or soil testing.A very narrow range exists between toxicity <strong>and</strong>deficiency. <strong>Plant</strong>s differ in their sensitivity to excessboron. Beans <strong>and</strong> peas are extremely sensitive, whilealfalfa is relatively tolerant to high boron levels. Amounts<strong>of</strong> boron commonly applied to alfalfa are toxic to beans.When required, boron should be applied uniformly to afield (broadcast, not b<strong>and</strong>ed) at rates not to exceed 4pounds <strong>of</strong> boron per acre.Issued in furtherance <strong>of</strong> cooperative extension work in agriculture <strong>and</strong> home economics, Acts <strong>of</strong> May 8 <strong>and</strong> June 30, 1914,in cooperation with the U.S. Department <strong>of</strong> Agriculture, LeRoy D. Luft, Director <strong>of</strong> Cooperative Extension System,<strong>University</strong> <strong>of</strong> <strong>Idaho</strong>, Moscow, <strong>Idaho</strong> 83844. The <strong>University</strong> <strong>of</strong> <strong>Idaho</strong> provides equal opportunity in education <strong>and</strong> employment on the basis<strong>of</strong> race, color, religion, national origin, gender, age, disability, or status as a Vietnam-era veteran, as required by state <strong>and</strong> federal laws.5,000 12-81; 2,000 3-00 (formerly CIS 608) $3.00
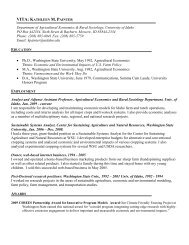
Essential <strong>Plant</strong> <strong>and</strong> Animal MicronutrientsMolybdenum in <strong>Idaho</strong>R. L. Mahler, <strong>Soil</strong> Scientist<strong>Plant</strong>s require trace amounts <strong>of</strong> molybdenum (Mo)for normal growth. While animals also require traceamounts, they are more likely than plants to be adverselyaffected by excessive Mo. Management <strong>of</strong> Moin crop rotations should take into account both animal<strong>and</strong> plant needs.Molybdenum <strong>and</strong> <strong>Plant</strong>sMo—like boron (B), chlorine (Cl), copper (Cu), iron(Fe), manganese (Mn), nickel (Ni), <strong>and</strong> zinc (Zn)—is anecessary micronutrient for plant growth. Molybdenumis called a micronutrient because plants require it insmaller amounts than the macronutrients—nitrogen (N),phosphorus (P), potassium (K), sulfur (S), calcium (Ca),<strong>and</strong> magnesium (Mg). <strong>Plant</strong>s take up Mo in the MoO 42-ionic form.Mo has several functions in plant growth. <strong>Plant</strong>srequire a constant <strong>and</strong> continuous supply <strong>of</strong> Mo fornormal assimilation <strong>of</strong> N. Mo is also a component <strong>of</strong> theenzyme nitrogenase, which is required in N fixation <strong>and</strong>plays a role in P utilization. Because <strong>of</strong> Mo’s role in Nfixation, legumes require more <strong>of</strong> it than cereals <strong>and</strong> arethus more sensitive to low Mo levels in soil (Table 1).Molybdenum Availability in <strong>Soil</strong>Low soil Mo levels in some parts <strong>of</strong> northern <strong>Idaho</strong>have been found to limit plant growth in alfalfa, clover,birdsfoot trefoil, peas, <strong>and</strong> lentils (Fig. 1). In contrast,Mo deficiencies are rare in crops growing on the SnakeRiver Plain in southern <strong>Idaho</strong>.Some plants growing in mountain valleys <strong>of</strong> northcentral<strong>Idaho</strong> have abnormally high Mo levels. M<strong>of</strong>ertilizers should not be applied to soils in these mountainvalleys unless a need has been demonstrated.Table 1. The relative Mo requirements <strong>of</strong> <strong>Idaho</strong> crops.LowHighBarley Onions Alfalfa LentilsBluegrass Potatoes Beans PeasCorn Rapeseed Birdsfoot trefoil Red cloversFruit trees Sugarbeets Chickpeas WhiteHops Vegetable cloversMint seed cropsOats WheatFig. 1. <strong>Idaho</strong> soils that may be deficient or extremelyhigh in plant-available molybdenum.Cooperative Extension System ❖ Agricultural Experiment Station CIS 1087
Fig. 2. Molybdenum deficiency in a crop, such as thissoybean field, turns healthy, dark green leavesyellowish-green. This symptom is <strong>of</strong>ten misdiagnosedas a nitrogen or sulfur nutritional problem.Mo availability in the soil increases with pH. Modeficiencies are uncommon in high pH soils (pH 7 orabove). That is why Mo deficiencies are rare in southern<strong>Idaho</strong>. Most Mo deficiencies occur in acidic northern<strong>Idaho</strong> soils with pH values less than 6.0. In addition,acid, s<strong>and</strong>y, leached soils or soils high in organic matter(greater than 25 percent organic matter) may be deficientin plant-available Mo.Most Mo deficiencies in <strong>Idaho</strong> occur in fields withlow pH values <strong>and</strong> a long-term history <strong>of</strong> legume production.<strong>Soil</strong>s high in iron may have plants that exhibitMo deficiencies.Crop Response<strong>Soil</strong>s normally contain 0.5 ppm <strong>of</strong> Mo. However,plants usually require only 0.2 to 5 ppm <strong>of</strong> Mo in theirtissue.Mo may be harmful when its available form, MoO 42,is in the soil in excessive quantities. For example,although Mo may be beneficial to plant growth whenadded to the soil as a seed treatment at rates as low as0.03 pound per acre, an application <strong>of</strong> 3 to 4 pounds peracre would be toxic to many plants or to the animals thatconsume them.Molybdenum Deficiency SymptomsWhen <strong>Idaho</strong> crops show Mo-deficiency symptoms,economic loss probably has already occurred. In thefield, Mo-deficiency symptoms are difficult to distinguishfrom N <strong>and</strong> S nutritional problems <strong>and</strong> <strong>of</strong>ten aremisdiagnosed. Mildly Mo-deficient plant leaves appearyellow, similar to their appearance when they are deficientin N or S (Fig. 2). Most growers assume yellowpeas, lentils, clover, <strong>and</strong> alfalfa have N or S problems,however, the problem may be Mo deficiency. Mo deficiencysymptoms are similar to N symptoms in legumesbecause Mo is required in the N 2fixation process—thuswhen Mo is deficient plants cannot get the N needed forgrowth. In non-legumes, without Mo plants cannotFig. 3. Molybdenum deficiency in white clover. Note thehealthy, green leaves on the left, compared to theyellowish-green Mo deficient plants on the right.Fig. 4. Molybdenum deficiency in beets. Note the stunted,yellowish-green leaves in the Mo deficient pot.utilize the N taken up by roots—thus resulting in Ndeficiency symptoms.Initially Mo deficiency is characterized by a lightgreen or yellow-green color (Figs. 3 <strong>and</strong> 4). Underconditions <strong>of</strong> severe Mo deficiency young leaves wilt<strong>and</strong> necrotic (dead) tissue appears along their margins(Fig. 5). When a Mo deficiency is suspected, the planttissue should be sampled <strong>and</strong> evaluated.Molybdenum FertilizerSeveral Mo fertilizer materials are commerciallyavailable (Table 2). Sodium molybdate (Na 2MoO 4•2H 2O) <strong>and</strong> ammonium molybdate [(NH 4) 6Mo 7O 24•4H 2O] are the Mo fertilizer materials most commonlyused in <strong>Idaho</strong>. Molybdenum trioxide (MoO 3) is muchless soluble (which <strong>of</strong>ten means less available to theplant) than sodium molybdate or ammonium molybdate.The molybdenum trioxide form is not widely usedin <strong>Idaho</strong>. Molybdenum sulfide (MoS 2) is a poor source<strong>of</strong> plant-available Mo <strong>and</strong> should be avoided in <strong>Idaho</strong>.In the frits form, Mo is fused with glass. The glass isthen shattered <strong>and</strong> applied to soils. As the glass slowlydissolves in the soil, Mo becomes available. Molybdenumfrits are actually slow-release fertilizers. The amount<strong>of</strong> Mo can be varied by controlling the amount <strong>of</strong> M<strong>of</strong>used with glass. Molybdenum frits is an uncommonfertilizer in the Pacific Northwest <strong>and</strong> should only beapplied to acid soils (pH values less than 6.5).
Fig. 5. Molybdenum deficiency in peas grown in northern<strong>Idaho</strong>. The Mo deficient pea plants on the leftare stunted <strong>and</strong> exhibit severe yellowing <strong>of</strong> theplant tissue when compared to healthy plants onthe right.Application Methods <strong>and</strong> RatesThree principal methods <strong>of</strong> applying Mo fertilizersare (1) soil application, (2) foliar application, <strong>and</strong> (3)application directly to the seed at planting time. Mo isapplied most commonly as a seed treatment. Whilefoliar applications <strong>of</strong> Mo are <strong>of</strong>ten beneficial, seed <strong>and</strong>soil applications remain effective much longer. Seedapplication is the most effective Mo application methodfollowed, in order, by soil application <strong>and</strong> foliar application.Optimum application rates <strong>of</strong> Mo vary. Actual applicationrates depend on the pH <strong>of</strong> the soil, the crop to begrown, <strong>and</strong> the application method. Typical applicationrates range from 0.03 pound (seed <strong>and</strong> foliar applications)to 1.0 pound (soil applications) <strong>of</strong> Mo per acre.<strong>Soil</strong> Applications—Differences in soils, the crop tobe grown, Mo fertilizer sources, <strong>and</strong> incorporation techniqueslead to differing recommended rates <strong>of</strong> applica-tion. Recommended rates in <strong>Idaho</strong> range from 0.5 to 1.0pound <strong>of</strong> actual Mo per acre. The major problem withapplying Mo directly to the soil is that it is difficult toevenly distribute such small amounts. Because <strong>of</strong> this,soil application <strong>of</strong> Mo is not recommended in <strong>Idaho</strong>. Ifa soil application is desired, the fertilizer Mo should besolubized in water <strong>and</strong> sprayed directly on the soil. Thiswill allow for a uniform Mo application.Foliar Applications—Although correcting Mo deficienciesin growing plants with foliar sprays is possible,this method is rarely used. Common foliar sprayrates range from 0.03 to 0.14 pound <strong>of</strong> Mo per acre.Spraying such a small amount <strong>of</strong> material is expensive<strong>and</strong> difficult. Also, foliar Mo applications correct onlythe existing plant deficiency, may not last throughmaturity, <strong>and</strong> do not add Mo to the soil for use bysubsequent crops because the fertilizer material is interceptedby the plant tissues <strong>and</strong> not the soil.Seed Treatments—Most <strong>of</strong> the time the best way toapply Mo is as a seed treatment. Seed application hasdistinct advantages over both soil <strong>and</strong> foliar treatments.Seed treatment results in an even Mo application. Seedtreatment also requires lower Mo rates than are used forsoil application—0.03 to 0.06 pound per acre. Researchindicates that 1/8 ounce per acre <strong>of</strong> Mo applied as a seedtreatment will increase pea yields the same amount as 1pound per acre <strong>of</strong> Mo applied directly to the soil.Avoid treating seeds with more than 1 ounce <strong>of</strong> Moper acre. Higher Mo rates can lower seed germination<strong>and</strong> inhibit the growth <strong>of</strong> the N-fixing bacteria neededfor nodulation on legumes. Rhizobium inocula containingMo is commercially available. Excessive rates alsoallow plants to take up excessive amounts <strong>of</strong> Mo. Molevels are rarely toxic to plants, however, they can betoxic to animals that consume them.Residual EffectsIn neutral to alkaline soils (pH 7 <strong>and</strong> above), Mo soilapplications at rates <strong>of</strong> 0.5 to 1 pound per acre shouldremain effective for several crop years. Seed treatments<strong>of</strong> Mo should supply Mo to plants for 3 or 4 years. <strong>Soil</strong>sthat are slightly acid (pH 5.7 to 7.0) may require Moapplications every 4 or 5 years. <strong>Soil</strong>s that are regularlyTable 2. Application rates <strong>of</strong> common Mo fertilizer materials available for use on <strong>Idaho</strong> crops.Mo rate (lb/acre)Fertilizer material Chemical formula % Mo 1/8 1/4 1/2 1------------- Amount <strong>of</strong> material to apply (lb/acre) -----------Ammonium molybdate (NH 4) 6Mo 7O 24 • 4H 2O 54 0.23 0.45 0.93 1.85Molybdenum frits 1 silicates 2 to 3Molybdenum sulfide MoS 260 0.21 0.42 0.83 1.67Molybdenum trioxide MoO 366 0.19 0.38 0.76 1.52Sodium molybdate Na 2MoO 4 • 2H 2O 39 0.32 0.64 1.28 2.561Application amounts <strong>of</strong> Mo frits depend on the percentage <strong>of</strong> Mo.
cropped with a legume (peas, lentils, alfalfa, clover, <strong>and</strong>birdsfoot trefoil) <strong>and</strong> have pH values less than 5.6 mayrequire Mo applications every 2 or 3 years.<strong>Soil</strong> analysis <strong>and</strong> <strong>Plant</strong> Tissue TestingBecause plant-available Mo is present in soil in verysmall amounts, soil Mo analysis is technically imprecise<strong>and</strong>, therefore, not commercially available. Consequently,a soil test cannot be used to assess the need forMo. Instead, use plant tissue analysis to determine Molevels. The need for Mo analysis in plant tissue ariseswhen either (1) you suspect toxic Mo levels in plantmaterial that animals will consume or (2) you observe asuspected Mo deficiency symptom. Little work hasbeen done to establish optimum Mo concentration valuesin plant tissue, however, plant Mo concentrationsbetween 0.1 <strong>and</strong> 1.2 ppm are known to be adequate forplant nutrition <strong>and</strong> safe for animal consumption.When Should I Apply Mo?Southern <strong>Idaho</strong>—Due to high soil pH values (pH 7or above), Mo levels should be adequate throughoutsouthern <strong>Idaho</strong>. If a Mo deficiency is suspected (basedon visual symptoms), have a plant tissue sample fromthe field tested for Mo. If the plant tissue contains lessthan 0.1 ppm consider a foliar application <strong>of</strong> Mo duringthe present cropping year, or a soil or seed Mo applicationto next year’s crop.Northern <strong>Idaho</strong>—Because a reliable soil test for Mois not available, Mo should be managed on the basis <strong>of</strong>crop rotation history <strong>and</strong> soil pH. Molybdenum is morelikely to be deficient if a legume (peas, lentils, chickpeas,alfalfa, clovers, birdsfoot trefoil), canola, or rapeseed isin the crop rotation. <strong>Soil</strong>s with pH values <strong>of</strong> 5.6 or lessare also more likely to be Mo deficient. Based on thesefacts Mo fertilization recommendations are as follows:• If soil pH is less than 5.6 <strong>and</strong> legume or oilseed inrotation:✓ seed treat legume/oilseed once every 8 years• If soil pH is greater than or equal to 5.6 <strong>and</strong> legume/oilseed in rotation less than 50 percent <strong>of</strong> the time:✓ seed treat legume/oilseed once every 6 years• If soil pH is greater than or equal to 5.6 <strong>and</strong> legume/oilseed in rotation is less than or equal to 50 percent<strong>of</strong> time:✓ seed treat legume/oilseed once every 4 years.Molybdenum <strong>and</strong> AnimalsMo is an essential trace mineral for animals. Mo levelin most forages ranges from 0.1 to 3 ppm on a dry matterbasis. Beef cattle only require 0.01 ppm Mo in their diet,so a Mo deficiency is usually not <strong>of</strong> concern. The commonsymptom <strong>of</strong> animal Mo deficiency is a blockedurinary tract.Molybdenum Toxicity in AnimalsMany animals cannot tolerate high Mo levels in theirdiets. Mo can impair utilization <strong>of</strong> copper (Cu), anotheressential micronutrient, especially if the diet is alsorelatively high in suflur (S). A Cu-S antagonism lowersthe biological availability <strong>of</strong> Cu by forming a Cu-Mo orCu-Mo-S complex in the digestive tract. Forage Molevels <strong>of</strong> 3 ppm <strong>and</strong> above will significantly reduce Cuavailability from the diet.Cu is <strong>of</strong>ten deficient in animal diets, <strong>and</strong> the deficiencygenerally occurs where plant-available Cu islow, <strong>of</strong>ten in high organic matter <strong>and</strong> poorly drainedsoils (muck soils). If a muck soil has an abundant supply<strong>of</strong> Mo, plant Mo uptake increases while Cu uptake isreduced.Severe Mo toxicity (molybdenosis) occurs in cattlewhere natural forages contain 20 to 100 ppm Mo. Thistoxicity causes a condition called “teart” in which cattledevelop scours. Scours can be mild to debilitating,resulting in permanent injury to the digestive tract <strong>and</strong>sometimes death. This condition can be corrected byadding a copper-sulfate supplement to the cattle diet.For Further ReadingYou may order other publications about micronutrientsin soils from the <strong>University</strong> <strong>of</strong> <strong>Idaho</strong> CooperativeExtension System <strong>of</strong>fice in your county or Ag Publications,P.O. Box 442240, <strong>University</strong> <strong>of</strong> <strong>Idaho</strong>, Moscow,<strong>Idaho</strong> 83844-2240, or phone 208/885-7982 or email:cking@uidaho.eduBUL 704, <strong>Soil</strong> Sampling, $2.00CIS 617, Essential <strong>Plant</strong> <strong>and</strong> Animal Micronutrients:Copper in <strong>Idaho</strong>, 50¢CIS 757, Nitrogen <strong>and</strong> Phosphorus BMP: FertilizerPlacement, 50¢CIS 882, Long-Term Effects <strong>of</strong> Lime on <strong>Soil</strong> pH inSome Acidic <strong>Soil</strong>s in Northern <strong>Idaho</strong>, 35¢CIS 1085, Essential <strong>Plant</strong> Micronutrients: Boron in<strong>Idaho</strong>, $3.00CIS 1088 (formerly CIS 617), Essential <strong>Plant</strong>Micronutrients: Zinc in <strong>Idaho</strong>Issued in furtherance <strong>of</strong> cooperative extension work in agriculture <strong>and</strong> home economics, Acts <strong>of</strong> May 8 <strong>and</strong> June 30, 1914,in cooperation with the U.S. Department <strong>of</strong> Agriculture, LeRoy D. Luft, Director <strong>of</strong> Cooperative Extension System,<strong>University</strong> <strong>of</strong> <strong>Idaho</strong>, Moscow, <strong>Idaho</strong> 83844. The <strong>University</strong> <strong>of</strong> <strong>Idaho</strong> provides equal opportunity in education <strong>and</strong> employment on the basis<strong>of</strong> race, color, religion, national origin, gender, age, disability, or status as a Vietnam-era veteran, as required by state <strong>and</strong> federal laws.1,000 1-93; 2,000 5-00 (formerly CIS 589) $1.00