Overview of the Plant Wellness Way - Lifetime Reliability
Overview of the Plant Wellness Way - Lifetime Reliability
Overview of the Plant Wellness Way - Lifetime Reliability
- No tags were found...

You also want an ePaper? Increase the reach of your titles
YUMPU automatically turns print PDFs into web optimized ePapers that Google loves.
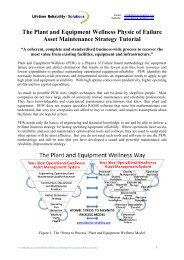
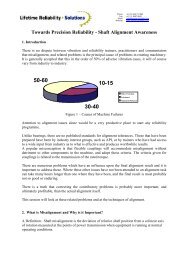
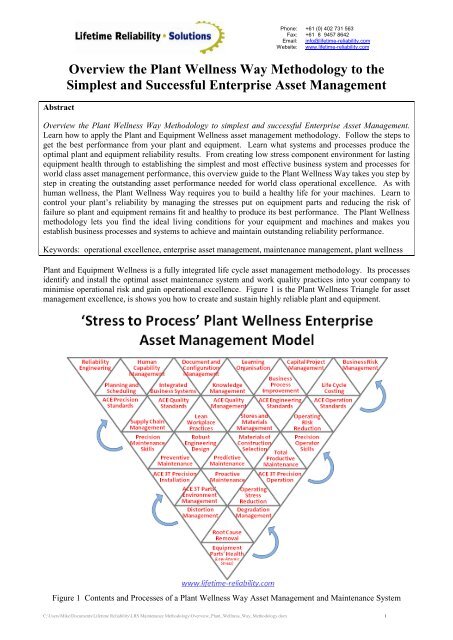
Phone:Fax:Email:Website:+61 (0) 402 731 563+61 (8) 9457 8642info@lifetime-reliability.comwww.lifetime-reliability.comAbstract<strong>Overview</strong> <strong>the</strong> <strong>Plant</strong> <strong>Wellness</strong> <strong>Way</strong> Methodology to <strong>the</strong>Simplest and Successful Enterprise Asset Management<strong>Overview</strong> <strong>the</strong> <strong>Plant</strong> <strong>Wellness</strong> <strong>Way</strong> Methodology to simplest and successful Enterprise Asset Management.Learn how to apply <strong>the</strong> <strong>Plant</strong> and Equipment <strong>Wellness</strong> asset management methodology. Follow <strong>the</strong> steps toget <strong>the</strong> best performance from your plant and equipment. Learn what systems and processes produce <strong>the</strong>optimal plant and equipment reliability results. From creating low stress component environment for lastingequipment health through to establishing <strong>the</strong> simplest and most effective business system and processes forworld class asset management performance, this overview guide to <strong>the</strong> <strong>Plant</strong> <strong>Wellness</strong> <strong>Way</strong> takes you step bystep in creating <strong>the</strong> outstanding asset performance needed for world class operational excellence. As withhuman wellness, <strong>the</strong> <strong>Plant</strong> <strong>Wellness</strong> <strong>Way</strong> requires you to build a healthy life for your machines. Learn tocontrol your plant’s reliability by managing <strong>the</strong> stresses put on equipment parts and reducing <strong>the</strong> risk <strong>of</strong>failure so plant and equipment remains fit and healthy to produce its best performance. The <strong>Plant</strong> <strong>Wellness</strong>methodology lets you find <strong>the</strong> ideal living conditions for your equipment and machines and makes youestablish business processes and systems to achieve and maintain outstanding reliability performance.Keywords: operational excellence, enterprise asset management, maintenance management, plant wellness<strong>Plant</strong> and Equipment <strong>Wellness</strong> is a fully integrated life cycle asset management methodology. Its processesidentify and install <strong>the</strong> optimal asset maintenance system and work quality practices into your company tominimise operational risk and gain operational excellence. Figure 1 is <strong>the</strong> <strong>Plant</strong> <strong>Wellness</strong> Triangle for assetmanagement excellence, is shows you how to create and sustain highly reliable plant and equipment.Figure 1 Contents and Processes <strong>of</strong> a <strong>Plant</strong> <strong>Wellness</strong> <strong>Way</strong> Asset Management and Maintenance SystemC:\Users\Mike\Documents\<strong>Lifetime</strong> <strong>Reliability</strong>\LRS Maintenance Methodology\<strong>Overview</strong>_<strong>Plant</strong>_<strong>Wellness</strong>_<strong>Way</strong>_Methodology.docx 1
OPERATIONAL RISK MANAGEMENTQUALITY MANAGEMENTPERFORMANCE IMPROVEMENTPhone:Fax:Email:Website:+61 (0) 402 731 563+61 (8) 9457 8642info@lifetime-reliability.comwww.lifetime-reliability.comGreat operational asset performance is a vital component for operational excellence. An ideal assetmanagement system is perfectly structured to produce world class asset management results. An optimalasset maintenance system uses <strong>the</strong> least resources to produce world class operational equipment reliability.The <strong>Plant</strong> <strong>Wellness</strong> <strong>Way</strong> encompasses <strong>the</strong> full life cycle requirements for least cost, long-lived, lastingphysical asset health. Like human wellness, <strong>Plant</strong> <strong>Wellness</strong> focuses on living a life <strong>of</strong> maximum health andvitality, continuous fitness and wellbeing, and failure-free longevity.Summary <strong>of</strong> <strong>the</strong> <strong>Plant</strong> <strong>Wellness</strong> <strong>Way</strong> MethodologyTable 1 collects toge<strong>the</strong>r <strong>the</strong> contents <strong>of</strong> <strong>the</strong> <strong>Plant</strong> <strong>Wellness</strong> <strong>Way</strong> method. It shows you <strong>the</strong> steps to take toapply <strong>the</strong> methodology so that you can produce outstanding reliable equipment for operational excellence.No Strategy Requirement Description1234Determine equipmentcriticality and resultingoperational riskDetermine assembly andparts’ criticality andresulting operational riskIdentify componentfailure categoriesIdentify and selectcomponent life cyclewellness requirementsA simple risk decision chart is used to categorise <strong>the</strong> impact on your operation <strong>of</strong> eachitem <strong>of</strong> equipment should it fail.For each equipment item you use <strong>the</strong> same risk decision chart to identify criticalassemblies and components so that you know what you need to focus on to ensuremaximum equipment reliability.Using <strong>the</strong> Parts Drawing and Bill <strong>of</strong> Materials you categorise how each critical part canbe failed during its life—by degradation, by deformation, by human error.For critical parts identify <strong>the</strong> life cycle engineering, manufacturing, operational andmaintenance activities needed to create an environment that delivers maximum healthand fitness to <strong>the</strong> part so that maximum equipment reliability results.56789Categorise risk andfailure preventionstrategiesIdentify and selectcomponent health andwellness standardsIdentify engineering,operational andmaintenance actions toapplyIdentify spares andsupply chainmanagement strategiesConfirm equipment riskreduction is below <strong>the</strong>risk boundary andindustry ALARPBased on component failure categories for each critical part you decide <strong>the</strong> failureprevention strategies to apply— life cycle degradation management, life cycledeformation management, life cycle defect/error elimination.Specify <strong>the</strong> necessary ACE 3T quality standards for <strong>the</strong> required life cycle activities <strong>of</strong>each critical part that when met will ensure outstanding component reliability.Decide how best, and who is best, to deliver <strong>the</strong> ideal environment to every criticalcomponent—your choices include operational, preventive, predictive, proactive andprecision maintenance activities.Based on <strong>the</strong> component criticality, its likelihood <strong>of</strong> failure, and <strong>the</strong> availability <strong>of</strong> areplacement, you determine your spares holding and supply chain managementrequirements.For each equipment item test on <strong>the</strong> risk matrix that once <strong>the</strong> wellness activities are done<strong>the</strong> operational risk for <strong>the</strong> equipment is below <strong>the</strong> business risk boundary. Adjust, addand refine activities until <strong>the</strong> operational risk is acceptable. Note: <strong>the</strong> final risk may alsoneed to meet ALARP levels.10Cost <strong>the</strong> savings fromreduced operationallosses and higher uptimeUsing <strong>the</strong> identified operational risk reduction determine <strong>the</strong> moneys annually saved byapplying <strong>the</strong> <strong>Plant</strong> <strong>Wellness</strong> strategy.111213Develop plannedmaintenance work ordersto deliver and trackactivitiesDevelop <strong>the</strong> businessquality managementsystem needed to support<strong>Plant</strong> <strong>Wellness</strong>Continually improve <strong>the</strong>company’s use <strong>of</strong> <strong>Plant</strong><strong>Wellness</strong> strategy andactivitiesEquipment by equipment you write planned ACE 3T work orders that contain <strong>the</strong> exactrequirements and <strong>the</strong> necessary standards to deliver lifelong health. The works isscheduled and <strong>the</strong> cost to provide plant wellness is identified.Apply ISO 9001 to identify and establish <strong>the</strong> necessary business systems and supportingprocesses to deliver and improve <strong>the</strong> <strong>Plant</strong> <strong>Wellness</strong> results—documentation andconfiguration management, capital project management, planning and scheduling, humancapability management, reliability engineering, integrated business system, etc.Apply those Lean Six Sigma methods that deliver greater efficiency and effectiveness tooperational and maintenance processes—become a learning organisation, continuallydeveloping and integrating best practices.Table 1 Summary <strong>of</strong> <strong>the</strong> <strong>Plant</strong> <strong>Wellness</strong> <strong>Way</strong> MethodC:\Users\Mike\Documents\<strong>Lifetime</strong> <strong>Reliability</strong>\LRS Maintenance Methodology\<strong>Overview</strong>_<strong>Plant</strong>_<strong>Wellness</strong>_<strong>Way</strong>_Methodology.docx 2
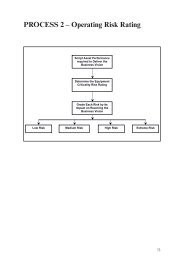
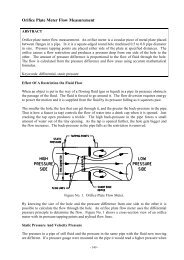
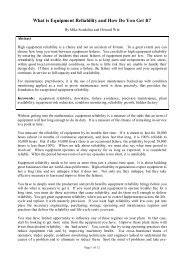
Phone:Fax:Email:Website:+61 (0) 402 731 563+61 (8) 9457 8642info@lifetime-reliability.comwww.lifetime-reliability.com<strong>Plant</strong> <strong>Wellness</strong> <strong>Way</strong> is a scientifically based, business risk prevention technique used by shopfloormaintainers through to degree qualified manager. It is a universal asset management process that is simple inconcept, correct in method, easy to apply, yet thorough and complete in its outputs. The methodology isbased on sound business risk management strategy and successful reliability improvement science. It getsyou and your people thinking correctly about failure prevention and shows you <strong>the</strong> right answers to adopt tocreate high equipment reliability and minimise life cycle operational costs.This article explains how to use <strong>the</strong> <strong>Plant</strong> <strong>Wellness</strong> method. You follow a step-by-step process that startswith how big <strong>the</strong> breakdown and failure risks are in your operation, <strong>the</strong>n determines <strong>the</strong> simplest and mosteffective ways to remove and prevent those risks, and ends up with showing you how to create <strong>the</strong> optimalbusiness processes to deliver a powerful wellness and health strategy for high equipment reliability.1. Determine Equipment Criticality and Resulting Operational RiskFirst an Equipment Criticality Analysis is done to identify <strong>the</strong> equipment where your operational risks arelocated to allow you to focus operational and maintenance efforts on where <strong>the</strong>y pay-<strong>of</strong>f <strong>the</strong> greatest for <strong>the</strong>business. Chart 1 is used with a company’s risk matrix to determine each physical asset’s criticality.Equipment by equipment, from <strong>the</strong> power supply into <strong>the</strong> operation through to each physical item <strong>of</strong> plant,gets rated for its criticality, i.e. <strong>the</strong> operating risk it brings to <strong>the</strong> business.<strong>Plant</strong> ItemFailsFailure EndangersProductionProcess isEnvironmentallyHazardousFailure EndangersPersonnel SafetyStatutory / SafetyLegislationBusinessConsequenceCriticalImmediateproductionstoppage, orqualityaffected?YNEvent safelyaddressedbeforeproduction orqualityimpacted?NEvent canescalate toimpact safety,environment,production,quality?YRiskAssessment,Risk MatrixYNNot CriticalLow CriticalityMedium CriticalityHigh CriticalityExtreme CriticalityChart 1 Assess Every <strong>Plant</strong> Item’s CriticalityThis assessment identifies how bad things can get in your operation if any <strong>of</strong> your operational equipmentfails. The top <strong>of</strong> <strong>the</strong> chart is for situations where you never want a failure event to happen. Deaths, lawC:\Users\Mike\Documents\<strong>Lifetime</strong> <strong>Reliability</strong>\LRS Maintenance Methodology\<strong>Overview</strong>_<strong>Plant</strong>_<strong>Wellness</strong>_<strong>Way</strong>_Methodology.docx 3
Phone:Fax:Email:Website:+61 (0) 402 731 563+61 (8) 9457 8642info@lifetime-reliability.comwww.lifetime-reliability.combreaking, environmental disasters, business destroying losses are failures you never want to face. Theprobability <strong>of</strong> such a failure event occurring is not a concern. These types <strong>of</strong> events must never happenbecause <strong>the</strong> consequences would be too severe and disastrous.Where <strong>the</strong> effect <strong>of</strong> a failure event is a production impact, <strong>the</strong>n <strong>the</strong> lower portion <strong>of</strong> <strong>the</strong> chart is used to applyprobability <strong>of</strong> <strong>the</strong> event occurring through use <strong>of</strong> a risk matrix during <strong>the</strong> risk assessment. The risk analysisand risk prevention tools used in <strong>the</strong> <strong>Plant</strong> <strong>Wellness</strong> <strong>Way</strong> (PWW) will get you to select risk controls andmitigations that drive your operational risk to low and lesser levels. At <strong>the</strong> completion <strong>of</strong> Step 1 you have alist starting with <strong>the</strong> most critical plant and equipment and going down to <strong>the</strong> least critical2. Determine Assembly and Parts’ Criticality and Resulting Operational RiskThis step looks at <strong>the</strong> assemblies and parts in each item <strong>of</strong> equipment to identify which are <strong>the</strong> criticalcomponents that cause bad risk when <strong>the</strong>y fail. An item <strong>of</strong> plant or equipment item only causes operationalrisk if critical components breakdown, stop working or lose integrity. The critical parts are now identified soappropriate risk management strategies, including operational and maintenance activities, can be selected.The same risk assessment chart used to identify equipment criticality is used to identify componentcriticality. The one difference is that in Chart 2 we start with an assembly or component. In <strong>the</strong> review eachpart in a machine and every section <strong>of</strong> pipe, flange and valve is risk analysed. It was a failed pressure reliefvalve (PRV) on a section <strong>of</strong> pipe that caused <strong>the</strong> Three Mile Island nuclear power plant disaster, and a PRVwas involved in <strong>the</strong> Piper Alpha <strong>of</strong>f-shore platform fire, so you must look at every physical item in youroperation and identify <strong>the</strong> worst case events that could happen should it fail.EquipmentPart FailsFailure EndangersProductionProcess isEnvironmentallyHazardousFailure EndangersPersonnel SafetyStatutory / SafetyLegislationBusinessConsequenceCriticalImmediateproductionstoppage, orqualityaffected?YNEvent safelyaddressedbeforeproduction orqualityimpacted?NEvent canescalate toimpact safety,environment,production,quality?YRiskAssessment,Risk MatrixYNNot CriticalLow CriticalityMedium CriticalityHigh CriticalityExtreme CriticalityChart 2 Assess Every Equipment Component’s CriticalityC:\Users\Mike\Documents\<strong>Lifetime</strong> <strong>Reliability</strong>\LRS Maintenance Methodology\<strong>Overview</strong>_<strong>Plant</strong>_<strong>Wellness</strong>_<strong>Way</strong>_Methodology.docx 4
Phone:Fax:Email:Website:+61 (0) 402 731 563+61 (8) 9457 8642info@lifetime-reliability.comwww.lifetime-reliability.com3. Identify Component Failure CategoriesBecause parts fail before <strong>the</strong> equipment fails, <strong>the</strong> <strong>Plant</strong> <strong>Wellness</strong> <strong>Way</strong> requires you to prevent critical part’sfailure. From Step Two you know <strong>the</strong> critical parts in all your machines and items <strong>of</strong> plant. Now we need tounderstand how each critical part can fail—what situations can cause a part to fail and make <strong>the</strong> equipmentbreakdown, stop operating properly or lose integrity.PWW focuses on using proactive failure prevention strategies instead <strong>of</strong> failure detection and repair. We arenot interested in using <strong>the</strong> normal asset management practice <strong>of</strong> <strong>Reliability</strong> Centre Maintenance (RCM)where you identify <strong>the</strong> many failure causes and <strong>the</strong>ir resulting failure modes for each item <strong>of</strong> plant. Insteadwe want to understand <strong>the</strong> type <strong>of</strong> situations that will lead to equipment failures and control <strong>the</strong> situationalcauses so that no failures will arise that we <strong>the</strong>n have to fix. By preventing failure causes starting <strong>Plant</strong><strong>Wellness</strong> saves companies vast amounts <strong>of</strong> money.For each equipment item its parts drawing, such as <strong>the</strong> one in Figure 2 for a V8 motor, and parts list, Figure 3for <strong>the</strong> V8 Motor, is used to identify <strong>the</strong> critical assemblies and components. Using <strong>the</strong> parts list each part iscategorised by <strong>the</strong> situations that can cause it to fail. Equipment components fail for one <strong>of</strong> two causes—<strong>the</strong>y become degraded by use or <strong>the</strong>y are over-stressed by deformation. Deformation is <strong>the</strong> result <strong>of</strong> a stresscreating incident and human error. Degradation occurs through wear-and-tear and accumulatingcontamination. In Step 3 <strong>the</strong> parts that degrade from use and wear are identified, as are parts that fail fromdeformation through excess stress. Usually equipment parts fail multiple ways.Figure 2 Equipment Parts DrawingAs shown on Chart 3, part by part is reviewed to see which situational causes lead to <strong>the</strong>ir failure. Theexplanation box in Figure 3 shows how <strong>the</strong>y are categorised by those circumstances that produce degradationand those that produce deformation.C:\Users\Mike\Documents\<strong>Lifetime</strong> <strong>Reliability</strong>\LRS Maintenance Methodology\<strong>Overview</strong>_<strong>Plant</strong>_<strong>Wellness</strong>_<strong>Way</strong>_Methodology.docx 5
Phone:Fax:Email:Website:+61 (0) 402 731 563+61 (8) 9457 8642info@lifetime-reliability.comwww.lifetime-reliability.comCriticalEquipmentEquipmentCritical PartDegradationFailureDeformationFailureContaminateswhen UsedAge and WearoutInduced StressInstallationErrorChart 3 Identify Situations that Cause Critical Parts FailFigure 3 Equipment Parts List Showing Parts Situational Failure CausesAt <strong>the</strong> end <strong>of</strong> Step 3 <strong>the</strong> critical parts are identified and <strong>the</strong> situational causes <strong>of</strong> <strong>the</strong>ir failure are known.C:\Users\Mike\Documents\<strong>Lifetime</strong> <strong>Reliability</strong>\LRS Maintenance Methodology\<strong>Overview</strong>_<strong>Plant</strong>_<strong>Wellness</strong>_<strong>Way</strong>_Methodology.docx 6
Phone:Fax:Email:Website:+61 (0) 402 731 563+61 (8) 9457 8642info@lifetime-reliability.comwww.lifetime-reliability.com4. Identify and Select Component Life Cycle <strong>Wellness</strong> Requirements<strong>Plant</strong> <strong>Wellness</strong> is a life cycle asset management philosophy that proactively prevents <strong>the</strong> causes <strong>of</strong> failurestarting. It requires that you put into place in your business <strong>the</strong> strategies, methods and practices whichcreate highly reliable plant and machinery. Prevent and control <strong>the</strong> situations that can cause bad risks andproblems to parts and you stop operational failures.To maximise operational pr<strong>of</strong>its we must prevent operational risks occurring. You need to find andimplement <strong>the</strong> specific actions that produce <strong>the</strong> required health outcomes which prevent critical parts failing.Loss can only happen if first a bad risk is present that can lead to <strong>the</strong> failure <strong>of</strong> an equipment’s critical parts.If you prevent <strong>the</strong> start <strong>of</strong> a bad risk you kill <strong>the</strong> failure cause and effect tree by removing <strong>the</strong> root causes <strong>of</strong>failure. Stop opportunity for a failure to start you get reliability.The PWW gets you to chose risk removal and mitigation activities for each phase <strong>of</strong> a critical component’slife cycle to greatly reduce <strong>the</strong> opportunity <strong>of</strong> error and defects arising during its lifetime. By preventingoperational risks at every stage <strong>of</strong> a component’s life you stop <strong>the</strong> defects and errors that will later becomeoperational equipment failures.Chart 4 helps you to target <strong>the</strong> sort <strong>of</strong> practical techniques and deeds that create machinery and equipmen<strong>the</strong>alth and plant-wide wellness in your operation. When you stop critical parts failing your equipmentbecomes outstandingly reliable. Chart 4 is used to select <strong>the</strong> types <strong>of</strong> life cycle activities on which to focusthat will prevent equipment failure.EquipmentCritical PartDegradationFailureDeformationFailurePart LocalEnvironmentFailureOverload andFatigue FailureLife Cycle RisksFailureFits andTolerancePrecisionTemperatureRegulationFastenerTensionAccuracyHuman ErrorPreventionOverloadStressPreventionLubricationConditionDeformationPreventionShaftMisalignmentVibrationPreventionMaterials <strong>of</strong>ConstructionSelectionChart 4 Selecting Part’s Failure Prevention Life Cycle StrategiesFor each critical part, <strong>the</strong> trigger risks listed at <strong>the</strong> bottom <strong>of</strong> Chart 4 are used to review <strong>the</strong> part and identifyif it can be failed from any <strong>of</strong> <strong>the</strong> risk factors. Activities are <strong>the</strong>n identified to address <strong>the</strong> part’s localenvironment, operational stresses and life cycle risks to remove or at least greatly reduce <strong>the</strong> risk factor. TheC:\Users\Mike\Documents\<strong>Lifetime</strong> <strong>Reliability</strong>\LRS Maintenance Methodology\<strong>Overview</strong>_<strong>Plant</strong>_<strong>Wellness</strong>_<strong>Way</strong>_Methodology.docx 7
Phone:Fax:Email:Website:+61 (0) 402 731 563+61 (8) 9457 8642info@lifetime-reliability.comwww.lifetime-reliability.compower <strong>of</strong> <strong>Plant</strong> <strong>Wellness</strong> is its recognition that <strong>the</strong>re are only a few fundamental causes <strong>of</strong> failure and bycontrolling <strong>the</strong>m you can get any level <strong>of</strong> plant and equipment reliability that you want. Unlike o<strong>the</strong>r assetmanagement methodologies that look for evidence <strong>of</strong> failure and <strong>the</strong>n fix <strong>the</strong> failure, PWW instead gets youto recognise <strong>the</strong> situations that produce outstanding reliability and create <strong>the</strong>m in your business.5. Categorise Risk and Failure Prevention StrategiesPWW requires you to put <strong>the</strong> risk mitigation actions into appropriate engineering, operational andmaintenance processes to ensure that <strong>the</strong>y happen correctly. Knowing how <strong>the</strong> critical parts will be protectedfrom failure allows you to identify guiding project engineering, operational and maintenance strategies toprevent <strong>the</strong>ir failure. Chart 5 is used to categorise <strong>the</strong> life cycle failure prevention activities into <strong>the</strong>applicable strategies that prevent and control <strong>the</strong> situational circumstances that lead to a critical part’s failure.Parts that fail from induced stress require strategies that remove and prevent over-stress circumstancesdeveloping. Parts that fail from installation error need <strong>the</strong>ir installation process to be carefully controlled.Parts that fail from contamination require strategies to prevent or remove contamination. Those parts thatdegrade by wear need strategies to reduce degradation and ensure that <strong>the</strong>y are replaced before <strong>the</strong>y fail.Notice that we have started at <strong>the</strong> bottom <strong>of</strong> <strong>the</strong> <strong>Plant</strong> <strong>Wellness</strong> Triangle—with <strong>the</strong> parts. By delivering <strong>the</strong>right strategies for your parts you get outstanding equipment reliability. Once <strong>the</strong> right pre-emptive riskactivities are selected <strong>the</strong> PWW methodology will take you up <strong>the</strong> ‘stress to business process’ triangle andshow you <strong>the</strong> business processes to build in order to surely deliver <strong>the</strong> right life cycle asset managementstrategies to your equipment and machinery for lifetime reliability.6. Identify and Select Component Health and <strong>Wellness</strong> StandardsWe have so far selected engineering, operational and maintenance risk management strategies and activitiesto prevent defects and errors during each critical components’ life cycle phases. Next you need to set <strong>the</strong>performance standards for each activity that, when <strong>the</strong> standard is achieved, will deliver long, highly reliablecomponent life. With long, failure-free component life comes long, trouble-free equipment life and you get<strong>the</strong> high plant availability that you want.These standards are <strong>the</strong> precision workmanship and quality control standards that need to be met throughout<strong>the</strong> life cycle by your consultants, vendors, suppliers, contractors and your own engineering, operations andmaintenance people. In setting and providing quality standards you place minimum acceptance criteria onequipment performance and work quality outcomes so that a known degree <strong>of</strong> reliability is achieved. Whena higher level <strong>of</strong> reliability is wanted we make <strong>the</strong> quality standards more demanding and develop <strong>the</strong>methods to achieve <strong>the</strong>m with certainty.The types <strong>of</strong> precision standards to be introduced for machines are explained in <strong>the</strong> downloadable PDFarticle Setting Maintenance and <strong>Reliability</strong> Standards for High Machinery <strong>Reliability</strong>. The suggestedmachinery standards in <strong>the</strong> article are repeated in Table 2.7. Identify Engineering, Operational and Maintenance Actions to ApplyYou next identify ownership for each risk mitigation activity and action. You make clear where <strong>the</strong>responsibility and accountability lays for <strong>the</strong> performance <strong>of</strong> each activity. Chart 5 identifies <strong>the</strong> applicablebusiness and risk management processes that an activity will belong to. The selected strategies, methods,activities and standards are written into <strong>the</strong> applicable company processes by including <strong>the</strong>m in <strong>the</strong> relevantbusiness process documentation. Policies, procedures, work instructions and training are updated to include<strong>the</strong> activities that need to be performed and <strong>the</strong> standards that need to be achieved.You start by documenting <strong>the</strong> correct way equipment reliability is achieved and <strong>the</strong>n you train your people todo <strong>the</strong> right activities rightly. We first educate people in <strong>the</strong> right practices and <strong>the</strong>n teach <strong>the</strong>m to correctlyuse <strong>the</strong> right practices. The <strong>Plant</strong> <strong>Wellness</strong> <strong>Way</strong> is written into your processes and inculcated into <strong>the</strong>operation, and <strong>the</strong>reby it is forevermore made part your organisation’s cultural DNA.C:\Users\Mike\Documents\<strong>Lifetime</strong> <strong>Reliability</strong>\LRS Maintenance Methodology\<strong>Overview</strong>_<strong>Plant</strong>_<strong>Wellness</strong>_<strong>Way</strong>_Methodology.docx 8
Phone:Fax:Email:Website:+61 (0) 402 731 563+61 (8) 9457 8642info@lifetime-reliability.comwww.lifetime-reliability.comEquipmentCritical PartDegradationFailureDeformationFailureContaminateswhen UsedAge and WearoutInduced StressInstallationErrorPredictiveMaintenancePreventiveMaintenanceProjectDOCTORPreventiveMaintenanceOperationDegradationManagementOperationDeformationManagementPredictiveMaintenanceProjectDOCTORProactivePrecisionMaintenanceAccuracyControlledProceduresPrecisionMaintenanceSkillsDOCTOR = Design and Operations Costs Totally Optimised RiskChart 5 Selecting Applicable Business Processes for <strong>the</strong> Failure Prevention StrategiesC:\Users\Mike\Documents\<strong>Lifetime</strong> <strong>Reliability</strong>\LRS Maintenance Methodology\<strong>Overview</strong>_<strong>Plant</strong>_<strong>Wellness</strong>_<strong>Way</strong>_Methodology.docx 9
Phone:Fax:Email:Website:+61 (0) 402 731 563+61 (8) 9457 8642info@lifetime-reliability.comwww.lifetime-reliability.com1NoBUSINESS PROCESSFAILUREPoor lubricationconditionVISUAL OBSERVATIONEFFECT ON MACHINELIFE PRECISIONREQUIREMENTChemically correct,contaminant-freelubricantPARAMETERS TARGET VALUE TOLERANCEVISCOSITY,ADDITIVES,DISSOLVED WATER,WEAR PARTICLECOUNTRight viscosity atoperatingtemperature; Correctproportion <strong>of</strong>additives;
Phone:Fax:Email:Website:+61 (0) 402 731 563+61 (8) 9457 8642info@lifetime-reliability.comwww.lifetime-reliability.com8910Induced andforced vibrationIncorrectlytightenedfastenersPoor conditiontools andmeasuresTotal machinevibration lowCorrect torques andtensions in allcomponentsCorrect tools inprecise condition todo task to properstandardsMACHINE VIBRATION,MACHINEDISTORTION,STRUCTURALRIGIDITYSHANK TENSION,LOOSENESS,FASTENER GRADEGOOD-AS-NEWCONDITION, RELIABLYCALIBRATED1.5mm/s rms± 5% <strong>of</strong> correcttensionAs newcondition/correctlycalibrated4mm/s rms± 10%11Inappropriatematerials <strong>of</strong>constructionOnly inspecificationpartsMATERIAL OFCONSTRUCTION,DIMENSIONALSPECIFICATIONOEM approvedmaterial and designspecs12Root cause notremovedFailure causeremoval duringmaintenanceCREATIVEDISASSEMBLY,DEFECT ELIMINATIONUse CreativeDisassembly andPrecision Assembly13Assembly qualitybelow standardPro<strong>of</strong> test forprecision assemblyqualityINSPECTION TESTACCURACY,PRECISIONSTANDARDEnsure every activityis proven correct(apply <strong>the</strong>Carpenter’s Creed)MilestoneTasks Tested14Process out-<strong>of</strong>controland/ornot capableA quality assurancesystem to make all<strong>the</strong> above happenQUALITY CONTROLSTANDARDS,PROCESS INSTATISTICALCONTROLACE 3T ProceduresITP(Inspection &Test Plan)NOTE: These parameters are indicative and may not apply to a particular machine. Confirm actual requirements with <strong>the</strong> manufacturer.Table 2 Indicative Target Values for Creating High Machine <strong>Reliability</strong>C:\Users\Mike\Documents\<strong>Lifetime</strong> <strong>Reliability</strong>\LRS Maintenance Methodology\<strong>Overview</strong>_<strong>Plant</strong>_<strong>Wellness</strong>_<strong>Way</strong>_Methodology.docx 11
Phone:Fax:Email:Website:+61 (0) 402 731 563+61 (8) 9457 8642info@lifetime-reliability.comwww.lifetime-reliability.com8. Identify Spares and Supply Chain Management StrategiesSome <strong>of</strong> <strong>the</strong> actions and activities in <strong>the</strong> various risk management strategies used will require that parts andmaterial be available to minimise business and operational risks. The supply chain management, purchasingand materials management practices that make those items available at <strong>the</strong> appropriate times need to beidentified and put into place. Which parts and materials are needed on-hand or which can be brought areidentified with <strong>the</strong> help <strong>of</strong> Chart 6, which is Chart 1 modified to consider spare parts criticality.Critical PartNot AvailableFailure EndangersProductionProcess isEnvironmentallyHazardousFailure EndangersPersonnel SafetyStatutory / SafetyLegislationBusinessConsequenceCriticalImmediateproductionstoppage, orqualityaffected?YNEvent safelyaddressedbeforeproduction orqualityimpacted?NEvent canescalate toimpact safety,environment,production,quality?YRiskAssessment,Risk MatrixYNNot CriticalLow CriticalityMedium CriticalityHigh CriticalityExtreme CriticalityChart 6 Assess Spare Part CriticalityLike any risk based decision, which parts to carry, which parts to purchase-on-demand and <strong>the</strong> integrity <strong>of</strong><strong>the</strong> business processes that support <strong>the</strong> supply chain and materials management practices are dependent on<strong>the</strong> risk a company is willing to carry.9. Confirm Equipment Risk Reduction is Below <strong>the</strong> Risk Boundary and Industry ALARPThe PWW methodology requires that <strong>the</strong> risk mitigations selected must drive <strong>the</strong> operational risk for anasset to below <strong>the</strong> Corporate Low risk level, and if necessary down to <strong>the</strong> industry’s As Low As ReasonablyPracticable (ALARP) level.It is easy to select risk management activities and create a lot <strong>of</strong> work for operators and maintainers. Justbecause a mitigation can be imagined and performed it does not mean that operational risk is reduced bydoing <strong>the</strong> activity. When risk mitigations are chosen <strong>the</strong>y must surely, without question, reduce risk—ei<strong>the</strong>rby reducing <strong>the</strong> loss from <strong>the</strong> failure event and/or by reducing <strong>the</strong> frequency <strong>of</strong> <strong>the</strong> failure event. <strong>Plant</strong><strong>Wellness</strong> requires indisputable evidence that <strong>the</strong> failure rate <strong>of</strong> a critical part is substantially reduced byC:\Users\Mike\Documents\<strong>Lifetime</strong> <strong>Reliability</strong>\LRS Maintenance Methodology\<strong>Overview</strong>_<strong>Plant</strong>_<strong>Wellness</strong>_<strong>Way</strong>_Methodology.docx 12
Phone:Fax:Email:Website:+61 (0) 402 731 563+61 (8) 9457 8642info@lifetime-reliability.comwww.lifetime-reliability.comdoing <strong>the</strong> mitigation activity. Consequence reduction alone is not enough; <strong>the</strong>re must be clear frequencyreduction visible on <strong>the</strong> risk matrix. Only frequency reduction means real reliability improvement.Figure 5 Not All Maintenance Work Actually Reduces RiskFigure 5 shows how easy it is to develop maintenance activities that have no risk reduction value. When <strong>the</strong>valve passes <strong>the</strong>re is a loss <strong>of</strong> $100,000 operational cost to rectify <strong>the</strong> problem and in lost opportunity to sellproduct. A valve on average lasts three years before it passes. The inspection will ei<strong>the</strong>r find a valve inworking condition or in a unusable condition. The maintenance task to inspect <strong>the</strong> valve integrity every yeardoes not stop <strong>the</strong> failure or reduce <strong>the</strong> chance <strong>of</strong> failure. The annual $10,000 task is a waste <strong>of</strong> time andmoney because risk is not changed by doing <strong>the</strong> maintenance. The maintenance activity to integrity test <strong>the</strong>valve will do nothing to actually stop <strong>the</strong> valve failing. It would be better to replace <strong>the</strong> valve with aproperly renewed valve every three years at $25,000 a time and do naught else. By replacing <strong>the</strong> valve witha fully refurbished valve on a three-yearly cycle, half <strong>the</strong> valves would not have failed and <strong>the</strong> $100,000 eachwould cost repairing <strong>the</strong>m during operation would be saved.To do justice to <strong>the</strong> business <strong>the</strong> failure-prone control valves should undergo a full and proper root causeanalysis <strong>of</strong> <strong>the</strong> failures to develop better answers that address <strong>the</strong> real causes <strong>of</strong> control valves passing.10. Cost <strong>the</strong> Savings from Reduced Operational Losses and Higher UptimeBecause <strong>Plant</strong> <strong>Wellness</strong> requires a clear, observable reduction in failure event frequency to be identified on<strong>the</strong> risk matrix we can also measure <strong>the</strong> expected financial benefits from every risk mitigation activity.Figure 6 shows how money saved is identified on a risk matrix from doing an effective mitigation. Aconsequence reduction will produce obvious savings and an event frequency reduction will lead to fewerfailures over a period <strong>of</strong> time. Both consequence reduction and frequency reduction bring measurablefinancial gain that can be estimated for each risk mitigation undertaken before committing to it being done.C:\Users\Mike\Documents\<strong>Lifetime</strong> <strong>Reliability</strong>\LRS Maintenance Methodology\<strong>Overview</strong>_<strong>Plant</strong>_<strong>Wellness</strong>_<strong>Way</strong>_Methodology.docx 13
Phone:Fax:Email:Website:+61 (0) 402 731 563+61 (8) 9457 8642info@lifetime-reliability.comwww.lifetime-reliability.comFigure 6 Check <strong>the</strong> Money Saved by Doing an ActivityThe quantum <strong>of</strong> moneys saved is determined by using a spreadsheet in which each mitigation’s consequencereduction and frequency reduction financial benefits are tabulated and tallied.11. Develop Planned Maintenance Work Orders to Deliver and Track ActivitiesThe selected risk mitigations must be done to prevent opportunity <strong>of</strong> a bad event to arise and develop, and tolimit <strong>the</strong> consequence <strong>of</strong> a bad event. It is only by doing <strong>the</strong> mitigations that risk is contained. It isnecessary to ensure that all mitigations are done, traceable and <strong>the</strong>ir proper actioning is recorded. The riskmanagement activities selected to be done by Operations and Maintenance are put into <strong>the</strong> ComputerisedMaintenance Management System. Each activity is planned thoroughly and in detail so that a work packwith all necessary information, parts, materials and actions to be taken and recorded is available for each jobwhen it is done. You can follow this link to a PDF article to read more about How Well Should aMaintenance Job be Planned?Those operational risk mitigations that belong to Capital Projects, Engineering and o<strong>the</strong>r departments arewritten into <strong>the</strong> applicable process documents. Where mitigations are time based in those departments <strong>the</strong>mitigations are initiated through an automatic system so <strong>the</strong>y are not forgotten. For situational basedmitigations applicable procedures will generate needed actions and management activities will track <strong>the</strong>m.An annual audit reviewing risk management and mitigation is undertaken to ensure <strong>the</strong> necessary risk controlactivities and actions are being performed by all parties. As part <strong>of</strong> weekly, monthly and annual reporting<strong>the</strong> performance and success <strong>of</strong> risk mitigations are measured and reported to senior management.12. Develop <strong>the</strong> Business Quality Management System Needed to Support <strong>Plant</strong> <strong>Wellness</strong>We are now at <strong>the</strong> top <strong>of</strong> <strong>the</strong> <strong>Plant</strong> <strong>Wellness</strong> <strong>Way</strong> Triangle in <strong>the</strong> region related to <strong>the</strong> business systems andprocesses needed to sustain <strong>the</strong> equipment health that delivers <strong>Plant</strong> <strong>Wellness</strong> at <strong>the</strong> corporate level.C:\Users\Mike\Documents\<strong>Lifetime</strong> <strong>Reliability</strong>\LRS Maintenance Methodology\<strong>Overview</strong>_<strong>Plant</strong>_<strong>Wellness</strong>_<strong>Way</strong>_Methodology.docx 14
Phone:Fax:Email:Website:+61 (0) 402 731 563+61 (8) 9457 8642info@lifetime-reliability.comwww.lifetime-reliability.comThe previous steps in <strong>the</strong> PWW methodology produce <strong>the</strong> risk control activities and risk mitigation actionsthat greatly reduce operational risks. Across <strong>the</strong> life cycle <strong>of</strong> every asset we identify what to do to getoutstanding equipment reliability. It is now necessary to ensure that all <strong>the</strong>se risk reduction activities andlifetime reliability deeds are done, and always will be done, by <strong>the</strong> organisation.Chart 7 shows a business quality management system and <strong>the</strong> <strong>Plant</strong> <strong>Wellness</strong> processes needed to reduceoperational risk and reach high equipment reliability. The processes shown are used to produce <strong>the</strong> assetmanagement performance required to get operational excellence. The top row <strong>of</strong> processes are <strong>the</strong> ‘working’processes—those whose outputs deliver lifetime reliability. The bottom row <strong>of</strong> processes are those thatsustain <strong>Plant</strong> <strong>Wellness</strong>. The aim is to have small <strong>the</strong> smallest business processes while ensuring each processachieves, nourishes and maintains everlasting <strong>Plant</strong> and Equipment <strong>Wellness</strong> in your company.13. Continually Improve <strong>the</strong> Company’s Use <strong>of</strong> <strong>Plant</strong> <strong>Wellness</strong> Strategy and ActivitiesFigure 7 shows <strong>the</strong> self-improvement model used by learning organisations to push <strong>the</strong>mselves to <strong>the</strong>forefront <strong>of</strong> performance. It is a powerful tactic for improving equipment reliability and getting <strong>Plant</strong><strong>Wellness</strong> asset management success. It asks you to test new ideas and approaches purposefully seekingimprovement and to adopt changes that bring you benefits. Introducing Lean principles and practices intoyour organisation and using <strong>the</strong>m properly fits <strong>the</strong> model and provides you with pacesetter rewards.The success <strong>of</strong> a company depends on <strong>the</strong> usefulness <strong>of</strong> its products and services and its ability to deliverbetter products for less cost using fewer resources. This requires new cost reduction practices andinnovations that generate an advantage. The simplest way to become a learning organisation that continuallyimproves itself is to adopt <strong>the</strong> practices and methodologies <strong>of</strong> LEAN throughout <strong>the</strong> business. FromBoardroom to shopfloor introduce and master <strong>the</strong> Lean processes and practices that create efficiency toreduce costs and those that drive creativity and change to improve <strong>the</strong> business.Figure 7 Becoming a Learning OrganisationFor more information and details on using <strong>the</strong> <strong>Plant</strong> <strong>Wellness</strong> <strong>Way</strong> methodology please contact MikeSondalini at www.lifetime-reliability.com.C:\Users\Mike\Documents\<strong>Lifetime</strong> <strong>Reliability</strong>\LRS Maintenance Methodology\<strong>Overview</strong>_<strong>Plant</strong>_<strong>Wellness</strong>_<strong>Way</strong>_Methodology.docx 15
Phone:Fax:Email:Website:+61 (0) 402 731 563+61 (8) 9457 8642info@lifetime-reliability.comwww.lifetime-reliability.comCritical PartDegradationFailureDeformationFailureContaminateswhen UsedAge and WearoutInduced StressInstallationErrorPredictiveMaintenancePreventiveMaintenanceOperationalPr<strong>of</strong>it ProjectSelectionPreventiveMaintenanceDeformationManagementOperationDeformationManagementOperationPredictiveMaintenanceOperationalPr<strong>of</strong>it ProjectSelectionProactivePrecisionMaintenanceAccuracyControlledProceduresPrecisionMaintenanceSkillsISO 9001 Business Quality Management SystemPlanning andSchedulingACE EquiptQualityStandardsACEEngineeringStandardsLeanWorkplacePracticesMaterialManagementOperationsPrecisionSkills TrainingACE 3TOperationalProceduresCapitalProjectManagementAutonomousMaintenance(TPM)MaintenancePrecisionSkills TrainingACE 3TMaintenanceProcedures<strong>Reliability</strong>Growth CauseAnalysisProactiveMaintenanceBusinessProcessImprovementDocument &ConfigurationManagementHumanCapabilitiesManagement<strong>Reliability</strong>EngineeringCapitalProjectManagementKnowledgeManagementACE QualityManagementSystemSupply ChainManagementLearningOrganisationLife CycleCostingBusiness RiskManagementAutonomousTeamsIntegratedBusinessSystemChart 7 The Supporting Business Management System and Its Processes Needed to Reach and Sustain <strong>Plant</strong> and Equipment <strong>Wellness</strong>ACE = Accuracy Controlled EnterpriseC:\Users\Mike\Documents\<strong>Lifetime</strong> <strong>Reliability</strong>\LRS Maintenance Methodology\<strong>Overview</strong>_<strong>Plant</strong>_<strong>Wellness</strong>_<strong>Way</strong>_Methodology.docx 16