
Create successful ePaper yourself
Turn your PDF publications into a flip-book with our unique Google optimized e-Paper software.
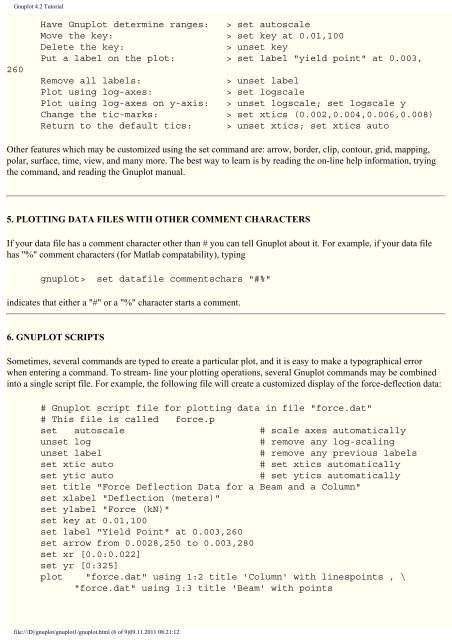
<strong>Gnuplot</strong> <strong>4.2</strong> <strong>Tutorial</strong>260Have <strong>Gnuplot</strong> determine ranges: > set autoscaleMove the key: > set key at 0.01,100Delete the key:> unset keyPut a label on the plot: > set label "yield point" at 0.003,Remove all labels:> unset labelPlot using log-axes:> set logscalePlot using log-axes on y-axis: > unset logscale; set logscale yChange the tic-marks: > set xtics (0.002,0.004,0.006,0.008)Return to the default tics: > unset xtics; set xtics autoOther features which may be customized using the set command are: arrow, border, clip, contour, grid, mapping,polar, surface, time, view, and many more. The best way to learn is by reading the on-line help information, tryingthe command, and reading the <strong>Gnuplot</strong> manual.5. PLOTTING DATA FILES WITH OTHER COMMENT CHARACTERSIf your data file has a comment character other than # you can tell <strong>Gnuplot</strong> about it. For example, if your data filehas "%" comment characters (for Matlab compatability), typinggnuplot> set datafile commentschars "#%"indicates that either a "#" or a "%" character starts a comment.6. GNUPLOT SCRIPTSSometimes, several commands are typed to create a particular plot, and it is easy to make a typographical errorwhen entering a command. To stream- line your plotting operations, several <strong>Gnuplot</strong> commands may be combinedinto a single script file. For example, the following file will create a customized display of the force-deflection data:# <strong>Gnuplot</strong> script file for plotting data in file "force.dat"# This file is called force.pset autoscale # scale axes automaticallyunset log# remove any log-scalingunset label# remove any previous labelsset xtic auto# set xtics automaticallyset ytic auto# set ytics automaticallyset title "Force Deflection Data for a Beam and a Column"set xlabel "Deflection (meters)"set ylabel "Force (kN)"set key at 0.01,100set label "Yield Point" at 0.003,260set arrow from 0.0028,250 to 0.003,280set xr [0.0:0.022]set yr [0:325]plot "force.dat" using 1:2 title 'Column' with linespoints , \"force.dat" using 1:3 title 'Beam' with pointsfile:///D|/gnuplot/gnuplot1/gnuplot.html (6 of 9)09.11.2011 08:21:12