

Activities - Benjamin-Mills
Activities - Benjamin-Mills
Activities - Benjamin-Mills

You also want an ePaper? Increase the reach of your titles
YUMPU automatically turns print PDFs into web optimized ePapers that Google loves.
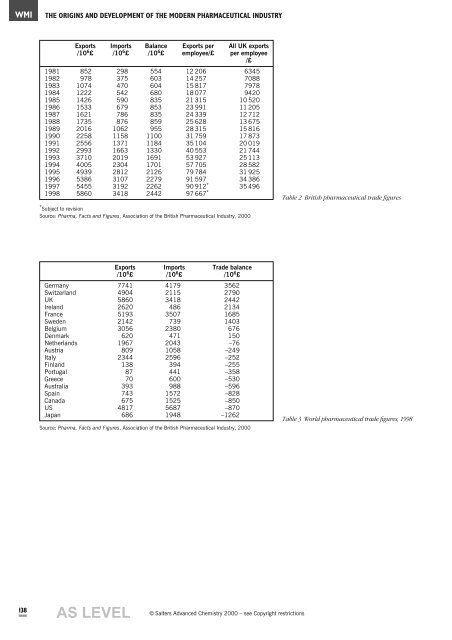
WM1THE ORIGINS AND DEVELOPMENT OF THE MODERN PHARMACEUTICAL INDUSTRYExports Imports Balance Exports per All UK exports/10 6 £ /10 6 £ /10 6 £ employee/£ per employee/£1981 852 298 554 12 206 63451982 978 375 603 14 257 70881983 1074 470 604 15 817 79781984 1222 542 680 18 077 94201985 1426 590 835 21 315 10 5201986 1533 679 853 23 991 11 2051987 1621 786 835 24 339 12 7121988 1735 876 859 25 628 13 6751989 2016 1062 955 28 315 15 8161990 2258 1158 1100 31 759 17 8731991 2556 1371 1184 35 104 20 0191992 2993 1663 1330 40 553 21 7441993 3710 2019 1691 53 927 25 1131994 4005 2304 1701 57 705 28 5821995 4939 2812 2126 79 784 31 9251996 5386 3107 2279 91 597 34 3861997 5455 3192 2262 90 912 * 35 4961998 5860 3418 2442 97 667 * Table 2 British pharmaceutical trade figures* Subject to revisionSource: Pharma, Facts and Figures, Association of the British Pharmaceutical Industry, 2000Exports Imports Trade balance/10 6 £ /10 6 £ /10 6 £Germany 7741 4179 3562Switzerland 4904 2115 2790UK 5860 3418 2442Ireland 2620 486 2134France 5193 3507 1685Sweden 2142 739 1403Belgium 3056 2380 676Denmark 620 471 150Netherlands 1967 2043 –76Austria 809 1058 –249Italy 2344 2596 –252Finland 138 394 –255Portugal 87 441 –358Greece 70 600 –530Australia 393 988 –596Spain 743 1572 –828Canada 675 1525 –850US 4817 5687 –870Japan 686 1948 –1262Source: Pharma, Facts and Figures, Association of the British Pharmaceutical Industry, 2000Table 3 World pharmaceutical trade figures, 1998138AS LEVEL„ Salters Advanced Chemistry 2000 – see Copyright restrictions


![ISI Web of Knowledge [v.4.10] - All Databases Results - Benjamin-Mills](https://img.yumpu.com/39253071/1/184x260/isi-web-of-knowledge-v410-all-databases-results-benjamin-mills.jpg?quality=85)