

Andhra Pradesh - DISE
Andhra Pradesh - DISE
Andhra Pradesh - DISE
- No tags were found...

You also want an ePaper? Increase the reach of your titles
YUMPU automatically turns print PDFs into web optimized ePapers that Google loves.
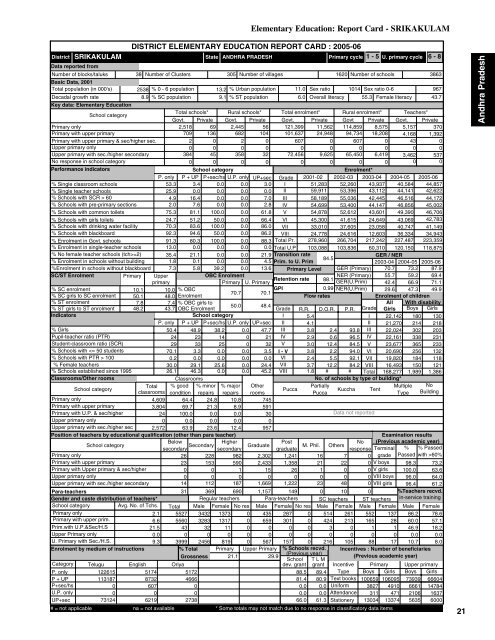
SRIKAKULAMDistrictData reported fromNumber of blocks/taluksBasic Data, 2001Total population (in 000's)Decadal growth ratePara-teachersGender and caste distribution of teachers*School categoryAvg. No. of Tchs.Primary only2.1Primary with upper prim.6.6Prim.with U.P.&Sec/H.S21.5Upper Primary only0.0U. Primary with Sec./H.S.9.3Enrolment by medium of instructionsDISTRICT ELEMENTARY EDUCATION REPORT CARD : 2005-06State38 Number of Clusters 305 Number of villages1620 Number of schools38632538 % 0 - 6 population 13.2 % Urban population 11.0 Sex ratio 1014 Sex ratio 0-69678.9 % SC population 9.1 % ST population6.0 Overall literacy 55.3 Female literacy 43.73999 2456% TotalGrossnessPrimary cycle 1 - 5 U. primary cycle 6 - 8Key data: Elementary EducationSchool categoryTotal schools* Rural schools* Total enrolment* Rural enrolment* Teachers*Govt. Private Govt. Private Govt. Private Govt Private Govt. PrivatePrimary only2,518 69 2,445 56 121,399 11,562 114,859 8,575 5,157 370Primary with upper primary709 136 682 104 101,637 24,948 94,734 18,208 4,168 1,392Primary with upper primary & sec/higher sec.2 0 2 0 607 0 607 0 43 0Upper primary only0 0 0 0 0 0 0 0 0 0Upper primary with sec./higher secondary384 45 358 32 72,456 9,625 65,450 6,419 3,462 537No response in school category0 0 0 0 0 0 0 0 0 0Performance indicatorsSchool categoryEnrolment*P. only P + UP P+sec/hs U.P. only UP+sec Grade 2001-02 2002-03 2003-04 2004-05 2005-06% Single classroom schools53.3 3.4 0.0 0.0 3.0 I 51,283 52,260 43,937 40,584 44,857% Single teacher schools25.9 0.0 0.0 0.0 0.0 II 59,911 53,396 43,112 44,141 42,622% Schools with SCR > 604.9 16.4 0.0 0.0 7.0 III 58,189 55,036 42,445 46,516 44,172% Schools with pre-primary sections 2.0 7.6 0.0 0.0 2.8 IV 54,699 53,400 44,147 46,856 45,002% Schools with common toilets 75.3 81.1 100.0 0.0 61.8 V 54,878 52,612 43,601 49,390 46,706% Schools with girls toilets 24.7 51.2 50.0 0.0 66.4 VI 45,300 41,615 24,649 43,069 42,783% Schools with drinking water facility 70.3 83.6 100.0 0.0 86.0 VII 33,010 37,605 23,058 40,747 41,149% Schools with blackboard92.3 94.6 50.0 0.0 86.2 VIII 24,778 24,616 12,603 36,334 34,943% Enrolment in Govt. schools 91.3 80.3 100.0 0.0 88.3 Total Pr. 278,960 266,704 217,242 227,487 223,359% Enrolment in single-teacher schools 13.0 0.0 0.0 0.0 0.0 Total U.P 103,088 103,836 60,310 120,150 118,875% No female teacher schools (tch>=2) 35.4 21.1 0.0 0.0 21.9 Transition rateGER / NER84.5% Enrolment in schools without building 1.8 0.1 0.0 0.0 4.5 Prim. to U. Prim2003-04 2004-05 2005-06%Enrolment in schools without blackboard 7.3 5.8 39.2 0.0 13.6 Primary Level GER (Primary) 70.7 73.2 87.9SC/ST EnrolmentPrimary UpperOBC EnrolmentNER (Primary) 55.7 59.2 69.4Retention rate 88.1primaryPrimary U. PrimaryGER(U.Prim) 42.4 66.9 71.1% SC enrolment10.1 10.0 % OBCGPI0.99 NER(U.Prim) 29.6 47.3 49.970.7 70.1% SC girls to SC enrolment 50.1 48.0 EnrolmentFlow ratesEnrolment of children% ST enrolment7.8 7.4 % OBC girls toAll With disability50.0 48.4% ST girls to ST enrolment 48.2 43.7 OBC EnrolmentGrade R.R. D.O.R. P.R. Grade Girls Boys GirlsIndicatorsSchool categoryI 5.4I 22,142 180 130P. only P + UP P+sec/hs U.P. only UP+sec II 4.1II 21,270 214 218% Girls50.4 48.9 38.2 0.0 47.7 III 3.8 2.4 93.8 III 22,024 302 203Pupil-teacher ratio (PTR)24 23 14 0 21 IV 2.9 0.6 96.5 IV 22,161 338 231Student-classroom ratio (SCR)29 33 25 0 32 V 3.0 12.4 84.5 V 23,677 365 233% Schools with 1000.2 0.0 0.0 0.0 0.0 VI 2.4 5.5 92.1 VII 19,820 184 118% Female teachers30.0 29.1 25.6 0.0 24.4 VII 3.7 12.2 84.2 VIII 16,493 150 121% Schools established since 199526.1 46.3 0.0 0.0 45.2 VIII 1.8 # # Total 168,277 1,989 1,386Classrooms/Other roomsClassroomsNo. of schools by type of building*School categoryTotal % good % minor % major OtherPartiallyMultiple NoPuccaKuccha Tentclassrooms condition repairs repairs roomsPuccaType BuildingPrimary only4,609 64.4 24.8 10.8 745Primary with upper primary3,804 69.7 21.3 8.9 591Primary with U.P. & sec/higher24 100.0 0.0 0.0 30Data not reportedUpper primary only0 0.0 0.0 0.00Upper primary with sec./higher sec 2,572 63.9 23.6 12.4 957Position of teachers by educational qualification (other than para teacher)Examination resultsSchool category BelowHigherPost(Previous academic year)M. Phil.secondarysecondarygraduateNoresponse Terminal % % Passed26 228 982 2,302 1,241 16 7 0 grade Passed with >60%V boysPrimary onlyPrimary with upper primaryPrimary with Upper primary & sec/higherUpper primary onlyUpper primary with sec./higher secondaryCategoryP. onlyP + UPP+sec/hsU.P. onlyUP+sec23 153 590 2,433 1,358 21 22 00 0 1 15 26 1 0 0 V girls0 0 0 0 0 0 0 0 VIII boys14 112 187 1,669 1,222 23 48 0 VIII girls31 369 690 1,157 149 0 10 0Regular teachers Para-teachers SC teachers ST teachersTotal Male Female No res Male Female No res Male Female Male Female1373 0 435 287 0 514 261 552 13755275560430Telugu English Oriya122615113187007312451748732607062195172466600273834323283320ANDHRA PRADESH1317110819Primary0000Elementary Education: Report Card - SRIKAKULAM65900567Upper Primary21.1 29.930100000424302130016510Male Female86.2 78.660.0 57.146.9 18.20.0 0.0157 0 216 105 88 17 10.7 8.0% Schools recvd. Incentives : Number of beneficiaries(Previous year)(Previous academic year)School T L Mdev. grant grant Incentive Primary Upper primary88.5 89.4 Type Boys Girls Boys Girls81.4 80.9 Text books 100659 106095 73939 666040.0 0.0 Uniform 3827 4910 6661 147840.0 0.0 Attendance 311 471 2106 163766.0 61.3 Stationery 13034 13374 5635 6000# = not applicable na = not available * Some totals may not match due to no response in classificatory data items281098.3 73.2100.0 63.696.0 64.096.4 61.2%Teachers recvd.in-service training21<strong>Andhra</strong> <strong>Pradesh</strong>


