Annual Report 2006 - BTS
Annual Report 2006 - BTS
Annual Report 2006 - BTS
- No tags were found...

You also want an ePaper? Increase the reach of your titles
YUMPU automatically turns print PDFs into web optimized ePapers that Google loves.
The year in brief• Net turnover during the year increased by 32 percent and amounted to MSEK379.1 (286.1). Adjusted for changes in exchange rates, revenue growth was34 percent.Net turnover per operational unit (%), <strong>2006</strong><strong>BTS</strong> Othermarkets 5 %• Operating profit before amortization on intangible assets (EBITA) increasedby 33 percent to MSEK 67.6 (50.8). Profit after tax increased by 5 percent toMSEK 38.6 (36.8).<strong>BTS</strong> NorthAmerica 65 %<strong>BTS</strong> Europe 30 %• New clients acquired during the year included BBVA, Bank of America, EADS,Exxon Mobil, National Australia Bank, National Semi Conductor and US Cellular.• Two new <strong>BTS</strong> offices were opened in Brussels, Belgium and Chicago, US.• <strong>BTS</strong> acquired all business operations of The Advantage Performance Group(APG) and The Real Learning Company (RLC) during the year.Key Ratios <strong>2006</strong> 2005Net turnover, KSEK 379,097 286,119EBITA, KSEK 67,625 50,766Operating profi t, KSEK 62,355 48,696Profi t before tax, KSEK 61,005 55,058Profi t after tax, KSEK 38,584 36,777EBITA margin, % 18 18Operating margin, % 16 17Profi t margin, % 10 13Operational capital, KSEK 184,008 52,804Return on equity, % 24 27Return on operational capital, % 53 165Solidity at the end of the year, % 45 64Cash fl ow from current operations, KSEK 41,120 37,455Cash fl ow, KSEK -29,091 -9,332Liquid funds at the end of the year, KSEK 72,054 101,145Average number of employees 165 143Number of employees at the end of the year 186 150Net turnover per employee, KSEK 2,298 2,001Net turnover by source of revenue (%), <strong>2006</strong>Seminars 60 %Earnings and dividend per share, SEKSEK3.02.52.01.51.00.50.020022003Earnings per shareOther 6 %2004Licenses 14 %Customization 20 %2005<strong>2006</strong>Dividend per share* The above fi gures have been adjusted by a correctionfactor of 0,3333 due to the split 3:1 in May <strong>2006</strong>.Philadelphia, USA Madrid, Spain Scottsdale, USA
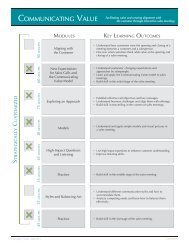
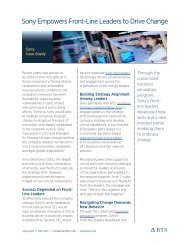
Words from the CEO“Continued profitable growth”<strong>2006</strong> was anothersuccessful year for <strong>BTS</strong>.Revenues grew 32 percentand operating profit28 percent. We doubledour clientbase, salesorganization and portfolioof products and solutions— which gives us a strongposition and a broader basefor further profitable growth.The growth of <strong>BTS</strong> during the last 10 yearshas averaged 16 percent per year, of which14 percent has been organic. During the lastthree years <strong>BTS</strong> growth has averaged 33 percentper year, of which 19 percent has beenorganic. All ten years have included profitablegrowth, and during the last three years theEBIT margin has averaged 16 percent.There are several drivers behind our sustainable,profitable growth:• We operate on a growing market• Our offering has strong competitiveadvantages• We carry out acquisitions well on a fragmentedmarket• Our people are the best in the industry.Globalization and increased competitivepressure drives growth inthe corporate training market…When Cingular and AT&T Wireless integrateas a result of one of the world’s largest mergersever…When Sony Ericsson develops its leadersto be equipped to deliver future, profitablegrowth…When Juniper Networks drives a culturalshift in its 2,000 people worldwide sales forceto evolve with the changing trends in theirmarket…When Norway Post creates a more profitable,business-oriented company prepared forchange………they all decide that investments in thecapabilities and competencies of their peopleare critical to success. This is a developmentand an approach that apply across industriesand geographies; which is why our market isgrowing 5-8 percent per year.…but the traditional methods arelosing market shareTraditional training comes in formats likelectures, power points, binders and groupdiscussions. These can be interesting andstimulating exercises but the necessary resultsare not delivered; the job doesn’t get done. Thejob gets done when the participants, the learners,change their business behavior leading topositive business results.Research shows that such results areachieved when adults learn by doing throughpractical exercises in an environment closelyconnected to their job, while having a cleargoal and motivation to change. The approachof <strong>BTS</strong> works in harmony with these well-researchedprinciples of success.This is why companies like Cingular Wireless,Sony Ericsson, Juniper Networks andNorway Post choose to work with <strong>BTS</strong> to acceleratechange and improve business results.Customers are buying morefrom <strong>BTS</strong>Our value proposition is to develop the mindsetand capabilities your people need to accelerateand improve business results. We make surethis delivers superior results and ROI to ourcustomers through:• Discovery-based solutions – Learning bydoing – the most effective way to learn andchange• In-depth customization – to what is relevantand actionable on the job• A comprehensive process that secures andmeasures the business impact.All our solutions are built on “Learning by Doing”;participants learn through discovery-basedsolutions – via IT-based simulations, manualsimulations, learning maps, EngageMaps – inthe classroom or online.The solutions are customized to eachcustomer’s business and goals. The resultsare secured through a thorough preparation,execution and follow-up process for eachlearner in co-operation with his/her manager.We offer our clients a broad range of solutionscovering business acumen, leadershipand sales. We offer global coverage and arelentless focus on quality and results. Wehave a world-class organization of top-qualitypeople.Our visionWhen <strong>BTS</strong> was founded we set as a visionto become “world leader in business simulations”.We achieved this vision in 2004. Ournew vision includes becoming the World’sLeading Learning & Development Consultancy– innovating how companies change, learn andimprove.4<strong>BTS</strong> <strong>Annual</strong> report <strong>2006</strong>
This vision holds an exciting challenge forus. Based on our position today in terms ofclient base, portfolio of products and solutionsand our people we are convinced that we willachieve it.Organic growth is our baseThe foundation and majority of our growth isorganic – expansion of existing offices, geographicalexpansion in the form of new officesand continuous development of new productsand solutions.During <strong>2006</strong>, revenues from existing officesgrew significantly. We also opened newoffices in Brussels and Chicago and launcheda large number of new solutions and products.<strong>BTS</strong> still has a low market penetration,and we have a strong base for further organicgrowth.Our acquisitions continue to besuccessfulIn recent years, we have also learned that wecan grow successfully in our highly fragmentedmarket place through acquisitions.So far, we have completed five successfulacquisitions:• In January 2002, <strong>BTS</strong> Australia was foundedbased on an acquisition which to date hasgrown fourfold.• In August 2003, <strong>BTS</strong> Spain was foundedbased on an acquisition which to date hasgrown threefold.• In February 2005, SMG in Philadelphia wasacquired. SMG experienced heavy lossesand negative growth before the acquisition.SMG has showed strong margins and somegrowth after the acquisition both in 2005and <strong>2006</strong>; and provided a wealth of intellectualproperty in new products and solutions.• In December 2005, BGF in Helsinki wasacquired. BGF showed losses and negativegrowth in 2005; but it returned to stronggrowth and healthy margins during <strong>2006</strong>.• In September <strong>2006</strong>, The Real LearningCompany (RLC) in Scottsdale, Arizona, andThe Advantage Performance Group (APG)in Tiburon, California, were acquired. DuringQ4 of <strong>2006</strong>, both these companies haveshowed better growth, results and marginsthan after the acquisition.To summarize – these five successfulacquisitions help drive profitable growth andadd new solutions, markets and talent – whichcreates a broader base for continued growth.We plan to continue on this route. Ourmarket place is very fragmented, and there aremany opportunities for attractive acquisitions.<strong>BTS</strong> has a competitive advantage through itstrack-record in well-implemented integrationprocesses, which now increases the number ofopportunities we get exposed to.The acquisitions of APG and RLCThese acquisitions, carried out in the end ofSeptember last year, bring two of the eliteUS companies in our sector – APG and RLC– both renowned for their customer satisfactionand innovation – into the <strong>BTS</strong> family. Thecombination of our organizations creates astronger foundation for continued organicgrowth both in the US market and globally.RLC’s innovative suites of solutions insales and leadership development, combinedwith the <strong>BTS</strong> portfolio, form a complete rangeof solutions within business acumen, leadershipand sales that we can offer to our globalcustomer base.The addition of APG’s more than 200customers, 40 franchise partners – and over100 independent facilitators creates a verystrong market force in the US. APG’s businessmodel based on strong individual incentivesand a high proportion of variable costs is veryattractive.To summarize, there are five main advantageswith these two acquisitions:1. We buy two companies with long, solid trackrecords of profitable growth.2. We add 200 new customers and a highperforming,entrepreneurial sales force.3. We add a large number of new solutionswhich we can sell to <strong>BTS</strong> customers.4. Our combined total offering is broader andmore attractive, which makes it easier for usto gain new customers.5. We welcome a large number of experienced,talented employees.We have already capitalized on all fiveadvantages; earnings in APG and RLC grewsignificantly in Q4, we have closed about tencross-selling deals, the co-operation is workingwell and we are gaining new customers as aresult of our broader offering.Prospects for the futureWe have a long history demonstrating ourcapacity of sustainable organic growth, andin recent years we have also gained experiencefrom successful acquisitions. Our marketcontinues to grow. Our market penetration isstill very low. We are in a stronger position thanever before to deliver value to our customersand compete in the market place.Based on continued strong market conditionsfor <strong>BTS</strong> and the completed acquisitions,the profit before tax for 2007 is expected tobe significantly better than the previous year.Stockholm, March 2007Henrik EkelundPresident & CEO of <strong>BTS</strong> Group AB<strong>BTS</strong> <strong>Annual</strong> report <strong>2006</strong> 5
Vision, mission, value proposition, goals andstrategiesOur Vision:”The World’s LeadingLearning & DevelopmentConsultancy - innovatinghow companies change,learn and improve”Financial goals<strong>BTS</strong>’ financial goals are:• To return annual organic growth innet turnover of at least 25 percent.• To achieve a long-term sustainableoperating margin before amortizationof goodwill of at least 12percent.• To maintain net cash reservesequivalent to at least two month’soperating costs at all times, and toensure that the equity ratio does notfall below 50 percent for extendedperiods.<strong>BTS</strong> Value PropositionWe develop the mindset and capabilities thatyour people need to accelerate change andimprove business results.We make sure this delivers superior resultsand ROI through:• Discovery-based solutions/Learning byDoing – the most effective way to learn andchange• In-depth customization – to what is relevantand actionable on the job• A comprehensive process that secures andmeasures the resultsThe <strong>BTS</strong> Group’s ElevenStrategic Principles1. Focus<strong>BTS</strong> is a learning & development consultancy.Our world-class capability is our focus; tocustomize and deliver discovery-based solutionswhich give our clients superior businessresults and ROI. Every new solution/service wedevelop shall – build on the core competenciesof <strong>BTS</strong>.2. Internationalization<strong>BTS</strong> is a global organization, providing servicesaround the world to a client base of mainlyinternational organizations.3. Organic growth complemented byacquisitions<strong>BTS</strong> grows organically, building on its corecompetencies and customer base. Acquisitionsmust provide major synergies and complementwith new markets, new customer bases andnew areas of expertise/solutions.<strong>BTS</strong> enters new geographies and new areaswith a customer-driven approach – revenuesand customers first, cost second.4. Top clients and long-term partnerships<strong>BTS</strong> clients shall pre-dominantly be high-image/large clients – and the most demanding andprofessional clients.<strong>BTS</strong> establishes long-term partnershipswith clients, built on delivery of top quality& highly visible results and strong customerrelations.By leveraging our portfolio of solutionsand capabilities we build suites of solutionsused throughout our client’s organizations– resulting in a recurring and growing flow ofrevenues – over a long period of time.5. Differentiation – higher value &premium position<strong>BTS</strong>’ services are differentiated throughsuperior business results and ROI. The mostcommon differentiation factors for <strong>BTS</strong> are:• Discovery-based learning• Customization• Results process• Customer intimacy & focus• Great people driven by excellence andquality• Global coverage• Broad range of solutions• Innovation6<strong>BTS</strong> <strong>Annual</strong> report <strong>2006</strong>
6. Offer solutions and IP – not sell time<strong>BTS</strong>’ prices are generally fixed and not set perunit of time.<strong>BTS</strong> capitalizes on its IP (Intellectual Property)– creating recurring revenues and licenserevenues striving to increase their share oftotal sales.7. Network-oriented sales and marketing<strong>BTS</strong> continuously increases the quantity andimproves the quality of resources dedicated toclient contacts and sales. These are key driversof growth for <strong>BTS</strong>.Our priorities:1. Existing clients and account management2. New targets generated through the networkof existing clients3. Qualified new targets that can profit from ourcompetitive advantages8. Value chain – Focus on strategicassets and high value<strong>BTS</strong> owns and sources internally• IP• Customization• Client contacts• High level/critical delivery<strong>BTS</strong> uses independent resources and contractors– to gain access to expertise and for optimalresource planning – in order to maximizequality and productivity.<strong>BTS</strong> builds partnerships in order to get accessto customers and combine capabilities.9. One company – One best practice<strong>BTS</strong> has detailed processes and best practiceexchange to ensure compatible methodsthroughout the Group – leveraging the company’sknowledge and increasing productivity.We deliver well-coordinated and integratedservices across the globe.We combine two approaches:• Create a pull for communication andlearning• Provide a knowledge management systemwith easily accessible information, checklistsand “how to”.10. Innovate! And develop close to thecustomer<strong>BTS</strong> invests in development to cover key needsof our clients and to provide the best solutions.<strong>BTS</strong> develops existing and new solutions injoint projects with clients to secure an effectiveand client-needs driven innovation.11. The people and the company spirit<strong>BTS</strong> professionals are all very visible to theclient and the spirit is a main driver of clientsatisfaction. <strong>BTS</strong> emphasises a positive andprofessional company culture expressed in sixcore values.Recruitment, development and motivation ofour people – creating business-focused highperformers throughout the organization – is akey driver of growth.Our Mission:We partner with our clientsto accelerate change andimprove business results.<strong>BTS</strong> <strong>Annual</strong> report <strong>2006</strong> 7
8<strong>BTS</strong> <strong>Annual</strong> report <strong>2006</strong>
Growth, profitability and acquisitionsContinuous growth<strong>BTS</strong> has delivered profits every year since itsfoundation in 1986. The growth of <strong>BTS</strong> duringthe last 10 tears averages 16 percent peryear, of which 14 percent has been organic.During the last three years, <strong>BTS</strong> growth hasaveraged 33 percent per year, of which 19percent has been organic. The company hasachieved this irrespective of market conditions,and despite substantial costs for acquisitionsand investments in product development andmarket establishment around the world. To alarge degree, this development is based on thedynamic business model and the entrepreneurdrivenorganization.In the late 90’s <strong>BTS</strong> successfully managedto expand its customer base and to build closecustomer relationships. Good market conditions,new product initiatives as well as new offices inthe US, UK, Finland and South Africa played amajor role in the company’s growth during theperiod. When the market conditions worsenedbetween 2001 and 2003, <strong>BTS</strong> managed tomaintain a healthy level of revenues - despitethe unfavourable business climate - throughadhering to its previously established, successfullong-term strategy.New initiativesIn those difficult market conditions between2001 and 2003, <strong>BTS</strong> successfully managedto reinforce the business for future growth andprofitability by implementing a range of newinitiatives:• New tailor-made business simulationswere developed and sold to companiesin four additional industries; financial services,pharmaceuticals & biotechnology,retail & distribution as well as energy.• Expansion to two new markets: Australiaand Spain.• The sales organization was strengthened,as was the collaboration with strategicallyimportant external partners and distributors.• The customer base expanded rapidly.Increasing profi ts<strong>BTS</strong> constantly strives to improve profitability.The changes and initiatives implemented bythe company during the period of consolidationbetween 2001 and 2003 have, in combinationwith increased focus on raising the proportionof revenues from licensing, laid a solid foundationfor growth in revenues and profitability.Targeted acquisitions<strong>BTS</strong> expansion strategy is primarily built on organicgrowth. The company’s acquisition strategyhas strengthened its position even further.<strong>BTS</strong> strategy for acquisitions aims to create abroader base for future organic growth, whileat the same time actively consolidating a highly-fragmentedmarket and gaining opportunitiesto serve both existing and new customerswith value-adding products and services.During 2002 and 2003, the company hasmade a number of targeted, smaller acquisitionsin different countries. They have all contributedpositively to <strong>BTS</strong> consistent growthand strong financial results.Acquisitions 2005 and <strong>2006</strong>During the last two years, <strong>BTS</strong> has acquiredThe Strategic Management Group LearningSolutions (SMG, US, 2005), Business GameFactory (BGF, Finland, 2005), The AdvantagePerformance Group (APG, US, <strong>2006</strong>) and TheReal Learning Company (RLC, US, <strong>2006</strong>).These acquisitions have strengthened thecompany in several ways:• By expanding in areas such as Leadership,Sales (the world’s second largest trainingmarket after IT), and Operational Excellence,<strong>BTS</strong> has broadend its offering to clients aswell as made the company less sensitive tofluctuations in the business climate.• The new companies within the Group haveadded new training-related technologiesand delivery methods.• The acquisitions have significantly broadenedthe customer base.• A wealth of new talent has been added.As a result, <strong>BTS</strong> now is a more completecompany with a strong foundation to reachits vision - “The World’s Leading Learning &Development Consultancy - innovating howcompanies change, learn and improve”.<strong>BTS</strong> has delivered profitsevery year since itsfoundation. Growth hasaveraged 16 percent thelast 10 years, of which14 percent has beenorganic. Acquisitions havebuilt synergies with newsolutions, new markets andnew talents and helped todrive growth.Five successful acquisitions2002<strong>BTS</strong> Australia founded through acquisition2003<strong>BTS</strong> Spain founded through acquisition2005Acquisition of SMG, Philadelphia, US2005Business Game Factory, Helsinki,Finland<strong>2006</strong>Acquisition of The Real LearningCompany, Scottsdale, Arizona andAdvantage Performance Group Tiburon,California<strong>BTS</strong> <strong>Annual</strong> report <strong>2006</strong> 9
Business modelThe foundation of <strong>BTS</strong>’successful growth andprofitability rests on qualityfocus, long-term customerrelationships and networkbasedmarketing.2.A business unit implementsa new strategy.1.The initial project typicallyinvolves 25-50 high levelexecutives.3.A subsidiary in adifferent countryimplements thestrategy.Growth4.A larger group ofthe employees need tounderstand and learnhow to applythe new strategy.<strong>BTS</strong> builds relationships atdifferent levels in the clients’organizations. Through theserelationships new projects arecontinuously generated.Long-term customer relationshipsThe foundation for growth lies in <strong>BTS</strong>’ ability tocreate long-lasting customer relationships atdifferent levels in the client organization.An initial <strong>BTS</strong> customer assignment is oftendesigned for and implemented with the clientcompany’s senior executives and key employees.This customization process is carried outin close co-operation with the client.Outstanding results, well over clients’expectations, of an initial project often leads toa second phase during which the client asksfor customized solutions for broader groupsof managers and employees at different levelsthroughout the organization.<strong>BTS</strong>CUSTOMERPOTENTIALCUSTOMERPOTENTIALCUSTOMERNetwork-based marketing<strong>BTS</strong> employs a network-based marketingapproach covering a number of selected industries.The most important way of maintainingvaluable customer relationships is by buildinga network consisting of people who have completedone or more of <strong>BTS</strong> business programs.This network, made up of both those whomake strategic decisions about training andthose who actually purchase solutions, helpsgenerate opportunities for new assignmentsand customers.When <strong>BTS</strong> approaches a new industry, itinitially focuses on a few leading corporations.Once assignments are completed for thesecompanies, they will serve as reputation-boostingreference projects for new sales to otherorganizations in the same industry.POTENTIALCUSTOMER<strong>BTS</strong> values its customer relations.Participants in the company’sbusiness programs are importantfuture customers. New commissionsoften result from formercourse participants changing jobsor companies and calling on <strong>BTS</strong>from their new position.10<strong>BTS</strong> <strong>Annual</strong> report <strong>2006</strong>
Multi-market expansion with limited risk<strong>BTS</strong> continouosly expands its business operationsto new markets around the world. <strong>BTS</strong>works with multinational clients and implementsprojects in a large number of countries– without necessarily having an establishedlocal office in every market.Existing customer relationships make upthe foundation when <strong>BTS</strong> starts up operationsin a new market; a fact which reduces theexpansion risk. In addition, <strong>BTS</strong> works hard tonurture relationships with other large corporationsactive in the targeted markets.Once business has grown to sufficient volumesin a new market and the future potentialappears attractive, <strong>BTS</strong> can take a logical stepand open up a new, local office.Acquisition strategy<strong>BTS</strong>’ growth strategy is primarily built onorganic growth. Over the past few years thecompany has made a number of acquisitions indifferent countries.<strong>BTS</strong>’ strategy for acquisitions is built oncreating a broader base for future organicgrowth while at the same time actively consolidatinga highly-fragmented market. The goalis to offer more services to both existing andnew customers. All acquisitions have resultedin cross-selling. This is a result of consciousefforts to identify new business opportunitiesbased on needs within the extended customerbase. The training of account managers as wellas needs-focused discussions with individualclients has played an important role in thisprocess.Efficient customizationsIn collaboration with customers, <strong>BTS</strong> customizesboth the content and the form of its businessprograms. The company has successfullyimproved its profitability by increasing theefficiency of the customization process. Thisimprovement is a result of advancements andfine-tuning of development methods as well asincreased reuse of previous development work.When <strong>BTS</strong> develops solutions for corporationsin new industries, the cost for customizationinitially rise. With the later reuse ofexperience and skills, however, these costssubsequently fall.Seminars — the majority of revenuesInstructor-led seminars still comprise the greatestsource of revenue for <strong>BTS</strong> and are thedominant form of business delivery. The <strong>BTS</strong>consultants are very much involved throughoutthe whole customization process, and, duringdelivery, they facilitate these solutions inseminars.Increased licensing revenue<strong>BTS</strong> also delivers its solutions via web, CD-ROM or as manual board solutions. The goalis to increase revenue streams from licenses.License-based business simulations are veryefficient learning tools for customers — theymake it possible to reach large groups of employeesin organizations, all over the world andat all levels. At the same time, it is a profitableline for <strong>BTS</strong>.Net turnover by source of revenueOther 6 %Licenses 14 %Customizations 20 %Seminars 60 %Revenue mixDeveloping the revenue mix<strong>BTS</strong> revenues originate from three areas:• Customizations• Instructor-led seminars• Licences<strong>BTS</strong> works continuously to develop and combinedifferent methods of training delivery toensure optimal, value-added customer benefits,and at the same time strengthen it own revenuestreams and profitability.<strong>BTS</strong> <strong>Annual</strong> report <strong>2006</strong> 11
Customers<strong>BTS</strong> has been showngreat confidence from asubstantial number of thelargest companies in theworld. As customers’ needsfor change increase and<strong>BTS</strong> continues to developnew solutions, the companystrengthens its relationswith existing customers andattracts new ones.Some examples of <strong>BTS</strong>customers are:AccentureAOLAstraZenecaBASFBoeingCiscoCoca-ColaCarlsbergEricssonGEHoneywellIBMJuniperMaerskMerckValuable client baseLargest companies in the world<strong>BTS</strong> is the world leader on the market fortailor-made simulations centered on businessacumen and strategic corporate management.At present, <strong>BTS</strong> has about 400 activecustomers. More than 25 of the world’s largestcompanies measured in market capitalizationare customers of <strong>BTS</strong>.Newcustomers20 %Existingcustomers80 %About 80 percent of annual revenues typicallycome from customers with whom <strong>BTS</strong> has workedduring the previous years. Today, typical customerrelationships range from 6 to 8 years - some timeseven longer.Important customer relationships<strong>BTS</strong> primarily targets globally active companiesthat employ a large number of people.<strong>BTS</strong> sees great potential in growing withexisting customers. The constant change pressurecreates continuous demand for businesstraining in areas related to strategy execution- in almost all industries worldwide. <strong>BTS</strong> seesconsiderable potential in its existing client baseand expects demand to remain strong in thefuture.Global customers in several sectors<strong>BTS</strong> has built strong market positions withinseven industries. During the 1990s, the companygrew rapidly in manufacturing, telecomand information technology - with major globalcustomers such as Philips, Ericsson and HP as<strong>BTS</strong> customers.During the period of poor market conditionsin the early 2000s, <strong>BTS</strong> expanded its positionsby entering four additional industries; financialservices, pharmaceuticals & biotechnology,retail & distribution, as well as energy. In thisunfavourable business climate, <strong>BTS</strong> succeededin adding multinationals such as Barclays,Honda and Centrica to its client list. In the lastcouple of years, <strong>BTS</strong> has grown quickly in theFast Moving Consumer Product and Servicesectors.12<strong>BTS</strong> <strong>Annual</strong> report <strong>2006</strong>
IT Telecom FinancialServicesPharmaceuticals &BiotechnologyRetail &DistributionManufacturing Energy OtherCisco Ericsson BBVA Astra Zeneca Federated Boeing Schlumberger MaerskIBMTelstraCorporationNorway Post Roche Paperlinx Weyerhaeuser Vattenfall AOLMicrosoft Nokia Bank of America Merck Schneider PhilipsExamples of <strong>BTS</strong>’ customers in different sectorsRevenue source per sector, % of total, <strong>2006</strong>Other 20 %Manufacturing 22 %Telecom 14 %Pharmaceuticals & Biotechnology 5 %Retail & Logistics 6 %Energy 7 %IT 14 %Financial Services 12 %The pie chart shows revenue distribution between different sectors in <strong>2006</strong>. The importance of sectorssuch as Financial Services, Pharmaceuticals & Biotechnology, Retail & Distribution and Energy hasbeen increased through conscious diversifi cation. The “Other” category includes candidates for <strong>BTS</strong>’new growth sectors.MicrosoftNokiaPhilipsNorway PostRocheSanitasSchlumbergerSonySonyEricssonTelstra CorporationTexas InstrumentsToyotaVattenfallWeyerhaeuserXerox<strong>BTS</strong> <strong>Annual</strong> report <strong>2006</strong> 13
Customer casesWhy should a company buy from <strong>BTS</strong>?1. A MAJOR MERGER America’s largest wireless company has partnered with <strong>BTS</strong>around the project “Getting to Great”, which is a mergerCingular & AT&T Wirelessintegration initiative for Cingular’s management team. Theproject objective is to align management behind the commonHow do we align the merging companies andstrategies, goals and execution capabilities of the merged“ execute faster to achieve the synergies?”company. <strong>BTS</strong> have covered the top 1,200 executives andthe mid 7,000 managers and the remaining organizationthrough e-learning.2. A NEW BUSINESS STRATEGY A global forest products company reinvents itself during thepast five years and partners with <strong>BTS</strong> for strategic alignment& buy-in to the new CEO’s corporate strategy – The Roadmapfor Success, with many new key initiatives.WeyerhaeuserHow do we get the organization behind our“ strategy – working in the same direction?”3. TO GENUINELY UNDERSTAND OUR CUSTOMERS One of the leading manufacturers of automobiles and theleading manufacturer of motorcycles in the world. <strong>BTS</strong> hasHondaprovided a unique car dealership simulation to 350 Hondasales consultants entitled “walking a mile in your customer’sshoes”. It gives the participants strong AHA’s of what drivesthe success of its customers — through an “inside experience”.How can we give all our key people a backbone“ understanding of what drives the success of ourcustomers?”4. TO TRULY CHANGE A BUSINESSNorway PostHow do we change to a new business“ strategy, operation and culture?”The background for the changes was a decline in the volumeof letters, ongoing deregulation of the postal market, internationalizationand an increase in competition. Therefore, atailor made training initiative was implemented for 125 seniormanagers, 250 middle managers and 950 first line managers.“We built simulations designed to prepare our managers forthe change of behavior required,” says Kaare Frydenberg,former President of Norway Post.5. ENHANCING BUSINESS ACUMENCiscoHow do we develop the three pillars of“ business acumen; applying drivers of profitand value, a market-oriented approachand a helicopter view of the business?”<strong>BTS</strong> has developed and implemented a customized business simulationfor 450 managers from the global Cisco organization to developthe business acumen of the managers. The program is a part ofCisco’s “Business Leadership Program”.14<strong>BTS</strong> <strong>Annual</strong> report <strong>2006</strong>
We partner with our clients to acceleratechange and improve business results. Inglobal companies all over the world, <strong>BTS</strong>’ trainingsolutions are an integral part of the client’smost important strategic change projects.6. DEVELOPING MORE EFFECTIVE LEADERS One of the largest department store companies in the UnitedStates – it owns both Macy’s and Bloomingdales. <strong>BTS</strong>Federated Department Stores (Macy’s, Bloomingdaledeveloped and implemented a leadership program involvingand more)tailor-made business simulations to reinforce managers’ understandingof how business and leadership decisions impactresults and competitiveness.“How do we truly enhance our capability to leadand manage with better business results?”7. IMPLEMENTING STRATEGIES A world leader in natural gas, where <strong>BTS</strong> supports executivemanagement in corporate change processes and theBG Groupimplementation of new strategies with the objective to createa more successful and profitable company through real life,tailor made business simulations.“How do we implement new strategies in a successfuland profitable way?”8. A SENIOR EXECUTIVE DEVELOPMENT PROGRAM A global manufacturing and service company, where <strong>BTS</strong> isa partner in the development and delivery of a business acumensimulation as part of its Senior Executive DevelopmentTyco InternationalProgram. The leadership initiative targets the company’s topexecutives.How do our Senior Executives excel in“ business acumen?”9. DEVELOPING A WORLD CLASS SALES FORCE Juniper Networks partnered with <strong>BTS</strong> to drive a cultural shift thoughtheir 2,000 world-wide sales force to be more effective in today’smarket place. The initiative has led to the winning of significantamounts of new business.Juniper NetworksHow do our sales people win more deals and“ more profitable deals?”10. DEVELOPING EFFECTIVE BUSINESS STRATEGIES <strong>BTS</strong> has developed a program for the 200 most senior executivesat Centrica, UK’s largest company in the field of energyCentricaand service for households. The objective was to deployManaging for Value (MfV) to all areas of Centrica through theHow can we improve the capacity to developpractical application of MfV theories, tools and methods, and“ effective business strategies?”improving the capacity of the senior executives to developbusiness strategies.11. IMPROVING OPERATIONS The largest retailer of mobile communications solutions in Europe.The Carphone Warehouse Group<strong>BTS</strong> has delivered board simulations to increase insightinto how an improved stock management strategy would affectthe company. A direct result of this project is that more thanHow can we improve profit and cash flow300 separate measures were introduced to improve profitability.“ through better stock management?”<strong>BTS</strong> <strong>Annual</strong> report <strong>2006</strong> 15
TrainingcompaniesManagementconsultants<strong>BTS</strong>Technology-basedtraining<strong>BTS</strong>’ solutions meet the needs ina profi table business niche in themarket by combining expertisefrom different areas such asManagement Consulting, Trainingcompanies and Technology-Based Training.Intangible assetsHuman & organizational capital<strong>BTS</strong>’ solutions help global corporations maintainand increase the value of their intangibleassets in the form of human and organizationalcapital.Accenture calculates that the value ofintangible assets have increased from 20 percentof the value of companies in the S&P 500in 1980 to around 70 percent today 1 .The best way to support this developmentis by capitalizing on, and investing in, intangibleassets:• Human capital such as skills, training andknowledge• Organizational capital such as corporate culture,leadership, an aligned business strategyand teamworkIn addition, an Accenture/The EconomistIntelligence Unit study 2 confirms that today’ssenior executives see managing intangibleassets as a major issue: 94 percent considerthe comprehensive management of intangibleassets important; 50 percent consider it one ofthe top three management issues facing theircompany.Global war for talentGlobalization and the growth of corporationsrequire a growing number of well-educated,multifaceted individuals capable of competingin a multinational marketplace. But since thesize of the available talent pool is shrinking,this development has resulted in the “globalwar for talent”.As a result, it is becoming ever more importantto keep managers and employees at alllevels engaged and motivated – both intellectuallyand emotionally – when it comes to howthey view their strategic and operational rolesin their organizations.In the US and in the major Europeaneconomies, the retirement of baby boomersmeans that companies will lose large numberof experienced workers over the nextdecade. Consequently, corporations will haveto compete for young job candidates, learn tofind and manage new sources of talent as wellas train new employees as soon as they havehired them.Many knowledge workersAs “knowledge workers” now represent a largeand growing percentage of the employees ofthe world’s biggest corporations, we will seegrowing needs to meet their business-trainingdemands.According to McKinsey, 3 professional employees,or knowledge workers, now constituteup to 25 percent or more of the workforcein financial services, health care, high-tech,pharmaceuticals as well as media and entertainment.Knowledge workers are companies’most valuable employees, which makes itespecially important for organizations to keepthem engaged.1 Accenture´s Outlook Journal, Getting a Truer Picture of Shareholder Value, June 2005.2 Accenture’s Outlook Journal, Future Value: The 7 USD Trillion Challenge, February 2004.3 The McKinsey Quarterly, The 21st-Century Organization, 2005, No 3.<strong>BTS</strong> <strong>Annual</strong> report <strong>2006</strong> 17
Discovery-basedsolutions5%10%20%30%50%75%LectureReadingAudio/VisualDemonstrationDiscussion GroupPractice by Doing80%Teach OthersSource: National Training LaboratoriesThe percentage of knowledge retained varies according to learning methodused. Discovery-based learning such as simulations, “Learning Maps” and“EngageMaps” are included in the “Practice by Doing” category.Source: The Learning Pyramid, from Corporate Universities, Jeanne MeisterGrowth patternIndustry similarities<strong>BTS</strong>’ sector is following a development patternsimilar to how the management-consultingindustry grew in the 1980s and 1990s.Actually, the same set of factors that hasshaped how the management-consulting industryhas developed during the last 20 yearshas contributed to the rapid growth of <strong>BTS</strong>.Firstly, the complexity of today’s businessenvironment has increased the need for externalconsulting expertise to manage necessarychange projects.Secondly, because of corporate downsizingmany companies lack the internal humanresources to complete all necessary tasks.Thirdly, just like leading management-consultingfirms, <strong>BTS</strong> has been able to expandworldwide by working with global corporationsin various industries.Value of simulation learningKnowledge retentionBusiness training through customized, discovery-basedsolutions such as simulations,EngageMaps and learning maps are superiorcompared to conventional training as regardsboth efficiency and end results. This explainswhy clients in <strong>BTS</strong>’s target group increasinglychoose solutions of this kind.Research shows that learning by doingleads to greater knowledge retention thanother learning methods.“Wise” decision makersWithin this context, an organization’s learningstrategy must extend beyond merely buildingknowledge. It must be directed towards developingpeople who make “wise” decisions. A keystep in this process is gaining new experience.Customized, discovery-based solutions – suchas the ones <strong>BTS</strong> offers – provide for all this. 1Greater understandingIn addition, research suggests that discoverybasedlearning such as business simulationshave the ability to create “microworlds” inwhich participants gain a better understandingof, not only individual effects of decisions ona company, but also of the interactive effectsof environment, competitors in the sector andemployees – all within a simulated experience.Business simulations constitute a learning anddevelopment process which contribute towardscreating a more aligned business strategy andsuccessful strategy execution. 218<strong>BTS</strong> <strong>Annual</strong> report <strong>2006</strong>1 Jeremy J. Hall, Corporate Cartooning – The Art and Science of Computerized Business Simulation, 2001.2 Jonathan R. Anderson, The Relationship Between Student Perceptions of Team Dynamics and Simulation Game Outcomes:An Individual-Level Analysis, 2005.
Market developmentMore business trainingAccording to IDC, the premier global marketintelligence firm, the market for “corporatetraining in business skills” was forecasted togrow at an annual rate of 8.1 percent during2004-2009 1 . Various market research anticipategrowth of 5 – 8 percent per year.Based on <strong>BTS</strong>’ worldwide experience, thecompany believes that the market segmentfor business training based on simulations willgrow more rapidly than the market in general.Large multinationals, the organizationsthat make up <strong>BTS</strong>’ target group, tend tohave to deal with a faster rate of change,more extensive use of new technologies andincreased competition compared to other typesof organizations. The market for <strong>BTS</strong>’ solutionsshowed significant growth during <strong>2006</strong> – atrend expected to continue in 2007.In the US, demand remains high for training-relatedservices that support corporatechange implementation, strategy execution andprofit improvements. The markets of Europe,Australia, South Africa and East Asia alsoshow growing demand.US leads the wayThe US is still the business-training leader dueto the sheer size of its home market and thehomogenity of its business community, and anadvanced approach on how to optimize investmentsin business training. US companiesmake up a global force in the business world.According to the Fortune Global 500 Rankingsin <strong>2006</strong>, 60 percent of the world’s largestcorporations are American.English is the global business language.Similarly, the leading management models andbusiness schools are American. Accordingto the Financial Times Global MBA Rankings<strong>2006</strong>, eight of the ten top business schools inthe world are American.Other market trendsIn its 2005 report, IDC highlights a number ofadditional business-training trends that <strong>BTS</strong>considers important to the company’s developmentsuch as:• Global solutions: Corporations need trainingsolutions that can cover the complete scopeof their international activities. Similarly, theyalso want the option of running courses inmultiple languages.• Technology-based training: Globalizationalso drives need for flexibility and costefficiency. As a result, technology-basedsolutions play an increasingly important rolein business training. Multinationals wanttechnology-based programs that make useof the internet, intranets and CD-ROMs.• Total solutions: Increasingly, corporationslook for training companies to take totalholistic responsibility for solutions. This includesneeds analysis, content development,delivery, technology as well as qualitativefollow-up.• Measurable impact: Customers want to followup on results from training programs tosee how they contribute to the achievementof stated business goals. More and morecompanies ask providers to explain how thetraining is worth the money spent – Returnon Investment (ROI).US corporate training market 2005-2009USD billion963020042005Classroom-basedTechnology-basedText-based<strong>2006</strong>200720082009According to IDC, an American market analysiscompany, there is still growth potential for alldifferent types of training: classroom-based,technology-based and text-based.Source: IDC, US Corporate Business SkillsTraining, 2004-2009: Forecast and analysis.Classroom-based Technology-based Text-basedInstructor-led CD-ROM TextbooksWorkshops Interactive videos e-booksLaboratory work DVD, VHS Reference documentse-learningManualsThe various forms of delivery for business training.1 IDC, US Corporate Business Skills Training 2005-2009: Forecast and analysis.<strong>BTS</strong> <strong>Annual</strong> report <strong>2006</strong> 19
Fragmented competitionDivided marketThe figure below shows that competition in<strong>BTS</strong>’ market is fragmented with a wide varietyof competing players.The most important ones are businesssimulation specialists, e-learning companies,managements consultants, training companies,internal training units and businessschools.As the world-leading provider of simulationsand other discovery-based solutions,<strong>BTS</strong> continues to capture market shares fromother players.<strong>BTS</strong> is the most effective partner to assistcompanies to implement changes that will contributetowards profitable strategy execution.CollaborationAn increasing number of companies take along-term view on employee business-skillsdevelopment. This results in greater coordinationand the investment in holistic solutions.This, in turn, leads to increased collaborationamong suppliers and consolidationthrough mergers and acquisitions. Forexample, <strong>BTS</strong> has, during the last few years,acquired a number of complementary firms tobroaden and strengthen its offering and clientbase worldwide.ManagementconsultantsE-learningcompaniesTrainingcompaniesThe market forcorporate trainingThe corporate trainingmarket comprises alarge number of differentplayers.BusinesssimulationspecialistsInternaltrainingunitsBusinessschools20<strong>BTS</strong> <strong>Annual</strong> report <strong>2006</strong>
Development & positionSteady development<strong>BTS</strong> has developed progressively from itsestablishment in the mid-1980s as a companyfocusing on business simulations in theNordic market.In the 1990s, the company built a broadrange of customized business training solutionsbased on simulations by using new technologiesto help companies implement changeprocesses and improve business results.<strong>BTS</strong> has now developed into a truly globalplayer that successfully helps with strategyexecution and performance improvementactions in a large number of multinationalcorporations in more than 50 countriesworld-wide. The company has customers inManufacturing, Telecom, IT, Financial Services,Pharmaceuticals & Biotechnology, Retail &Distribution and Energy.The <strong>BTS</strong> client list speaks for itself: morethan 25 of the 100 largest companies inthe world measured in market capitalization– including General Electric, Toyota, Microsoft,IBM and Vodafone – are customers.From a local training company to a globalstrategic partnerTechnology focus -on business simulationContent focus -on change processes andresult improvementsPartner in strategicchange processesSuccess factorsA holistic learning and development approachrequires mixed content and complementarydelivery models at different levels throughoutglobal organizations.Through an extensive use of new technologiesand methods, <strong>BTS</strong> manages to addressthe client companies’ need to strengthenreadiness for change, alignment and strategyexecution.As <strong>BTS</strong>’ documented track record shows,its learning and development solutions deliverresults. The company’s main success factorsthat explain its growing market share are:• Acknowledged success in the US markethas created unparallel credibility• Unique, customized design process ofdiscovery-based business simulations thatemphasizes relevant, work-related actions• A comprehensive process that secures andmeasures ROI outcome• Proven, highly efficient sales model• Excellent customer retention record• The organization has the best people in theindustry.Since the start in 1986, <strong>BTS</strong>has developed from a technologyfocused provider of businesssimulations to a partner instrategic change processes.HISTORY1986<strong>BTS</strong> is founded in Stockholm, Sweden.1992The internationalization begins,subsidiaries are established in theUnited Kingdom and United States.1997<strong>BTS</strong> launches the company’s firstboard-based simulations.1999<strong>BTS</strong> develops business simulations forweb-based delivery. Offices in Finland,South Africa and a second office in theUnited States.2000The company introduces tailor-madebusiness simulations to customerswithin three industries: manufacturing,telecom and information technology.2001<strong>BTS</strong> is listed on the O-list of theStockholm Stock Exchange.2002The company introduces tailor-madebusiness simulations to customersin four additional industries:financial services, pharmaceuticals& biotechnology, retail & distributionand energy.2002<strong>BTS</strong> acquires an Australian office.2003<strong>BTS</strong> acquires the Spanish companyI-Simco with two offices in Spain.2004-2005<strong>BTS</strong> takes a large leap forwardconcerning licensing of some of itstechnology-based business-simulationsolutions. <strong>BTS</strong> acquires the UScompany The Strategic ManagementGroup Learning Solutions (SMG) andthe Finnish company Business GameFactory (BFG). The company opens anoffice in China as well as its secondoffice in Australia.1980´s 1990´s 2000´s<strong>BTS</strong> <strong>Annual</strong> report <strong>2006</strong> 21
<strong>BTS</strong> solutionsThe <strong>BTS</strong> mission is topartner with its clientsto accelerate changeand improve results. <strong>BTS</strong>constantly develops newsolutions together withour customers. As a result,<strong>BTS</strong>’ portfolio of solutionsaccurately reflect thechallenges faced by globalbusiness today.Broad range of solutionsBusiness Acumen ExcellenceEvery manager and employee in a companyneeds a clear picture of how their decisionsand performance affect the company’s results.The solutions in the field of business acumenprovide:• a thorough understanding of what drives thecompany’s financial results,• a market-oriented perspective - how we canwin customers and how we can becomestronger than our competitors,• a holistic view of the company’s businessand how the various units best interact, in apractical and applicable manner, which leadsto better decisions.Sales, Sales Management & Sales ManagementExcellenceCustomers today are increasingly looking forsales organizations to bring them value ratherthan products or solutions. The bottom line:the most successful sales organizations in theworld are helping their customers acceleratetheir business results not just solve businessproblems. In order to meet this customer expectation,sales organizations must understand:• their customer’s customer• the underlying factors that drive the successof the customer’s business,• the customer’s business models and profitabilityfactors,• the value proposition the company offers, balancedagainst customer needs and requests• the profitability impact balanced with fixedand variable costs and value based pricingmodels.<strong>BTS</strong> solutions support all phases of thecustomer buying process and begin with firstseeking to understand your customer beforecreating and communicating the value yourproducts, services, and offerings can deliver foreach customer’s unique needs.Operational ExcellenceGlobal presence and sourcing are putting newdemands on the ways companies need toorganize and work. To do things in a right andan efficient way, sharing best practices andrespecting dead-lines from different functionalperspectives, are today keys in order toexcel. This is valid from various perspectives;managing a product portfolio, optimizing thesupply chain, and improving speed from orderto payments.Leadership ExcellenceGreat results-oriented leadership is essentialfor maximizing performance in every organization.<strong>BTS</strong> leadership solutions are tailored tothe unique challenges and strategic initiativesthat exist within our customer’s businesses.The solutions themselves connect theskills and behaviors necessary to inspire andexecute peak performance to a company’sstrategy, key metrics and profitability, as well asits guiding principles, culture, and values.Engage for Change — E4CAll <strong>BTS</strong> solutions are set to drive change.There are, however, specific aspects to changethat require specific attention. <strong>BTS</strong> solutionsfor Change and Execution are specificallyaimed at deap-diving into the area of changeand transformation, getting people to understandWHY change is necessary, and HOWthat will impact the business, and WHAT theyindividually have to do to keep the company’sdirection. <strong>BTS</strong> has an effective results processthat secures and measures Return onInvestment (ROI), by linking business goals toprogram design, learning, and applications.22<strong>BTS</strong> <strong>Annual</strong> report <strong>2006</strong>
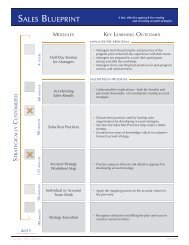
<strong>BTS</strong> SOLUTIONSBusiness AcumenExcellenceSales & MarketingExcellenceOperationalExcellenceLeadershipExcellenceBuilding BusinessAcumenCustomer LoyaltyBest PracticeImplementationGetting to GreatStrategy ExecutionCustomer UnderstandingTime to MarketEssentials ofBusiness LeadershipProfit ImprovementSolution &Value-based SellingTime to CustomerProject LeadershipFinancial AcumenSales EfficiencyProduction FlowLeadership &Business AcumenKnow the BusinessWinning Major Sales”ENGAGE FOR CHANGE”<strong>BTS</strong> offers a broad portfolio of solutions to satisfy the most important areas in executive management and development. BusinessAcumen (Business Acumen Excellence), Sales (Sales & Marketing), “Operational Excellence”, and Leadership development (LeadershipExcellence). A common need for strategic change work and corporate devlopment is to create the capacity to drive the work in away that ensures an impact in the organization. <strong>BTS</strong>’ solutions with “Engage for Change” are focused on this.<strong>BTS</strong> <strong>Annual</strong> report <strong>2006</strong> 23
How <strong>BTS</strong> operates<strong>BTS</strong> employs a numberof delivery models. Acombination of mediato reach different targetgroups provides customerswith the flexibility to choosehow, when and where toconduct training initiatives.This gives the customer theopportunity to obtain thebest delivery formats for theneeds in question.Discovery Based Learning – Core to the <strong>BTS</strong> Value Proposition<strong>BTS</strong> is passionate about delivering measurable results. In order to achieve the results are customersask us to deliver, we focus as much on HOW people learn as on WHAT they learn. All trainingsolutions within the <strong>BTS</strong> Group are built around contemporary adult learning principles. Thisaccelerates the learning, increases retention and actually makes the learning more fun and interesting.There are a few fundamental principles that pervade the various delivery methodologieswhich are described below :• Self-discovery – It is important that participants learn through structured processes andexposure to models but ultimately, they need to come to their own conclusions because thoseare the ones they will ultimately act upon.• Relevance – The work must focus on the participants and their businesses. Case studies, jobdescriptions, performance challenges and goals and contemporary customer research must allreflect their day-to-day environment.• Small Group Experience – This produces more discussion and greater involvement, resultingin richer learning and better retention.• Dialog Rich – The knowledge and experience of the participants is valued and through dialogue,”ahas” are engineered and moved into long-term memory.Customized business simulations1. Computer-based business simulationsare dynamic, which means that the experienceand results they present take into account thedecisions and actions of all the participantsThese simulations are primarily implementedin the form of instructor-led seminars for20-30 executive-level participants, and use asimulation program installed on local computers.Participants work in teams that competedirectly with each other. The simulationprogram reflects the situation participants areto be trained to deal with. Together, participantsface a range of relevant business situationsin which they have to make decisions whichthen influence how the simulation progresses.The simulation is combined with instructor-leddiscussions and feedback.2. Web-based business simulationsare numerical or scenario-based which leadparticipants through a series of situations tolearn a desired outcome. These simulations areconducted via the internet or the customer’sinternal network, with or without <strong>BTS</strong> participation.Web-based simulations can be comparedto a computer game in which the user interactswith a program that <strong>BTS</strong> has developed torepresent different, customer-specific businesssituations. The underlying program leadsusers to make decisions that move themforward through the process. Participantsreceive feedback on the decisions they makein the program. Web-based simulations can becomplemented by instructor-led instruction andfeedback.24<strong>BTS</strong> <strong>Annual</strong> report <strong>2006</strong>
Manual Simulations, EngageMaps and Learning MapsMany companies have taken advantage of <strong>BTS</strong>’ solutions in order to assist with communicatingand establishing strategic initiatives in their organizations. Various types of manual businesssimulations are important tools for this. Real Learning Company has strengthened and complemented<strong>BTS</strong>’ value proposition for supporting companies with change processes during <strong>2006</strong>.Learning Maps are a new element that was added via Real Learning Company.3 a) Board-based simulations — are carriedout using printed materials, most oftenwith the customer’s own staff acting as instructors.Board-based simulations are gamesthat represent a company’s operations andsimulate its business. Participation in the gameimparts understanding among employees ofhow different decisions impact the company’searnings and how the different parts of thecompany should collaborate to achieve thegoals.3 b) EngageMaps — Engage large numbersof Executives, Managers, and Employees inexperiencing the reasons for and the implicationof change. It assists participants in makingthe transition into the Organization’s new environmentand to try out new behaviors. Throughjointly developed pre-designed formats, theparticipants experience the important challengesconcerning their organization’s changeprocess. The learning and new behaviors canbe immediately exhibited in the actual workenvironment. EngageMaps have proven to significantlyboost learning and motivation to act.3 c) Learning Maps – employs much of thesame methodology reflected in the Engage-Map process. Using Learning Maps (boards),manipulatives, and customized research, casestudies participants are able to learn and applythe new skills necessary to accelerate businessresults.Business tournaments and CD-ROM solutionsGeneral business simulations<strong>BTS</strong> also develops business simulations that are more generally applicable than customerspecificsolutions. These “best-practice” simulations highlight various subjects such as leadership,project management, sales and process improvements. They, too, are based on differenttechnologies:4. Open web-based business tournamentsare dynamic simulations conductedvia the internet. Various companies participatein these open tournaments. Participantsengage in 15 to 20 hours of competition overabout 10 weeks. Teams of 3 to 5 participantscompete with one another with the goal ofenhancing their business acumen.5. CD-ROM-based simulation solutionscontain scenario-driven business simulationsfocused on areas of leadership, projectmanagement and sales, and are intendedfor all management levels in a company.CD-ROM-based simulation solutions can beused for individual study or as a supplement tocustomer-specific training courses.<strong>BTS</strong> <strong>Annual</strong> report <strong>2006</strong> 25
<strong>BTS</strong> core values<strong>BTS</strong> invests in itsemployees to drive growthand profitability. <strong>BTS</strong>also achieves success inrecruiting and developingthe best and most engagedemployees.<strong>BTS</strong> Core ValuesPositive Spirit and Fun—We believe that a “can do” attitude and humorenhance a successful business.—We believe in looking at problems openly, andview them as opportunities.—We strive to maintain a good spirit.Honesty and Integrity—We believe in being loyal to those who arenot present.—We believe in giving and receiving feedbackconstructively.—We believe in treating people as equals andin respecting others’ differences.Opportunities Based on Merits—We reward and provide people with opportunitiesbased on results and competencies.—We make decisions and evaluate ideas basedon their facts and merits.—We achieve success through hard and effectivework.Putting the Team First—We believe that <strong>BTS</strong>’ success depends onteamwork and if the team needs support wedo our very best to provide it.—We believe in putting the team first in individualdecisions and in thinking of the individualin team decisions.Lasting Value for Clients and People—We strive to build up long-term relationshipswith our clients to create a legacy for theclient and his staff.—We focus on driving results forward - inlearning, improved behavior and businessperformance.—We encourage the learning, development andrewarding of <strong>BTS</strong> and its staff.—We create our growth through our clients’success and our active business generation.Excellence through Professionalism—We strive to deliver top quality solutions andservices, within deadlines, to exceed clientexpectations.—We balance client and <strong>BTS</strong> competencies,best practices and methods to achieveoptimal results.26<strong>BTS</strong> <strong>Annual</strong> report <strong>2006</strong>
EmployeesRecruiting and career developmentA great place to work<strong>BTS</strong> strives to recruit employees with a proventrack record of qualities and results. <strong>BTS</strong> offersan attractive work environment with numerousdevelopment opportunities through varied andchallenging assignments in an internationalenvironment. The company’s values play acentral role in creating a workplace staffedby motivated employees who constantly striveto deliver top class results. The company alsoprovides competitive compensation packages.Follow-up of results and feedback<strong>BTS</strong> continuously provides follow-up andfeedback to all employees. All employees areassigned a mentor to support them in theircareer development within the company. Uponcompletion of each project, regular evaluationsassess individual contribution in orderto highlight strengths and areas that needimprovement.Broaden and develop competenceMost <strong>BTS</strong> employee competence developmenthappens on customer projects, where employeesare encouraged progressively to take moreand more responsibility. Employees receiveopportunities to develop and expand theirskills on an ongoing basis in combination withspecific training programs centered on projectmanagement, facilitation skills, sales and accountmanagement, and financial modeling andprogramming.New recruitment<strong>BTS</strong> has a precisely defined process for identifyingand attracting new employees with greatdevelopment potential.Employees and acquisition processSuccessful integration requires effective leadership.It is critical that the respective corporatecultures are compatible, and that the employeesfrom the two companies cooperate well.It is essential to make sure early on that thetwo parties share objectives with the integrationand the many business opportunities itpresents. Thus far, <strong>BTS</strong> has been successful inachieving this.<strong>BTS</strong>’ goal is to offer itscustomers the mostcompetent resources onthe market. The companyworks according to anestablished model for buildingan organization staffed bycompetent and committedemployees.New step in the careerThe growth of <strong>BTS</strong> and the expansion of itsservice range provide employees with a greatmany opportunities to develop their careersand take new steps towards greater responsibilityor new assignments. Conversely, thegrowth of the company depends on employeesdeveloping within the organization and thatthe collective competence is maintained andtransferred to newly recruited employees.Key figures,employeesNumber ofemployeesat the endof the yearOf whom,women, %Net turnoverperemployee,KSEK<strong>2006</strong> 2005 2004 2003 2002186 150 107 100 10233 31 23 32 332,298 2,001 1,980 1,672 1,5665 12 3 4New recruitmentNew employeeGreat placeto workFollow-up ofresults andfeedbackBroaden anddevelopcompetenceNew stepin career<strong>BTS</strong>’ model for recruitment and career development.<strong>BTS</strong> <strong>Annual</strong> report <strong>2006</strong> 27
Strategic acquisitionsDuring <strong>2006</strong>, the <strong>BTS</strong>Group acquired thetwo US companies, theAdvantage PerformanceGroup (APG) and The RealLearning Company (RLC),both highly-respectedtraining and consultingorganizations.Broad US presenceIn <strong>2006</strong>, <strong>BTS</strong> acquired two well-known companies on the strategically important US market, TheAdvantage Performance Group, (APG) and The Real Learning Company (RLC). The two companieshave also been successful partners to <strong>BTS</strong> for several years – which has led to some of thelargest accounts the Group has in the US.The acquisition of APG and RLC brings to the <strong>BTS</strong> Group some of the most experiencedbusiness-training professionals in the US as well as a customer base including many Fortune500 companies. The sales and delivery processes of the two acquired companies primarily targetorganizations’ middle and first-line management and sales force. This represents a strategiccomplement to and a widening of <strong>BTS</strong>’ focus on top management.A doubling of the existing client base in the US creates mutually beneficial synergies, and asignificant opportunity to increase market share by helping customers leverage “new” capabilitiesadded to the <strong>BTS</strong> solution portfolio. Examples of important customers that APG and RLChave brought to <strong>BTS</strong> include: Toyota, UPS, Bristol-Myers Squibb, American Express, Wells Fargo,Ingersoll-Rand, Daimler-Chrysler, Catholic Health and Insight.The Advantage Performance GroupThe Advantage Performance Group (APG)is a leading, human-performance consultingnetwork consisting of 40 fulltime franchisepartners and affiliates and over 100 independentfacilitators, which adds a strong marketforce for the US market.Network and franchise modelThe APG network is based on a franchisemodel. The franchise partners work exclusivelywith pre-selected product offerings from someof the worlds leading developers of training.APG collaborates with developers of trainingsolutions (such as <strong>BTS</strong> and RLC) and thenapplies its training-effectiveness methodology– The Advantage Way System – to helporganizations maximize their training Return ofInvestment (ROI).APG has supported hundreds of top organizationsto help achieve their business objectives.The company provides leading trainingsolutions in the areas of:• Sales & Service Excellence• Leadership & Organizational Development• Team & Individual Performance DevelopmentThe system is a high-impact conceptualframework for building training and businessimpact throughout organizations. It creates aclear linkage between training interventionsand business objectives.The Advantage Way System also incorporatesAPG’s proprietary Success CaseEvaluation Method , a practical way to measureand demonstrate both behavioral and bottomlineresults. Also, APG clients can be certifiedin the system which includes licensed “rightsto use” interactive programs and tools forhuman-resources development professionalsand managers, aimed at the goal of deliveringbetter business results from training.The Advantage Way SystemThe Advantage Way System is APG’s owntraining-effectiveness methodology that ensuresthat corporate training creates measurablebusiness impact. The system is based onmore than 30 years of research and practiceby Dr. Robert Brinkerhoff, and has been provenwith organizations that include AmericanExpress, Motorola, Boeing, Anheuser-Busch,Hewlett-Packard, EDS, QUALCOMM andmany others.28<strong>BTS</strong> <strong>Annual</strong> report <strong>2006</strong>
The Real Learning CompanyThe Real Learning Company (RLC) provides astrong product portfolio of sales and leadershipdevelopment solutions, as well as highlycreative customer and product developmentresources; areas in which the <strong>BTS</strong> Groupwants to expand its global presence. RLC’s offeringsare delivered via its two product suites:Performance Mastery System and SalesMastery System.Focus and approachRLC’s focus is on performance improvement.The company specializes in helping organizationsselect, align, and develop their humancapital. RLC provides practical models, tools,and learning programs for planning, building,and managing individual and team performance.The company’s approach is based on astrategically customized, performance-improvementprocess through discovery-basedlearning with web-based tools and reinforcementmaterials to extend the learning experience.Two product suitesRLC offers two product suites: PerformanceMastery System and Sales Mastery System.The Performance Mastery System improvescompanies’ capabilities to:• Deliver peak performance and retain talentwithin the organization• Integrate performance development intoyear-round objectives and goals• Select the right individual for the right job• Build high-performance teams• Improve business results through partneringin personal development.The Performance Mastery System alsoincludes performance measurement, organizationalfeedback, planning tools as well asreinforcement exercises to maximize clients’“return on people.”The Sales Mastery System improvescompanies’ capabilities to:• Develop sales professionals’ understandingof how executives think• Enable sales professionals to calculate andcommunicate the true value of their offeringsfor each individual buyer• Provide sales professionals with the interactivecommunication skills required to deliverexceptional value to customers• Transform sales professionals into skillednegotiators• Help sales professionals, their team members,and their managers create powerful,analytical, and action-packed plans tomanage both straightforward and complexsales opportunities from inception throughcommitment.“APG and RLC have a solid track record of profi table growth, and the combination ofour organizations builds an even stronger foundation for continued organic growthin the US and globally. RLC’s suites of training solutions in sales and leadershipdevelopment, combined with the <strong>BTS</strong> portfolio, form a complete range of trainingsolutions within business acumen, sales and leadership to serve our global customerbase. Also, the addition of APG’s 40 full-time franchise partners and affi liates andover 100 independent facilitators creates a very strong market force in the US Inaddition, I fi nd APG’s business model based on strong individual incentives and ahigh proportion of variable costs very attractive.”Comments of Mr Henrik Ekelund, President and CEOof the <strong>BTS</strong> Group, on the completed acquisition process<strong>BTS</strong> <strong>Annual</strong> report <strong>2006</strong> 29
<strong>BTS</strong> organizationGroup-internalfunctions<strong>BTS</strong> NorthAmericaGroup Management<strong>BTS</strong> Interactive<strong>BTS</strong> Board SimulationsAPG<strong>BTS</strong>EuropeRLC<strong>BTS</strong> OtherMarketss<strong>BTS</strong> is a truly globalorganization with officesclose to our clients in NorthAmerica, Europe, Asia andAfrica.<strong>BTS</strong>’ three operational units<strong>BTS</strong>’ operative activities are run through threeunits, in which the executive management haveP&L responsibility for their respective geographicalmarkets. The operational units arealso responsible for external product developmentin collaboration with customers on thevarious markets.<strong>BTS</strong> North America<strong>BTS</strong> North America operates in the US andhas offices in New York (New York), Stamford,(Connecticut), San Francisco (California),Philadelphia (Conshohocken, Pennsylvania)and Chicago (Illinois). The office in Beijing,China, is also a part of <strong>BTS</strong> North America.<strong>BTS</strong> Europe<strong>BTS</strong> Europe operates in Sweden, Finland,United Kingdom, Belgium and Spain and hasoffices in Stockholm (Sweden), Helsinki (Finland),London (UK), Brussels (Belgium) andMadrid and Bilbao (Spain).<strong>BTS</strong> Other Markets<strong>BTS</strong> Other Markets is active in South Africaand Australia, with offices in Johannesburg(South Africa) and Sydney and Melbourne(Australia).Product-specifi c units<strong>BTS</strong> has two product-specific units for productdevelopment. They work with new conceptsand the production of solutions, as well as providingactive sales support to the customers ofthe three operational units. <strong>Report</strong>ing is carriedout to the Group management.<strong>BTS</strong> Interactive<strong>BTS</strong> Interactive is responsible for Web-basedand scenario-based solutions.<strong>BTS</strong> Board Simulations<strong>BTS</strong> Board Simulations is responsible for boardbusiness simulations.Group-internal functionsGroup-internal departments cover GroupFinance, Investor Relations, Corporate Communicationsas well as certain IT, process andHuman Resources.Advantage Performance Group, APGAPG operates in the US Market and APG deliversperformance improvement through salesand leadership training that result in meaningfulbusiness impact using its Advantage Way SMimplementation process.The Real Learning Company, RLCRLC operates in the US Market. RLC developsperformance improvement within sales andleadership training using its Performance MasterySystem and Sales Mastery System.Key Management in <strong>BTS</strong> worldwide, from left: Philios Andreou, Lars Lindgren, Joel Sigrist, Dan Parisi, JonathanHodge, Jan Hedström, Katrin Fagerberg, Peter Mulford, Henrik Ekelund, Robert Kuhfus, Deon Greyling,Rommin Adl, Jonas Åkerman, Steve Toomey, Taavi Thiel, Ted Fawle and Patrick Fei.(Missing are Stefan af Petersens, Stefan Hellberg, Stefan Brown and Todd Ehrlich)30<strong>BTS</strong> <strong>Annual</strong> report <strong>2006</strong>
<strong>BTS</strong> processesProduct developmentEfficient product developmentContinuous, state-of-the-art product developmentis crucial to <strong>BTS</strong> growth and marketleadingrole in the field of discovery-basedlearning. <strong>BTS</strong> maintains valuable structuralcapital in the form of solutions, platforms andprocesses.Also, <strong>BTS</strong> has assimilated this experienceinto its systems and processes. New experienceand knowledge are introduced successivelyas the business activities of its customerschange.At the same time, <strong>BTS</strong> develops newservices based on the latest advances in methodologyand technology. Product developmentat <strong>BTS</strong> has two parts, external and internaldevelopment.External product developmentExternal product development involves developingnew training solutions in the areasof business acumen, leadership, sales andoperational excellence. It also encompassessolutions for new media - for example, webbasedbusiness simulations.<strong>BTS</strong> strives to conduct its product-developmentefforts in close collaboration with itscustomers.Internal product developmentInternal product development refers to internalwork with <strong>BTS</strong> development platforms andmethodologies, which form the foundation forcreating new training solutions. <strong>BTS</strong> solutionsare based on technologies that are generallyavailable on the market: Excel, Visual Basicand Flash, for example. Internal product developmentis directed towards the following tools:• <strong>BTS</strong> Mini Master is a common developmentenvironment for all computer-basedsimulations which, through a high degreeof reuse, results in shorter developmenttimes and greater accuracy.• <strong>BTS</strong> Document Platform for searchingand reusing existing documents.• <strong>BTS</strong> Flash Platform for web-basedsimulations.Quality measurementTo ensure delivery quality, <strong>BTS</strong> uses two typesof follow-up:• Initial Quality Survey - This surveyis completed by seminar participants atthe conclusion of each business simulationto assess the quality of the program. Ona scale of 1 to 5, <strong>BTS</strong>’ internal goal is toachieve a score of at least 4.6.• Verification of Knowledge Transfer& Application - <strong>BTS</strong> provides a processto verify that participants are applying theskills and knowledge they have acquired.<strong>BTS</strong> offers customers the opportunityto measure the long-term results of thetraining. This follow-up shows that 50 - 90percent of participants have retained knowledgethat they now apply in their everydaywork. It also shows that the improvementsin business results pay for the customer’sinvestment in the training many times over.Quality AssuranceIn order to reduce dependence on individualemployees and to assure the long-term qualityof <strong>BTS</strong> training courses, all methods, technologiesand business simulations are welldocumented.Rights<strong>BTS</strong> owns all the rights to all the businesssimulations it develops for customers. Thismeans that the company is free to reuse bothgeneral skills and intellectual property – forexample, software and adaptations – whendeveloping new business simulations.<strong>BTS</strong> works systematically todevelop and apply efficientprocesses that improvequality and productivity.Feedback from customersis an important driver.Internal product developmentRaises the efficiency of the processfor developing customized simulations.External product developmentRun in collaboration with customers tocreate new customized simulations,new solutions and media.<strong>BTS</strong> <strong>Annual</strong> report <strong>2006</strong> 31
5 year summaryIncome StatementConsolidated income statement, summaryMSEK <strong>2006</strong> 2005 2004 2003 2002Net turnover 379.1 286.1 205.9 162.2 172.2Operating expenses -309.3 -233.6 -174.2 -150.1 -162.0Depreciation tangible fi xed assets -2.1 -1.8 -1.1 -1.3 -1.4Amortization intangible fi xed assets -5.3 -2,0 - -0.6 -0.3Operating profit 62.4 48.7 30.7 10.2 8.5Balance SheetConsolidated balance sheets, summaryMSEK <strong>2006</strong> 2005 2004 2003 2002AssetsFixed assets 203.7 58.2 7.3 6.0 5.0Accounts receivable 88.7 64.2 36.8 31.2 31.4Other current assets 25.6 14.5 9.7 10.7 13.7Cash and bank balance 72.1 101.1 110.5 88.1 79.0Total assets 390.1 238.0 164.3 136.0 129.1Shareholders’ equity and liabilitiesShareholders’ equity 174.7 151.5 116.6 103.4 104.1Minority participations 0.5 0.4 0.2 0.1 0.1Provisions for deferred tax - - 0.2 0.2 0.2Interest-bearing liabilities 80.9 2.1 - - 0.1Non interest-bearing loans 0.4 0.2 - 0,1 -Other non interest-bearing liabilities 133.6 83.9 47.3 32.2 24.6Total equity and liabilities 390.1 238.0 164.3 136.0 129.1Cash FlowConsolidated cash flow statementMSEK <strong>2006</strong> 2005 2004 2003 2002Cash fl ow from current operations 41.1 37.5 32.1 18.2 15.4Cash fl ow from investment activities -140.6 -42.4 -2.9 -3.6 -1.0Cash fl ow from fi nancing activities 78.6 -12.3 -3.5 -3.1 -0.9Translation differences in liquid assets -8.2 7.9 -3.3 -2.4 -2.8Cash fl ow for the year -29.1 -9.3 22.4 9.1 10.7Liquid assets, start of the year 101.1 110.5 88.1 79.0 68.3Liquid assets, end of the year 72.1 101.1 110.5 88.1 79.032 <strong>BTS</strong> <strong>Annual</strong> <strong>Report</strong> <strong>2006</strong>
Key financial figures for the GroupMSEK <strong>2006</strong> 2005 2004 2003 2002Net turnover 379.1 286.1 205.9 162.2 172.2Operating profi t (EBIT) 62.4 48.7 30.7 10.2 8.5Operating margin (EBIT margin), % 16.5 17.0 14.9 6.3 4.9Operating income before amortization of intangible fi xed assets (EBITA) 67.6 50.8 30.7 10.8 8.8Operating margin before amortization of intangible fi xed assets (EBITA margin), % 17.8 17.7 14.9 6.6 5.1Profi t margin, % 10.2 12.9 9.9 4.5 3.7Earnings per share, SEK 1 2.2 2.1 1.1 0.4 0.4Return on equity, % 23.6 27.4 18.5 7.0 6.2Return on operational capital employed, % 52.7 164.7 282.9 50.2 27.8Operational capital employed 184.0 52.8 6.3 15.4 25.3Shareholders’ equity 174.7 151.5 116.6 103.4 104.1Equity per share 1 9.7 8.6 6.6 5.8 5.9Equity/assets ratio, % 44.9 63.8 71.1 76.0 80.7Dividends per share, SEK 1 1.00 0.92 0.53 0.20 0.17Cash fl ow -29.1 -9.3 22.4 9.1 10.7Liquid assets 72.1 101.1 110.5 88.1 79.0Number of employees at the end of the year 186 150 107 100 102Average number of employees 165 143 104 97 110<strong>Annual</strong> net turnover per employee 2.3 2.0 2.0 1.7 1.61Previous years' earnings per share, dividends per share and equity per share have been adjusted using a correction factor of 0.3333 due to the 3:1 split in May <strong>2006</strong>.DefinitionsOperating margin:Operating profi t after depreciation as a percentage of net turnover.Operating margin before amortization of intangible fixed assets(EBITA margin):Operating profi t before amortization of intangible fi xed assets as a percentage ofnet turnover.Profit margin:Profi t for the period as a percentage of net turnover.Earnings per share:Earnings attributable to the parent company's shareholders divided by the numberof shares.Return on equity:Net profi t after tax for the whole year as a percentage of average shareholders’equity.Return on operational capital employed:Operating profi t as a percentage of average operational capital employed.Operational capital employed:Balance sheet total less liquid assets, other interest-bearing assets and noninterest-bearing liabilities.Equity per share:Shareholders' capital excluding minority interest divided by the number of stock atthe end of the year.Equity/assets ratio:Equity as a percentage of the balance sheet total.Dividends per share:Dividends proposed and adopted respectively divided by the number of stock atthe end of the year.Net turnover per employee:Net turnover for the whole year divided divided by the average number of employees.<strong>BTS</strong> <strong>Annual</strong> <strong>Report</strong> <strong>2006</strong>33
The <strong>BTS</strong> shareOn June 6, 2001, <strong>BTS</strong> was floated on the O-list of the StockholmStock Exchange. In connection with this, a new stock issue was carriedout, generating a capital injection of MSEK 78.1 for the company afterissues expenses.The share capital in the company is SEK 6,016,100, divided between853,600 Class A shares and 17,194,500 Class B shares, each with aquotient value of SEK 0.33. Class A shares entitle holders to ten votes,Class B shares to one vote. All shares carry equal rights to a share ofthe company’s assets and profi ts.On December 31, <strong>2006</strong>, there were 1,052 (978) shareholders in theCompany. <strong>BTS</strong> Group AB has worked to promote the liquidity of thecompany's share since 2002. As a part of this strategy, a liquidityguarantor has been engaged to work to increase interest and trade inthe <strong>BTS</strong> share.Dividend policyThe Company’s long-term ambition is to distribute between 30 and 50percent of its profit after tax.SHARE DATAShare price January 2, <strong>2006</strong> SEK 39.00Share price December 31, <strong>2006</strong> SEK 48.00Earnings per share, December 31, <strong>2006</strong> SEK 2.18Liquid assets per share December 31, <strong>2006</strong> SEK 3.99Equity per share December 31, <strong>2006</strong> SEK 9.68<strong>BTS</strong> Group50B-shareOMX Stockholm_PIVolume of share turnover1000s (incl. post-not.)40302020001500101000500502 03 04 05 06(c)FINDATA34 <strong>BTS</strong> <strong>Annual</strong> <strong>Report</strong> <strong>2006</strong>
Share capitalChange in capitalYearTransactionIncrease in sharecapital, SEKShare capitalSEK Class A shares Class B sharesTotal no. ofsharesNominal sharevalue (SEK)1999 Formation of the company 100,000 100,000 439,900 560,100 1,000,000 0.101999 New issue 8,200 108,200 82,000 1,082,000 0.102001 Stock dividend issue 4,219,800 4,328,000 1,082,000 4.002001 4:1 split 4,328,000 1,759,600 2,568,400 4,328,000 1.002001 Conversion ofClass A shares to B shares -1,475,000 1,475,000 4,328,000 1.002001 New issue 1,500,000 5,828,000 1,500,000 5,828,000 1.002002 New issue 69,300 5,897,300 69,300 5,897,300 1.00<strong>2006</strong> 3:1 split 69,300 5,897,300 853,800 16,838,100 17,691,900 0.33<strong>2006</strong> New issue 118,800 6,016,100 356,400 18,048,300 0.33Name Class A Class B Holding Holding, % Votes Votes,%HENRIK EKELUND 816,000 3,151,616 3,967,616 21.98 11,311,616 43.95STEFAN AF PETERSENS 37,800 2,360,753 2,398,553 13.28 2,738,753 10.65STEFAN HELLBERG 0 1,483,454 1,483,454 8.21 1,483,454 5.76ALECTA PENSIONSFÖRSÄKRING 0 1,400,000 1,400,000 7.76 1,400,000 5.44ÅKERMAN, JONAS 0 913,800 913,800 5.06 913,800 3.55LÄNSFÖRSÄKRINGAR SMÅBOLAGSFOND 0 864,000 864,000 4.79 864,000 3.36NORDEA BANK FINLAND ABP 0 825,500 825,500 4.57 825,500 3.21BNY GCM CLIENT ACCOUNTS (E) ISG 0 584,800 584,800 3.24 584,800 2.27CLEARSTREAM BANKING S.A., W8IMY 0 440,129 440,129 2.44 440,129 1.71U.S. BANK NATIONAL ASSOCIATION 0 356,400 356,400 1.97 356,400 1.39BANCO SMÅBOLAGSFOND 0 350,000 350,000 1.94 350,000 1.36LANNEBO SMÅBOLAG 0 303,309 303,309 1.68 303,309 1.18FEI, PATRICK 0 303,200 303,200 1.68 303,200 1.18HANDELSBANKENS SMÅBOLAGSFOND 0 250,000 250,000 1.39 250,000 0.97LANNEBO SMÅBOLAG SELECT 0 238,800 238,800 1.32 238,800 0.93SWEDBANK ROBUR SMÅBOLAGSFOND SVERIGE 0 203,600 203,600 1.13 203,600 0.79Other 0 3,165,139 3,165,139 17.60 3,165,139 12.30Total 853,800 17,194,500 18,048,300 100.0 25,732,500 100.0<strong>BTS</strong> <strong>Annual</strong> <strong>Report</strong> <strong>2006</strong>35
Risk and sensitivityMarket riskMarket condition sensitivityTraining is sensitive to market conditions. Poor growth and expense-cuttingprograms influence corporate training budgets. In the same way,improvements in market conditions result in an increased willingness toinvest in training.Limited dependence on individual customers<strong>BTS</strong>’ 10 largest customers accounted for 30 percent of sales in <strong>2006</strong>.By maintaining a broad customer base, <strong>BTS</strong> limits its dependence onindividual customers.No sector dominates<strong>BTS</strong> customers are active within seven main sectors: Manufacturing, Telecom,IT, Financial Services, Pharmaceuticals & Biotechnology, Retail & Distributionand Energy. The global distribution of the business activities of its customershelps <strong>BTS</strong> reduce exposure to fluctuating conditions in specific markets.Geographical spreadMost of <strong>BTS</strong>’ sales are generated in North America - 65 percent - whileEurope accounts for 30 percent. In <strong>2006</strong>, <strong>BTS</strong> improved its presence innew markets such as those of Australia, South Africa and China, which,in the long term, will help reduce dependency on the markets of NorthAmerica and Europe.Fragmented competitive situationThe market for corporate training is fragmented. <strong>BTS</strong> encounters differentcompetitors in different markets and has no global competitors.Operational risksQuality and brands<strong>BTS</strong> bases its marketing on network-based sales and good customerrelations, which make high demands on the quality of <strong>BTS</strong> deliveries. <strong>BTS</strong>minimizes the risk of dissatisfied customers by recruiting and developingcompetent consultants and by ensuring that all development and all deliveryfollow established processes. <strong>BTS</strong> also conducts quality follow-upon all projects.Intellectual Property<strong>BTS</strong> owns all the rights to all business simulations it develops for clients.<strong>BTS</strong> has the rights to reuse both general skills and intellectual property,such as software and adaptions when developing new businesssimulations. Regarding license based products and solutions, the clientpurchases a number of licenses for the business simulations for theparticipating employees. If the number of participants increases, morelicensces must be purchased from <strong>BTS</strong>.Competence coverageRapid growth requires intensive recruiting and training of the employees.At the same time, it is essential to retain competent and motivatedpersonnel. In order to meet these requirements, <strong>BTS</strong> follows an establishedrecruiting and development model.Personal dependenceTo reduce dependence on individual employees and to assure thelong-term quality of <strong>BTS</strong> training courses, all methods, technologies andbusiness simulations are well documented.Financial risksCurrencyThe currencies that have the greatest influence on <strong>BTS</strong>’ profits are USD,EURO and GBP. Exposure in individual transactions is limited as incomeand expense are primarily in the same currency on the various markets.<strong>BTS</strong> does not normally hedge its currency exposure. The sensitivity analysispresented below shows the effects on the operating profits - based on <strong>BTS</strong>’Income Statement - of changes in the value of the American dollar, the euroand the pound Sterling in relation to the Swedish krona.FactorPercentageChangeChange,KSEKSEK/USD +/- 10 % +/- 4,488SEK/EURO +/- 10 % +/- 419SEK/GBP +/- 10 % +/- 672Counterparty risks<strong>BTS</strong> only accepts creditworthy counterparties in financial transactions. <strong>BTS</strong>’Accounts Receivable are distributed among a large number of companiesoperating in a variety of sectors. The maximum credit risk amounted toKSEK 5,517 (3,079) at the end of the year, which corresponds to the largestcredit exposure to any one operating unit.Liquidity and interest risksThe liquidity risk is small as liquid assets account for a limited part, only18 (43) percent, of the balance sheet total. <strong>BTS</strong>’ policy is to allow borrowingwith the approval of the Board. Excess liquidity in subsidiaries is initially to beused to amortize loans. Interest risks are limited to the fluctuating yield onthe liquid funds placed at variable rates.36 <strong>BTS</strong> <strong>Annual</strong> <strong>Report</strong> <strong>2006</strong>
Directors' reportThe Board of Directors and the CEO of <strong>BTS</strong> Group AB (publ), corporateidentity number 556566-7119, hereby submit their annual accountsand consolidated financial statements for the financial year <strong>2006</strong>. Allamounts indicated are in SEK thousands unless otherwise stipulated.Operations<strong>BTS</strong> Group AB is an international learning and development consultancycompany. <strong>BTS</strong> uses customized simulation models to supportexecutive management in making changes and improving profi tability.<strong>BTS</strong> solutions and services train the entire organization to analyze andmake decisions centered on the factors that promote growth and profi t-ability. This adds a greater market and profi t focus to the day-to-daydecision-making process, which in turn leads to tangible, sustainableimprovements in profits. <strong>BTS</strong>’ customers are often major corporations.Turnover and earnings<strong>BTS</strong>’ net turnover increased by 32 percent, totaling MSEK 379.1(286.1) in <strong>2006</strong>. Adjusted for exchange rate differences, growth was34 percent. Growth was generated both through organic growth andthe acquisition of The Advantage Performance Group (APG) and TheReal Learning Company (RLC) on September 25, <strong>2006</strong>. These acquisitionscontributed MSEK 43.7 in turnover, corresponding to 16 percentof the growth. <strong>BTS</strong>' turnover, excluding the acquisitions of APG andRLC, adjusted for exchange rate differences, increased by 18 percent.The Group’s profi t before taxes for the year increased by 11 percent toMSEK 61.0 (55.1), and net operating profit increased by 28 percent toMSEK 62.4 (48.7). The profit margin was 16 (17) percent.The companies acquired in <strong>2006</strong>, APG and RLC, are geographicallyreported in North America. During the year, net turnover for <strong>BTS</strong>' initialoperations in North America totaled MSEK 201.5 (176.2). Earningsincreased by 16 percent in local currency. The net operating profi tincreased by 31 percent to MSEK 35.6 (27.2). The profi t margin was18 (15) percent.Net turnover for APG and RLC was reported at MSEK 43.7 for Q4.Profit before amortization of intangible fixed assets (EBITA) was MSEK7.1. EBITA margin was 16 percent. Net operating profit, was affectedby amortization of intangible fixed assets amounting to MSEK 2.2,amounted to MSEK 4.9. The profi t margin was 11 percent.Net turnover for Europe amounted to MSEK 113.0 (88.6) in <strong>2006</strong>.Adjusted for changes in exchange rates, earnings increased by 28 percent.The net operating profit increased to MSEK 18.6 (17.9). The profit marginwas 16 (20) percent. The year's lower profit margin is mainly due to <strong>BTS</strong>Nordic's decrease in profit during the second half of the year. Intensifiedsales activities are expected to have a positive effect during the second halfof 2007.The net turnover for <strong>BTS</strong> Other Markets amounted to MSEK 20.9(21.3) in <strong>2006</strong>. The profi t margin was 16 (17) percent. Net operatingprofit was MSEK 3.3 (3.6).Financial positionAt the end of the year, liquid assets amounted to MSEK 72.1 (101.1).Interest-bearing liabilities amounted to MSEK 80.9 (2.1). Shareholders’equity at the end of the year totaled MSEK 175.2 (151.9) with anequity/assets ratio of 45 (64). <strong>BTS</strong>’ cash flow from current operationsfor the year was MSEK 41.1 (37.5).EmployeesOn December 31, <strong>2006</strong> <strong>BTS</strong> had 186 employees (150). The averagenumber of employees during the year was 165 (143).Parent companyThe activities of the parent company - <strong>BTS</strong> Group AB - consist exclusivelyof Group-internal tasks and its assets principally consist of liquidassets and shares in subsidiaries. The parent company’s net turnoveramounted to MSEK 2.4 (2.5) and the profit after net financial items wasMSEK 12.1 (15.1). On December 31, <strong>2006</strong>, liquids assets amounted toMSEK 8.5 (25.5).Outlook for 2007Based on continued strong market conditions for <strong>BTS</strong> and the completedacquisitions, the profit before tax is expected to be significantlybetter than the previous year.The market and market trendsThe companies that make up <strong>BTS</strong>' target group, namely major internationalcorporations and organizations, face accelerating rates ofchange, new technologies, and new competitors and subsequentlyinvest more in business development and training activities. Accordingto the leading market intelligence fi rm, IDC, the market for corporatetraining in business skills will grow by an average of 8 percent per yearduring the period 2005–2009. Training solutions based on customizedsimulation have proven to be superior to traditional courses in terms ofeffectiveness and outcome. As a consequence, clients opt for this typeof solution to a greater extent. <strong>BTS</strong> believes that the market segmentfor training courses based on simulation technology is growing fasterthan the rest of the market. <strong>BTS</strong>' services and products within thismarket have reported robust growth throughout <strong>2006</strong>. All marketsreport continued strong demand.<strong>BTS</strong> has long been the leader on the training market through itscustomized business simulation models. The company presently hasassignments from 26 of the world's 100 largest corporations, as comparedto 22 during the same period in 2005. <strong>BTS</strong> continues to capturemarket shares from training and management consultants and businessschools, thereby positioning itself as the most efficient partner in helpingcompanies to implement strategic changes.<strong>BTS</strong> <strong>Annual</strong> <strong>Report</strong> <strong>2006</strong>37
<strong>BTS</strong> growth<strong>BTS</strong>' growth strategy is built on organic growth through expansionfrom existing offices, geographic expansion through new offices andconstant development of new products. In recent years this strategyhas been complemented by growth through acquisitions.<strong>BTS</strong>' average growth over the past ten years has amounted to 16 percentper year, of which 14 percent was organic growth. During the pastthree years, the average growth has amounted to 33 percent per year,of which 19 percent was organic growth.<strong>BTS</strong> systematically works to create organic growth within its currentoperations. <strong>BTS</strong> applies two processes: one to maximize the earningpotential of its client base, and one to increase the earning capacityof its organization and employees. For each of these processes <strong>BTS</strong>has defined fi ve growth factors for which targets are set and outcomesmeasured.Through product development and acquisitions, <strong>BTS</strong>' range of servicesand products has expanded considerably and includes, in addition toworld-leading business simulation models, leading solutions withinstrategically critical fields such as sales and leadership developmentand web-based training solutions.In <strong>2006</strong>, the company’s range of products underwent greater developmentthan in any previous year - partly through comprehensive in-housedevelopment in client-fi nanced projects, and partly through the acquisitionof APG and RLC, which added a broad range of solutions. Over theyears, and particularly in <strong>2006</strong>, <strong>BTS</strong> has gradually created the market'sbroadest and most specialized selection of customized simulationsolutions. This means that <strong>BTS</strong> can to a greater extent satisfy existingcustomers' needs for more solutions, which generates substantial opportunitiesfor growth, both in the near-term and long-term.In recent years, <strong>BTS</strong> has also grown through successful acquisitions, allof which have flourished with <strong>BTS</strong>. Since the market is fragmented, <strong>BTS</strong>sees further opportunities on markets that exhibit a constant, strongdemand.Research and developmentThe development carried out by <strong>BTS</strong> during the year centered on customer-specificproduct development and has therefore been expensedimmediately. No research according to the definition in IAS 38 wascarried out.Financial risksAn effective and systematic risk evaluation of fi nancial and businessrisks is important to <strong>BTS</strong>. The Group's financial policy stipulates theguidelines and objectives for managing financial risks within the Group.Financing and risk management have been collated under the Groupfinance function. The subsidiaries manage all foreign exchange dealingsand client lending within the framework of the adopted policy. Fora detailed description, refer to Note 2 Accounting principles and Note21 Financial instruments and financial risk management.The work of the Board of DirectorsIn accordance with the articles of association, the Board of Directors of<strong>BTS</strong> shall consist of no fewer than three and no more than eight members.During the fiscal year, i.e. as from the <strong>Annual</strong> General Meeting,the Board has consisted of fi ve members.The Board of Directors works according to a set agenda with instructionsconcerning the distribution of work between the Board and theCEO. According to this agenda, the Board will normally hold a minimumof four ordinary meetings. At each of these meetings, the Board dealswith issues of significant importance to the Company. In addition, theBoard receives reports from senior management about the currentbusiness conditions of the Group’s submarkets. Board meetings areheld regularly in connection with reports from the Company. On thisbasis, the Board deals with the Year-end <strong>Report</strong> and dividend proposalsin February, Interim <strong>Report</strong>s in April, August and October, and thebudget for the coming year in December. The <strong>BTS</strong> Board contains nospecial committees or sub-groups - all issues are normally dealt withby the Board as a whole. Occasionally however, certain issues are delegatedto the Chairman of the Board and the CEO for joint deliberation.Every year, the company auditor reports in person his observations fromhis audit and states his evaluation of the internal control process.The Board convened 13 times in <strong>2006</strong>. Five of these meetings werespecifically convened on the basis of the acquisition of The AdvantagePerformance Group and The Real Learning Company. The Board hasalso had intense discussions about the company's acquisition strategy,resulting in the year's acquisitions, among other things. Forms for evaluatingthe work of the Board were decided in December for assessmentand discussion in the beginning of 2007.38 <strong>BTS</strong> <strong>Annual</strong> <strong>Report</strong> <strong>2006</strong>
Multiple year overviewPerformance over the past fi ve fiscal years is presented below. The fi gures for 2004–<strong>2006</strong> are presented in accordance with IFRS, while therecommendations of the Swedish Financial Accounting Standards Council have been applied to those for the previous years.SEK thousands <strong>2006</strong> 2005 2004 2003 2002Net turnover 379,097 286,119 205,944 162,204 172,230Operating expenses -309,345 -233,582 -174,123 -150,105 -161,997Depreciation tangiblefi xed assets -2,127 -1,772 -1,098 -1,330 -1,405Amortization intangiblefi xed assets 1 -5,270 -2,069 - -547 -365Operating profit 62,355 48,696 30,723 10,222 8,463Operating margin, % 16.4 17.0 14.9 6.3 4.9Number of employees at the end of the year 186 150 107 100 102Average number of employees 165 143 104 97 110Net turnover per employee 2,298 2,001 1,980 1,672 1,5661Amortization of intangible fi xed assets includes amortization of goodwill for the years 2002–2003. If IFRS had applied these years, goodwill would not have been amortizedaccording to a schedule.Events after the close of the fiscal yearNo significant events have occured after the close of the fiscal year up untilthe Board’s signing of the annual report and accordingly none have been takeninto account when producing the balance sheets and income statement.Proposed disposition of profitsParent companyThe following profits are at the disposal of the <strong>Annual</strong> General Meeting:SEKProfi t carried forward 54,460,849Profi t for the year 12,101,314Total 66,562,163Statement from the Board of Directors concerning the proposeddividendThe proposed dividend for shareholders will reduce the equity/assets ratio ofthe company to 47 percent and that of the group to 40 percent. Equity/assetsratio is considered secure as the activities of the company are currentlyrunning profitably. It is also estimated that it will be possible to maintain theliquidity of the company at a secure level.The Board of Directors is of the opinion that the proposed dividend will notprevent the company from fulfilling its obligations in the near- and long-term,nor in making the investments required. The proposed dividend is thereforedefensible with reference to the provisions of Chapter 17, §3, sections 2–3 ofthe Swedish Companies Act (the prudence concept):The Board of Directors proposes that the profi ts bedistributed such that:shareholders receive a dividend of SEK 1.00 pershare, totalingand the following be carried forward to the newincome statement18,048,30048,513,863Total 66,562,163As regards to the other operations of the Group and the parent company,refer to the income statements and balance sheets below, as well as to thecash flow analyses and associated notes.It is proposed that the dividend be paid on May 11, 2007.<strong>BTS</strong> <strong>Annual</strong> <strong>Report</strong> <strong>2006</strong>39
Financial statementsCONSOLIDATED INCOME STATEMENTSEK thousands NOTE <strong>2006</strong> 2005Net turnover 3, 12 379,097 286,119Operating expensesOther external expenses 4, 5, 6, 7 -149,400 -78,800Personnel expenses 8 -159,945 -154,747Depreciation/Amortization of tangible and intangible fi xed assets 9, 10 -7,397 -3,876Total operating expenses -316,742 -237,423OPERATING PROFIT 3, 11 62,355 48,696Financial items 12Financial income 927 6,457Financial expenses -2,277 -95Total profi t/loss from fi nancial items -1,350 6,362PROFIT AFTER FINANCIAL ITEMS 61,005 55,058Tax on profi t for the year 14 -22,421 -18,281PROFIT FOR THE YEAR 38,584 36,777Profit for the year attributable to:Shareholders in the parent company 38,531 36,643Minority interests in subsidiaries 53 134Earnings per share (for profi ts attributable to parent company shareholders during the year) 15Earnings per share, before dilution, SEK 2.18 2.07 1Number of shares at the end of the year 18,048,300 5,897,300Earnings per share, after dilution, SEK 2.18 2.07 1Proposed dividend per share 1.00 0.92 11Previous years' earnings per share and dividend per share have been adjusted using a correction factor of 0.3333 due to the 3:1 split in May <strong>2006</strong>.40 <strong>BTS</strong> <strong>Annual</strong> <strong>Report</strong> <strong>2006</strong>
CONSOLIDATED BALANCE SHEETSSEK thousands NOTE 12-31-<strong>2006</strong> 12-31-2005ASSETSFixed assetsIntangible fi xed assetsGoodwill 9 149,873 35,683Other intangible fi xed assets 9 45,213 15.295Tangible fi xed assetsEquipment 10 5,380 5,435Financial fi xed assetsDeferred tax receivables 18 1,284 477Other long-term receivables 21 1,968 1,249Total fixed assets 203,718 58,139Current assetsCurrent receivablesAccounts receivable 21 88,692 64,198Other receivables 21 5,371 2,340Prepaid expenses and accrued income 19 20,233 12,150Total current receivables 114,296 78,688Liquid assets 72,054 101,145Total current assets 186,350 179,833TOTAL ASSETS 390,068 237,972<strong>BTS</strong> <strong>Annual</strong> <strong>Report</strong> <strong>2006</strong>41
CONSOLIDATED BALANCE SHEETSSEK thousands NOTE 12-31-<strong>2006</strong> 12-31-2005SHAREHOLDERS’ EQUITY AND LIABILITIESShareholders’ equity 20Share capital 6,016 5,897Other contributed capital 39,547 39,547Reserves -20,243 -5,105Profi t brought forward, including the year’s profi t 149,343 111,129174,663 151,468Minority interest 508 405Total shareholders’ equity 175,171 151,873Long-term liabilitiesOther liabilities 21 388 169Current liabilitiesAccounts payable 21 13,446 7,347Tax liabilities 17,724 6,669Other current liabilities 21, 22 124,246 18,773Accrued expenses and prepaid income 23 59,094 53,141Total current liabilities 214,509 85,930TOTAL SHAREHOLDERS’ EQUITY AND LIABILITIES 390,068 237,972Pledged assets and contingent liabilities 24, 2542 <strong>BTS</strong> <strong>Annual</strong> <strong>Report</strong> <strong>2006</strong>
CONSOLIDATED CASH FLOW STATEMENTSEK thousands NOTE <strong>2006</strong> 2005Current operationsOperating profi t 62,355 48,696Adjustments for items not included in cash fl ow, etc.Depreciation 7,419 3,876Other items -259 15Financial income and expenses 17 -1,350 6,362Paid tax for the year -22,421 -18,419Cash fl ow from current operations before changes in working capital 45,744 40,530Cash fl ow from changes in working capitalChange in accounts receivable -6,582 -22,017Change in other operating receivables -5,433 -2,961Change in accounts payable and other operating liabilities 7,391 21,903Cash fl ow from changes in working capital -4,624 -3,075Cash flow from current operations 41,120 37,455Investing activitiesAcquisitions of shares, participations and operations 17 -1,109 -5,537Acquisition of tangible fi xed assets 10 -2,482 -3,884Acquisition of intangible fi xed assets 9, 17 -136,960 -32,961Cash flow from investing activities -140,551 -42,382Financing activitiesNew issue 17 14,587 -Changes in loans 80,434 -2,814Changes in deposits -161 -66Dividends to shareholders -16,218 -9,436Cash flow from financing activities 78,643 -12,316Cash flow for the year -29,091 -9,332Liquid assets, start of the year 101,145 110,477Liquid assets, end of the year 17 72,054 101,145Translation differences in liquid assets -8,305 7,911<strong>BTS</strong> <strong>Annual</strong> <strong>Report</strong> <strong>2006</strong>43
PARENT COMPANY’S INCOME STATEMENTSEK thousands NOTE <strong>2006</strong> 2005Net turnover 4 2,430 2,463Operating expensesOther external expenses 4, 5, 7 -1,659 -1,775Personnel expenses 8 -761 -646Total operating expenses -2,420 -2,421OPERATING PROFIT 10 42Financial items 12Profi t from other securities and receivablestreated as fi xed assets 13,888 14,677Interest income and similar profi t items 268 377Interest expenses and similar loss items -2,065 -Total profi t/loss from fi nancial items 12,091 15,054PROFIT AFTER FINANCIAL ITEMS 12,101 15,096Appropriations 13 - 241Tax on profi t for the year 14 - -1,948PROFIT FOR THE YEAR 12,101 13,38944 <strong>BTS</strong> <strong>Annual</strong> <strong>Report</strong> <strong>2006</strong>
PARENT COMPANY’S BALANCE SHEETSSEK thousands NOTE 12-31-<strong>2006</strong> 12-31-2005ASSETSFixed assetsFinancial fi xed assetsParticipation in Group companies 16 105,422 79,180Receivables from Group companies 85,128 4,758Total fixed assets 190,550 83,938Current assetsCurrent receivablesReceivables from Group companies 1,646 2,007Other receivables 6 12Prepaid expenses and accrued income 19 114 116Total current receivables 1,766 2,135Liquid assets 8,486 25,468Total current assets 10,252 27,603TOTAL ASSETS 200,802 111,541<strong>BTS</strong> <strong>Annual</strong> <strong>Report</strong> <strong>2006</strong>45
PARENT COMPANY’S BALANCE SHEETSSEK thousands NOTE 12-31-<strong>2006</strong> 12-31-2005SHAREHOLDERS’ EQUITY AND LIABILITIESShareholders’ equity 20Restricted shareholders’ equityShare capital 6,016 5,897Reserve fund 40,726 40,726Total restricted equity 46,742 46,623Non-restricted equityProfi ts carried forward 55,204 42,821Profi t for the year 12,101 13,389Total non-restricted equity 67,305 56,210Total shareholders’ equity 114,047 102,833Current liabilitiesAccounts payable 128 224Liabilities to Group companies 2,079 2,417Tax liabilities 1,700 1,945Other current liabilities 22 82,517 3,491Accrued expenses and prepaid income 23 331 631Total current liabilities 86,755 8,708TOTAL SHAREHOLDERS’ EQUITY AND LIABILITIES 200,802 111,541Pledged assets and contingent liabilities 24, 2546 <strong>BTS</strong> <strong>Annual</strong> <strong>Report</strong> <strong>2006</strong>
PARENT COMPANY’S CASH FLOW STATEMENTSEK thousands NOTE <strong>2006</strong> 2005Current operationsOperating profi t 10 42Financial income and expenses 17 -98 6,670Paid tax for the year - -1,948Cash fl ow from current operations before changes in working capital -88 4,764Cash fl ow from changes in working capitalChange in other operating receivables 371 326Change in accounts payable and other operating liabilities -1,909 6,127Cash fl ow from changes in working capital -1,538 6,453Cash flow from current operations -1,627 11,217Investing activitiesAcquisition of shares and participations 17 -1,109 -6,456Cash flow from investing activities -1,109 -6,456Financing activitiesPaid shareholders’ contribution -26,325 -31,690New issue 14,587 -Group contribution 1,000Changes in loans 521 -2,769Dividends received from subsidiaries 12,189 8,384Dividends to shareholders -16,218 -9,436Cash flow from financing activities -14,246 -35,511Cash flow for the year -16,982 -30,750Liquid assets, start of the year 25,468 56,218Liquid assets, end of the year 17 8,486 25,468<strong>BTS</strong> <strong>Annual</strong> <strong>Report</strong> <strong>2006</strong>47
CHANGES IN GROUP SHAREHOLDERS’ EQUITYNOTE20SharecapitalOthercontributedcapitalReservesProfitbroughtforwardMinorityparticipationsTotal shareholders’equityOpening balance as at January 1, 2005 5,897 79,547 1,430 29,705 233 116,812Provisions according to <strong>Annual</strong> General Meeting 408 -408 -Transfer of exchange rate differences from previous years -14,073 14,073 -Reversal of untaxed reserve -559 559 -Transfer according to <strong>Annual</strong> General Meeting -40,000 40,000 -Exchange rate differences 7,689 31 7,720Total transactions reported directly in shareholders’ equity 5,897 39,547 -5,105 83,929 264 124,532Profi t for the year 36,636 141 36,777Total income and expenses in shareholders’ equity 5,897 39,547 -5,105 120,565 405 161,309Dividends to shareholders -9,436 -9,436Closing balance as at December 31, 2005 5,897 39,547 -5,105 111,129 405 151,873Opening balance as at January 1, <strong>2006</strong> 5,897 39,547 -5,105 111,129 405 151,873Share-related remuneration in accordance with IFRS 2 1,434 1,434Exchange rate differences -15,138 48 -15,090Total transactions reported directly in shareholders’ equity 5,897 39,547 -20,243 112,563 453 138,217Profi t for the year 38,529 55 38,584Total income and expenses in shareholders’ equity 5,897 39,547 -20,243 151,092 508 176,801New issue 19 119 14,469 14,587Dividends to shareholders -16,218 -16,218Closing balance at December 31, <strong>2006</strong> 6,016 39,547 -20,243 149,343 508 175,171CHANGES IN PARENT COMPANY SHAREHOLDERS’ EQUITYNOTE20 Share capitalPremiumreserveReservesProfit carriedforwardProfit for theyearTotal shareholders’equityOpening balance as at January 1, 2005 5,897 79,547 771 1,138 11,527 98,880Distribution of profi ts according to <strong>Annual</strong> General Meeting;Provisions to reserves 408 -408 -Transfer to profi t brought forward 11,527 -11,527 -Transfer according to <strong>Annual</strong> General Meeting -40,000 40,000 -Effect of change in Swedish Companies Act -39,547 39,547 -Dividends to shareholders -9,436 -9,436Profi t for the year 13,389 13,389Closing balance as at December 31, 2005 5,897 - 40,726 42,821 13,389 102,833Opening balance as at January 1, <strong>2006</strong> 5,897 - 40,726 42,821 13,389 102,833Distribution of profi ts according to <strong>Annual</strong> General Meeting;Transfer to profi t brought forward 13,389 -13,389 -New issue 19 119 14,469 14,587Dividends to shareholders -16,218 -16,218Group contribution for the year 1,000 1,000Tax effect of Group contribution -257 -257Profi t for the year 12,101 12,101Closing balance as at December 31, <strong>2006</strong> 6,016 - 40,726 55,204 12,101 114,04748 <strong>BTS</strong> <strong>Annual</strong> <strong>Report</strong> <strong>2006</strong>
NotesNotes to the <strong>Annual</strong> <strong>Report</strong>NOTE 1 - General informationThe parent company is a Swedish-registered public limited company headquarteredin Stockholm, Sweden. The address of the head office is Grevgatan34. The parent company is listed on the Stockholm Stock Exchanges' smallercompanies list.NOTE 2 - Accounting principlesAmounts are stated in SEK thousand unless otherwise indicated.As from January 1, 2005, <strong>BTS</strong> has prepared its consolidated accounts inaccordance with the International Financial <strong>Report</strong>ing Standards, IFRS,as approved by the EU, and in line with the Swedish Financial AccountingStandards Council's recommendation RR30, Supplementary AccountingRegulations for Groups. The consolidated accounts have been prepared inaccordance with the Swedish <strong>Annual</strong> Accounts Act.In the absence of any statement to the contrary, these principles have alsobeen applied to the multiple year overviews presented.For the parent company, the provisions of the Swedish <strong>Annual</strong> Accounts Actand RR 32, Accounting for Legal Entities, have been applied. The parentcompany's shareholdings in subsidiaries are reported at acquisition value anduntaxed reserves including the tax share.Information about IFRS standards or interpretations that are not yetin effect and which the company has not applied in the <strong>2006</strong> <strong>Annual</strong><strong>Report</strong>:IAS 1 – Formulation of fi nancial reports. Revisions of changes in shareholders'equity and disclosure requirement in terms of capital. The change willtake effect for the fiscal year beginning January 1, 2007. The effect of thechange for <strong>BTS</strong> is deemed insignificant.IFRS 7 - Financial instruments: Disclosures. Effective as of the fiscal yearbeginning January 1, 2007 or later. The standard will mean that <strong>BTS</strong> mustreport more comprehensive supplementary information concerning financialinstruments.IFRIC 7 – Restatement approach under IAS 29 Financial <strong>Report</strong>ing inHyperinfl ationary economies. Effective as of the fiscal year beginning March1, <strong>2006</strong> or later. The change is deemed to have no effect for <strong>BTS</strong>.IFRIC 8 – Scope of IFRS 2. Effective as of the fiscal year beginning May 1,2007 or later. The change is deemed to have no effect for <strong>BTS</strong>.IFRIC 9 – Reassessment of Embedded Derivatives. Effective as of the fiscalyear beginning June 1, <strong>2006</strong> or later. The change is deemed to have noeffect for <strong>BTS</strong>.IFRIC 10- Interim Financial <strong>Report</strong>ing and Impairment. Effective as of thefiscal year beginning November 1, <strong>2006</strong> or later. The change is deemed tohave no effect for <strong>BTS</strong>.Consolidated accountsThe consolidated accounts include the accounts for all subsidiaries. Asubsidiary is a company in which the parent company, directly or indirectly,holds shares that represent more than 50 percent of the votes or otherwisemaintains a controlling influence. <strong>BTS</strong> owns 90.1 percent of <strong>BTS</strong> AustralasiaPTY Limited. All other subsidiaries are wholly-owned by the parent company.Subsidiaries are included in the consolidated accounts effective the day onwhich controlling influence is transferred to the Group. The Group's financialstatements are prepared in accordance with the acquisition method, whichmeans that the subsidiaries' own capital at the time of their acquisition,defined as the actual difference between assets and liabilities, is eliminatedin full. The Group's shareholders' equity thus only contains that part of thesubsidiaries’ shareholders’ equity held by these companies subsequent to thepurchase. The surplus which is the difference between the acquisition valueand the actual value of the Group's share of identifiable acquired assets,liabilities and contingent liabilities is reported as goodwill.All intra-Group transactions and balance sheet items have been eliminated.Subsidiaries are run with a high level of independence and transactions withthe parent company account for only a small part of their business. The profitand financial positions of all Group companies that have a different functionalcurrency than reporting currency, are restated in the Group's reporting currencyas follows:- assets and liabilities for each of the balance sheets is restated at closingday rate,- income and expenses for each of the income statements is restated ataverage rate,- exchange rate differences that arise are reported as a separate part of theshareholders' equity.When acquiring subsidiaries an additional purchase price may be charged.The anticipated additional purchase price is set based on assessments ofwhether the conditions for payment are fulfilled.The exchange rates for the currencies in which the Group received incomewere:average December 31 average December 31<strong>2006</strong> <strong>2006</strong> 2005 2005USD 7.38 6.87 7.47 7.95GBP 13.57 13.49 13.57 13.73EUR 9.25 9.05 9.28 9.43ZAR 1.10 0.99 1.17 1.26AUD 5.55 5.44 5.69 5.83CHF 588.40 563.10 599.50 605.80Other currencies have not had a significant effect on the consolidated balancesheets and income statements.Income/ongoing commissionsIncome is booked on delivery of services to the client in accordance with thesales conditions. Sales are booked at net value after VAT, and with any applicableexchange rate differences for sales in foreign currency.Income from completed service assignments and the expenses attributableto these assignments are booked as income and expenses respectively, inrelation to the degree of completion of the assignment at the balance sheetdate (successive profit offset). The degree of completion of an assignment isdefined by comparing the expenses paid at balance sheet date with the calculatedtotal expenses. In the event that the outcome of a service assignmentcannot be calculated in a reliable manner, the income from this assignmentis only booked to the extent that it corresponds to the assignment expensesthat have arisen and which are likely to be covered by the client. Lossesincurred on assignments are entered immediately as expenses.<strong>BTS</strong> <strong>Annual</strong> <strong>Report</strong> <strong>2006</strong>49
Research and developmentExpenses linked to customer-specific product development are expensedimmediately. Expenses related to development projects (i.e. attributable tothe development and testing of new or improved products) are posted asintangible assets to the extent to which such expenses can be expected togenerate economic advantages in the future. The company has not carriedout any research or development according to the definition in IAS 38. Thedevelopment normally carried out by <strong>BTS</strong> concerns customer-specific productdevelopment.Remuneration to employeesPensionsThe Group has different pension plans in different countries. All plans aredefined-contribution pension plans and the assets are managed by externalparties. The company pays fixed fees and has thereby fulfilled its obligations.The Group's profit is burdened by the expenses at the rate the pensions areearned.Share-related remuneration<strong>BTS</strong> Group AB issued employee stock options to the Group's employees in<strong>2006</strong>. The plan facilitates for the employees to acquire stock in the company.The actual value of the allocated stock options has been reported asemployee expenses with a comparable increase of shareholders' equity. Theactual value is calculated at the time of allocation and distributed over thequalification period. The actual value of the allocated stock options are calculatedin accordance with the Black & Scholes model with consideration takento the conditions that applied at the time of allocation. The expenses reportedcorresponds to the actual value of an estimate of the number of stock optionsand shares expected to qualify. Social benefit expenses attributable toshare-related remuneration to the employees as remuneration for purchasedservices are booked distributed over the periods during which the servicesare completed. Provisions for social benefit expenses are based on the stockoptions' actual value at the time of the report. The actual value is calculatedusing the same valuation models used when the stock options were issued.ProvisionsA provision is reported when the company has a legal or informal obligationwhich it is deemed that the company will be required to settle and a reliableestimate of the amount can be made, and if it is likely that an outflow ofeconomic resources will be required to settle the obligation. Any relevantprovisions will be valued at the current value of the amount that is deemednecessary to settle the obligation. In this context a discount rate before tax isused that reflects a current market assessment of the time-dependent valueof money and the risks associated with the provision.BorrowingBorrowing expenses burden the result for the period to which they refer,except in cases where funds are borrowed to acquire an asset, since borrowingexpenses are included in the asset’s acquisition value. Borrowing isinitially reported at the amount received less transaction expenses. After thedate of acquisition the loan is valued at accrued acquisition value in line withthe effective interest method. Long-term liabilities have an anticipated termof longer than 12 months while current liabilities have a term shorter than 12months.Income taxes<strong>Report</strong>ed income taxes comprise taxes that are to be paid or received withregard to the year in question as well as changes in the deferred tax. All taxespayable and receivable are valued at nominal amounts in accordance with thetax rules and tax rates that have been decided or announced and which mostprobably will be adopted. Items entered in the income statement are thusreported along with the associated tax effects in the income statement. Taxeffects of items reported directly against shareholders’ equity are reported againstshareholders’ equity. Current tax is the tax to be paid or received for the currentyear. This includes adjustments of current tax attributable to prior periods.Deferred tax is calculated according to the balance sheet method on thebasis of temporary differences between the reported and tax values of assetsand liabilities. Deferred tax claims relating to deficit deductions or otherfuture tax-related deductions are reported to the extent that it is likely thatcan be deducted against profits for future taxation.<strong>Report</strong>s per segmentThe Group's risks and opportunities are influenced primarily through its activitiesin different countries and on different geographic markets, which is whythe operational segment is the primary area of division. As the Group’s businessis only managed and reported per geographical market, no secondarysegment is reported.To distribute Group-wide expenses, each subsidiary's respective share of theGroup's total turnover is used as an index for distributing overhead.Leasing and rental agreementsWhen leasing contracts involve the company as the lessee, thus allowingthe company to benefit from all the financial advantages and risks associatedwith the object of the lease, this item is entered as a fixed asset in theconsolidated balance sheet. The corresponding obligation to pay leasingcharges in the future is entered as a liability. Assets are depreciated at a pacecorresponding to their expected period of use. Leasing in which a significantshare of the risks and benefits associated with ownership are retained by theleaser is classified as operational leasing. Payments made during the leasingterm are booked in the income statement on a straight-line basis over theterm of the leasing agreement.Tangible fixed assetsTangible fixed assets are reported at acquisition value less accumulateddepreciation and impairment expenses, if any. Acquisition value includesexpenses that are directly attributable to the acquisition of the asset. Planneddepreciation is performed on a straight-line basis on the basis of the acquisitionvalue and the evaluated period of use. The following depreciationperiods are applied to existing assets:- equipment and installations, 3–6 years.The residual value and period of use of the assets are tested annually andadjusted as necessary.Intangible fixed assetsGoodwillGoodwill is the difference between the acquisition value and the actual valueof the Group's share of the acquired subsidiary’s identifiable net assets atthe time of the acquisition. The acquisition value of subsidiaries includesconditional supplementary purchase prices only once it is deemed probablethat the conditions in question will be fulfilled. Goodwill is tested annually forany indication of impairment and reported at acquisition value less accumulatedimpairment expenses. Profits or losses on the sale of a unit include theresidual reported value of the goodwill relating to the divested unit.Products, technology and softwareAcquired products, technology and software a have a limited period of useand are reported at acquisition value less accumulated depreciation andany impairment expenses. Depreciation is performed on a straight-line basisthroughout the estimated period of use (2-9 years).Franchise-holder contractsAcquired franchise-holder contracts have a limited period of use and are reportedat acquisition value less accumulated depreciation and any impairmentexpenses. Amortization is performed on a straight-line basis throughout theestimated period of use (10 years).50 <strong>BTS</strong> <strong>Annual</strong> <strong>Report</strong> <strong>2006</strong>
Customer contractsAcquired customer contracts have a limited period of use and are reportedat acquisition value less accumulated depreciation and any impairmentexpenses. Depreciation is performed on a straight-line basis throughout theestimated period of use (2-15 years).BrandsAcquired brands that have an undetermined period of use are reported atacquisition value less accumulated impairment expenses as appropriate.Impairment tests are performed annually or more frequently if there is anyindication of decrease in value.Acquired brands that have an limited period of use are reported at acquisitionvalue less accumulated amortization and impairment expenses as appropriate.Amortization is performed on a straight-line basis throughout the estimatedperiod of use (10 years).Impairment testsImpairment tests are carried out when there is indication that tangible,intangible or financial fixed assets have a booked value that exceeds theirrecovery value. In this context, recovery value is taken to mean the higherof the net sales value and utilization value of an asset. If it is not possible toestablish this for individual assets, the relevant recovery value is calculated forthe smallest cash-generating unit to which the asset belongs.The Group performs impairment tests for goodwill and brands every year inaccordance with the following principle:The recovery values are based on utilization value, calculated as the currentvalue of future growth and earning forecasts over a multiple-year period,and on extrapolated cash flows beyond the multiple-year period. Impairmenttests are initially performed solely on the acquired cash-generating unit. If ittranspires that the amount reported exceeds the utilization value of the unit,the test is performed on the primary segments amongst which goodwill wasdistributed.Important estimates and assessmentsTo prepare the financial statements in accordance with IFRS, executivemanagement must make assessments, estimates and assumptions that affectthe application of the accounting principles and the reported amounts of assets,liabilities, income and expenses. Estimates and assumptions are basedon historic experience and a number of other factors that during the currentcircumstances appear reasonable. The result of these estimates and assumptionsis then used to assess the reported values for assets and liabilities thatwould otherwise not be evident in other sources. The actual outcome maydeviate from these estimates and assessments.Estimates and assumptions are regularly reviewed. Changes in the estimatesare reported in the period in which the change is made if the changeaffected only that period.Impairment tests for goodwill and intangible fi xed assets with undeterminedutilization periodsEvery year the Group performs impairment tests for goodwill and intangiblefixed assets with undetermined utilization periods in accordance with theprinciple described above. The recovery value for cash-generating units hasbeen determined by calculating the utilization value. Certain estimates mustbe made for these calculations; please see note 9.Establishment of supplementary purchase priceIn order to establish anticipated supplementary purchase prices, the Groupmakes realistic evaluations of future growth and multi-year earning forecastsseparately for each subsidiary acquired.Financial instruments:Financial assets and liabilities are reported in the balance sheets whereverthere is a contractual right or obligation to pay or receive cash or other financialassets to or from another party, or to exchange one financial instrumentfor another that proves favorable or unfavorable.The Group classifies and valuates financial instruments in the followingcategories:a) Financial assets valued at actual value via the income statement.This refers to financial assets held for trading. Derivative instruments thatare not hedging instruments are also placed in this category. The calculatedactual value is based on market prices.b) Loans and accounts receivableRefers to non-derivative financial assets with establishable payments that arenot listed on an active market. These are reported at accrued acquisitionvalue through application of the effective interest method, less any reservationsfor decline in value.The effective interest method distributes interest income and expense overthe period in question. The effective interest is the interest that exactlydiscounts the estimated financial deposits and payments at the booked netvalue of the financial asset or liability.Current receivables such as accounts receivable are considered to constitutea reasonable approximation of the actual value, which is why the current valueof these is not calculated. Reservations for doubtful receivables are madeafter testing in each individual case.c) Financial instruments held until maturityRefers to non-derivative financial assets with establishable payments andfixed terms that are held until maturity. These are reported at accrued acquisitionvalue through the application of the effective interest method.d) Financial assets that can be soldRefers to non-derivative assets intended for sale. These are valued at actualvalue directly against equity - excepting impairment expenses - until the assetis removed from the balance sheet when the profit or loss is reported in theincome statement.e) Financial liabilitiesThe financial liabilities held during the year are valued at the accrued acquisitionvalue through application of the effective interest method. Currentliabilities such as accounts payable are considered to constitute a reasonableapproximation of the actual value, which is why the current value of these isnot calculated.f) Liquid assetsLiquid assets are cash and immediately available credit in banks and similarinstitutions, plus current liquid investments with a term of less than threemonths from the date of acquisition.Financial risk managementPrinciples for fi nancing and fi nancial risk managementThe Board controls and monitors <strong>BTS</strong>' financing activities and financial risks.Financing and risk management have been collated under the Group financefunction. The aim of the company’s risk management is to optimize theconsolidated capital expenses and, in a carefully thought-out manner, to manageand control the consolidated financial risks. Hedging instruments maybe used within set parameters. Future payments are not normally hedged.Investments of liquid assets may be made in interest-bearing accounts or ininterest-bearing securities with a low credit risk. The remaining term of theinvestment portfolio must not exceed nine months.<strong>BTS</strong> <strong>Annual</strong> <strong>Report</strong> <strong>2006</strong>51
Currency risksThe Group is exposed to currency risks linked to the translation of overseassubsidiaries, which influences the consolidated results and shareholders'equity. The currencies that have the greatest influence are USD, EUR andGBP. Transaction exposure is limited as income and expense are primarily inthe same currency on the various markets. <strong>BTS</strong> does not normally hedge itscurrency exposure.Counterparty risks<strong>BTS</strong> only accepts creditworthy counterparties in financial transactions.<strong>BTS</strong>’ accounts receivable are spread among a large number of companiesoperating in a variety of sectors.Liquidity and interest risks<strong>BTS</strong> policy is to allow borrowing pursuant to the Board's approval. Excessliquidity in subsidiaries is initially to be used to amortize loans. Interest risksare limited to the fluctuating yield on the liquid assets invested at variablerates.Transactions in foreign currenciesItems covered in the financial statements for the Group companies are valuedin the currency that is used where each respective subsidiary conducts itsmain business activities (functional currency). Swedish krona (SEK), theparent company's functional currency and reporting currency, is used in theconsolidated accounts.Receivables and liabilities in foreign currency are valued at the exchange rateon the balance sheet date, with any exchange rate differences being takento income. Exchange rate differences concerning operating receivables andliabilities are reported in the operating profit/loss, while exchange rate differencesattributable to financial assets and liabilities are reported as financialincome and expenses.Cash flow statementThe cash flow statement is prepared using the indirect method. The reportedcash flow only includes transactions that result in payments being made orreceived. Cash flow is reported divided among current operations, investingactivities and financing activities.The category of liquid assets includes, apart from cash and bank balances,short-term financial investments that are only exposed to insignificant risk ofvalue fluctuations, or traded on the open market for known amounts, or thathave a remaining maturity term of less than three months from the balancesheet date.NOTE 3 - Distribution of net turnover and distribution ofnet profit per operative unitNet turnover per operative unit, SEK thousands <strong>2006</strong> 2005The GroupNorth America* 245,173 176,222Europe 113,044 88,629Other markets 20,880 21,268Total 379,097 286,119* North America<strong>BTS</strong> 201,511 176,222APG and RLC 43,662 -Total 245,173 176,222Operating profi t per operative unit, SEKthousands<strong>2006</strong> 2005North America* 40,449 27,144Europe 18,577 17,918Other markets 3,330 3,635Total 62,355 48,696* North America<strong>BTS</strong> 35,589 27,144APG and RLC 4,860 -Total 40,449 27,144NOTE 4 - Transactions with affiliated companiesPurchasing and sales between Group companiesMarket terms and conditions apply to the supply of services between subsidiaries.No transactions have been completed with other affiliates.Parent companyOf the parent company’s total purchasing expenses and sales income, 0 (0)percent refers to purchasing and 100 (100) percent to sales to other Groupcompanies.NOTE 5 - Information about auditors' feesFees and remuneration, SEK thousands The Group Parent company<strong>2006</strong> 2005 <strong>2006</strong> 2005ÖhrlingsPricewaterhouseCoopersAudit assignments 418 471 198 298Other assignments - - - -Other auditorsAudit assignments 335 229 - -Other assignments 90 144 - -843 844 198 298NOTE 6 - Leasing and rental agreementsThe GroupThe Group has no financial leasing contracts. The expense of operationalleasing contracts amounts to 12,287 (10,784) for the year. Future leasing andrental fees concerning operational leasing contracts with maturity terms inexcess of one year amount to:SEK thousands2007 16,8542008 6,3982009 4,2192010 558Thereafter -Total 28,02952 <strong>BTS</strong> <strong>Annual</strong> <strong>Report</strong> <strong>2006</strong>
NOTE 7 - Exchange rate differencesSEK thousands The Group Parent company<strong>2006</strong> 2005 <strong>2006</strong> 2005Exchange rate differences haveimpacted operating profi t by: -1,997 1,649 -53 42NOTE 8 - Average number of employees, salaries, otherremuneration and social security expenses etc.1) Average number of employees<strong>2006</strong> 2005The GroupNo. ofemployeesOf whichmenNo. ofemployeesOf whichmenSubsidiariesSweden 30 17 32 21US 83 57 74 53UK 10 7 11 8Other 42 31 26 20Total for the Group 165 112 143 102Gender distribution among senior executivesCEO and other Senior Executives (excl.the Board)<strong>2006</strong> 2005Women Men Women Men0 5 0 5The Board 1 4 1 4In this context, “other senior executives” refers to the four people who togetherwith the CEO, constitute the Group management.Parent companyThe parent company had no employees in <strong>2006</strong>.2) Salaries, other remuneration, and social security expensesSEK thousands <strong>2006</strong> 2005The Group Salaries andSalaries andremunerationremunerationSocial securityexpensesof which pensionexpensesSocial securityexpensesof which pensionexpensesSubsidiaries 141,275 23,536 118,957 19,4007,213 5,471Pension expenses for employees who hold the position of CEO or memberof the Board of a Group company total 1,681 (1,400). All pension plans aredefined-contribution plans.Parent companyFees amounting to 575 (488) have been paid to Board members, of which241 (195) was remuneration to the Chairman of the Board. No parent companyBoard member has received any remuneration other than Board fees.For the CEO, see the figures for remuneration for senior executives below.3) Salaries and other remuneration by country and divided betweenBoard members, etc. and other employeesSEK thousands <strong>2006</strong> 2005The GroupIn SwedenThe Boardand CEOOtheremployeesThe Boardand CEOOtheremployeesThe parent company 575 - 488 -Subsidiaries 1,631 16,952 1,532 19,397Total, Sweden 2,206 16,952 2,020 19,397Outside SwedenUS 7,761 81,830 6,928 68,413UK 2,301 6,533 2,741 5,699Other 5,820 17,871 5,328 8,431Total, outside Sweden 15,882 106,234 14,997 82,543Total for the Group 18,088 123,186 17,017 101,940Remuneration to senior executives“Other senior executives” refers to the four (four in 2005) people whotogether with the CEO constitute the Group management team. This sumincludes basic salary, other benefits, variable remuneration and pension expenses.“Other benefits” refers exclusively to company cars. The total sum ofremuneration paid to senior executives was KSEK 15,112 (15,121), of whichpension expenses accounted for KSEK 1,505 (1,606). All pension plans aredefined-contribution plans.Salary and other benefits amounting to KSEK 3,255 ( 3,231) have been paidto the CEO, KSEK 998 (923) of which was variable remuneration. Variableremuneration is calculated using a model that triggers payment when theGroup result exceeds predefined profitability targets. The CEO has a definedbenefit pension entitlement amounting to 25 (25) percent of the fixed salary,which is paid in the form of pension insurance with the right to a pension fromthe age of 65. The CEO’s employment contract states a mutual period ofnotice of six months. In addition, in the event of the company terminating hisemployment contract, the CEO is entitled to a severance package correspondingto 12 monthly salary payments. None of the other senior executivesare entitled to a severance package. Other senior executives have been paidsalaries and other benefits totaling KSEK 10,352 (10,284), of which variableremuneration accounted for KSEK 5,076 (5,334). Variable remuneration isbased on targets achieved for the company and the individual. Provisions topensions are made individually in the range of 13–30 percent of the fixedsalary and paid in the form of pension insurance with entitlement to a pensionfrom the age of 65.Share-related remunerationThe <strong>BTS</strong> Group issued employee stock options to the Group’s employees in<strong>2006</strong>. The employee stock option plans comprise a maximum of 840,000employee stock options, entitling employees in the US to acquire a maximumof 495,000 Class B shares and employees in other countries including Swedena maximum of 345,000 Class B shares.<strong>BTS</strong> <strong>Annual</strong> <strong>Report</strong> <strong>2006</strong>53
Each employee stock option allocated to employees in the US gives theholder the right to acquire one Class B share in <strong>BTS</strong> at an exercise price ofSEK 46.50. Each employee stock option allocated to employees in othercountries including Sweden gives the holder the right to acquire one Class Bshare in <strong>BTS</strong> at an exercise price of SEK 55.00. Each employee stock optionhas a maturity term of four years. The options are restricted in utilization,which means that they become gradually utilizable over a three-year periodafter allocation, normally by 1/3 of the total number of allocated optionsper year, provided that certain members of the company’s Board show thatestablished financial goals have been attained. Utilization of employee stockoptions requires in principle that the employee continues to be employed bythe company.Changes in the number of outstanding options and their average exerciseprice is as follows:3.3 percent for maturity terms of 2, 3 and 4 years respectively. To be able toimplement the employee stock option plans in a expense-effective, flexiblemanner and cover accruing expenses, mainly security expenses, it was alsodecided at the AGM on April 7, <strong>2006</strong> that a directed new issue of warrants in<strong>BTS</strong> Sverige AB, 556566-7127, would be carried out. This gave entitlementto subscription of a maximum of 943.500 Class B shares, with <strong>BTS</strong> Sverigehaving the right and obligation to transfer or in some other way dispose ofwarrants to secure the company’s obligations and cover accruing expensesdue to the employee stock option plans.Assuming that all warrants as above are utilized for subscription of newshares, the company’s share capital will increase by 314,500 and give rise todilution corresponding to a maximum of approximately 5 percent of the sharecapital and a maximum of approximately 4 percent of the number of votes forall shares.Average exerciseprice pershare, SEK<strong>2006</strong> 2005Options(thousands)Average exerciseprice pershare, SEKOptions(thousands)As at January 1 - - - -Allocated 50.21 784 - -As at December 31 50.21 784 - -The utilization of employee stock options may occur after the options havebecome utilizable during the following periods:• 05-01-2007—05-31-2007• 11-01-2007—11-30-2007• 05-01-2008–05-30-2008• 11-03-2008—11-28-2008• 05-01-2009—05-29-2009• 11-02-2009—11-30-2009• 02-22-2010—03-19-2010A maximum of 24,300 employee stock options per person may be allocatedto senior executives and 9,000 per person to other employees. A smallnumber of senior executives in the US may however be allocated a maximumof 99,000 options per person. No individual shall be guaranteed allocationof employee stock options. Board members appointed at the AGM who arenot employees of the company or another Group company, or the CEO of theparent company, shall not be allocated any options. On allocation of employeestock options, employees’ performance and position, along with their significancefor the future development of <strong>BTS</strong>, shall be taken into account.Expenses, primarily social security expenses, arise from the utilization ofemployee stock options as regards employees outside the US. The Americanoptions are so-called ISO options, which means that these, under currentlegislation, are not subject to social security expenses. The social security expensesattributable to employee stock options allocated to employees outsidethe US are expensed on a running basis concurrently with growth in the shareprice during the maturity term of the options.NOTE 9 - Intangible fixed assetsSEK thousands 12-31-<strong>2006</strong> 12-31-2005The GroupGoodwillOpening accumulated acquisition value 35,683 3,744Opening impairment expenses - -Purchasing 116,946 31,939Translation difference -2,756 -Closing accumulated acquisition value 149,873 35,683Closing booked value 149,873 35,683Other intangible fixed assetsSEK thousands 12-31-<strong>2006</strong> 12-31-2005Franchise-holder contractsOpening accumulated acquisition value - -Purchasing 8,497 -Translation difference - -Closing accumulated acquisition value 8,497 -Opening accumulated depreciation - -Depreciation for the year 153 -Translation difference - -Closing accumulated depreciation 153 -Closing booked value 8,344 -The value of the employee stock options was calculated by applying Black &Schole’s valuation model based on the share price and other market conditionsexisting as at May 5, <strong>2006</strong>, without taking limitations on the right of disposalinto account. In view of performance-related conditions and assumingan annual staff turnover of 5 percent, the accounting expense was estimatedat a total of MSEK 3.4, which in line with IFRS 2 is annually periodized duringthe period of service . Other important data to be input in the model arethe price paid on the allocation date (SEK 42.30), the above exercise price,volatility of 30 percent, anticipated dividend of SEK 0.92 (and thereafterdividend growth of 10 percent per year) and risk-free interest of 3.0, 3.2 and54 <strong>BTS</strong> <strong>Annual</strong> <strong>Report</strong> <strong>2006</strong>
SEK thousands 12-31-<strong>2006</strong> 12-31-2005Products, technology and softwareOpening accumulated acquisition value 12,644 -Purchasing 18,714 12,644Translation difference -1,595 -Closing accumulated acquisition value 29,763 12,644Opening accumulated depreciation 2,012 -Depreciation for the year 4,090 2,012Translation difference -268 -Closing accumulated depreciation 5,834 2,012Closing booked value 23,929 10,632SEK thousands 12-31-<strong>2006</strong> 12-31-2005Customer contractsOpening accumulated acquisition value 1,973 -Purchasing 2,328 1,973Translation difference -235 -Closing accumulated acquisition value 4,066 1,973Opening accumulated depreciation 186 -Depreciation for the year 527 186Translation difference -21 -Closing accumulated depreciation 692 186Closing booked value 3,374 1,785SEK thousands 12-31-<strong>2006</strong> 12-31-2005BrandsOpening accumulated acquisition value 2,878 -Purchasing 7,226 2,878Translation difference -342 -Closing accumulated acquisition value 9,762 2,878Opening accumulated depreciation - -Depreciation for the year 196 -Translation difference - -Closing accumulated depreciation 196 -Closing booked value 9,566 2,878Total closing booked value Otherintangible fi xed assets 45,213 15,296Impairment testGoodwill and other intangible assets are distributed between the cash-generatingunits expected to benefit from the synergies of the acquisition. Therecovery values are based on the utilization value, calculated as the currentvalue of future growth and earnings forecasts over a four-year period, andon extrapolated cash flows beyond the four-year period. Impairment tests areinitially performed solely on the acquired cash-generating unit. If it transpiresthat the amount reported exceeds the utilization value of the unit, the test isperformed on the primary segments amongst which goodwill was distributed.Material assumptions used to calculate utilization values:- Budgeted operating margin- Growth rate to extrapolate cash flows beyond the budget period- Discount rate applied for estimated future cash flows.The budgeted operating margin has been established based on previousearnings and expectations of future market development. To extrapolate cashflows beyond the budget period, a growth rate of 5 percent has been usedfor all cash-generating units, which is judged to be a conservative estimate.Furthermore, an average discount rate in local currency after tax was usedfor the calculations. Taken together the discount rate used is in the interval of9.5 – 11 percent.The impairment tests conducted show that there is no indication of a need forimpairment as per December 31, <strong>2006</strong>.A sensitivity analysis has been carried out for each cash-generating unit, theresults of which are given below:- If the estimated operating margin beyond the budget period was 10 percentlower than the basic assumption, the overall recovery value would decreaseby 11 percent.- If the estimated growth rate to extrapolate the cash flows beyond thebudget period had been 10 percent lower than the basic assumption of5 percent, the overall recovery value would decrease by 7 percent.- If the estimated weighed capital expense used for the discounted cashflows for the Group had been 10 percent higher than the basic assumption of9.5 – 11 percent, the overall recovery value would decrease by 17 percent.The estimates are hypothetical and should not be seen as an indication ofthese factors being more or less likely to change. The sensitivity analysisshould therefore be interpreted with caution. None of the hypothetical casesabove would cause a need for impairment in an individual cash-generating unit.Distribution by segment of goodwill and other intangible assetsSEK thousands 12-31-<strong>2006</strong>The GroupNorthOtherAmerica Europe markets TotalGoodwill 128,904 20,969 - 149,873Products, technology 22,097 1,832 - 23,929& softwareFranchise-holder8,344 - - 8,344contractsCustomer contracts 3,200 174 - 3,374Brands 8,705 862 - 9,566171,250 23,837 - 195,086SEK thousands 12-31-2005The GroupNorthAmericaEuropeOthermarketsTotalGoodwill 13,533 22,150 - 35,683Products, technology 7,394 3,238 - 10,632& softwareFranchise-holder- - - -contractsCustomer contracts 1,149 636 - 1,785Brands 1,845 1,033 - 2,87823,920 27,057 - 50,978<strong>BTS</strong> <strong>Annual</strong> <strong>Report</strong> <strong>2006</strong>55
NOTE 10 - Tangible fixed assetsSEK thousands 12-31-<strong>2006</strong> 12-31-2005The GroupEquipmentOpening accumulated acquisition value 14,947 8,990Purchasing 2,482 5,366Sales and disposals -321 -437Translation difference -1,213 1,028Closing accumulated acquisition value 15,895 14,947Opening accumulated depreciation 9,512 6,800Sales and disposals -321 -282Depreciation for the year 2 030 2,249Translation difference -705 745Closing accumulated depreciation 10,515 9,512Closing booked value 5,380 5,435NOTE 11 - <strong>Report</strong>ing by segmentThe GroupPrimary segmentThe Group’s operations are governed and reported primarily per geographic market, based on the location of the responsible operative unit, which itselfprimarily develops and supplies the solutions sold on the relevant markets. However, this does not apply to web solutions designed by <strong>BTS</strong> Interactive. Billingof services between the operative units is done by billing time expended as per market conditions. Shared Group expenses are invoiced, and amortization ofintangible assets is distributed.SEK thousands <strong>2006</strong> 2005 <strong>2006</strong> 2005 <strong>2006</strong> 2005 <strong>2006</strong> 2005 <strong>2006</strong> 2005NorthEurope 2) OtherAmerica 1) markets 3)Elimination &undistributedIncomeExternal sales 245,173 176,222 113,044 88,629 20,880 21,268 379,097 286,119Internal sales 2,836 649 20,919 19,292 2,570 214 -26,325 -20,156 - -Total income 248,008 176,872 133,963 107,922 23,450 21,482 -26,325 -20,156 379,097 286,119TheGroupOperating profi t 40,449 27,144 18,577 17,918 3,330 3,635 62,355 48,696Financial income 927 6,456 927 6,456Financial expenses -2,276 -95 -2,276 -95Tax on profi t for the year -22,421 -18,281 -22,421 -18,281Profi t for the year 38,584 36,777Other informationAssets 296,868 118,633 67,492 90,915 14,329 15,030 11,379 13,395 390,068 237,973Liabilities 102,137 55,439 18,215 22,498 2,708 5,201 91,837 2,962 214,897 86,099Investments 138,265 29,113 1,986 12,620 300 649 140,551 42,382Depreciation tangible fi xed assets 1,080 571 706 939 342 262 2,128 1,772Amortization intangible fi xed assets 4,127 1,652 1,143 451 - - 5,270 2,1031) External sales, of which <strong>BTS</strong> 201,511 (176,222), and APG & RLC 43,662 (0).2) External sales, of which the Nordic region 41,827 (47,199), UK 34,964 (32,431), Spain 12,988 (8,999 ) BGF 11,884 (0) and Brussels 11,379 (0).3) External sales, of which Australia 15,189 (16,263), and South Africa 5,691 (5,005).As the Group’s operations are only managed and reported per geographical market, no secondary segment is reported.56 <strong>BTS</strong> <strong>Annual</strong> <strong>Report</strong> <strong>2006</strong>
NOTE 12 - Financial itemsSEK thousands <strong>2006</strong> 2005The GroupInterest income 1,170 1,309Exchange rate gains 106 5,148Exchange rate losses -347 -927 6,457Interest expenses -2,277 -95Total profi t/loss from fi nancial items -1,350 6,362Parent companyProfi t from other securities and receivablestreated as fi xed assetsDividends from subsidiaries 12,189 8,384Interest income from subsidiaries 1,941 1,394Exchange rate gains 106 4,899Exchange rate losses -348 -13,888 14,677Interest income and similar profi t items 268 377Interest expenses and similar loss items -2,065 -Total profi t/loss from fi nancial items 12,092 15,054NOTE 13 - AppropriationsSEK thousands <strong>2006</strong> 2005Parent companyReversal of tax allocation reserve - 241Reconciliation of effective taxSEK thousands <strong>2006</strong> 2005The GroupProfi t before tax 61,006 55,058Tax expenses calculated according toSwedish income tax rates-17,082 -15,416Effect of different tax rates -5,582 -2,701Non-deductible expenses -175 -321Non-taxable income 447 2Tax attributable to previous years -30 155<strong>Report</strong>ed effective tax -22,421 -18,281Effective tax rate 36,8% 33,2%The increase in effective tax rate is attributed to the North American operativeunit's relatively higher share of the Group's profit due to the acquisitionscarried out in <strong>2006</strong>.SEK thousands <strong>2006</strong> 2005Parent companyProfi t before tax 12,101 15,337Tax expense calculated according to Swedishincome tax rates-3,388 -4,295Dividends from subsidiaries 3,390 2,348Non-deductible expenses -2 -1Non-taxable income - -<strong>Report</strong>ed effective tax - -1,948Effective tax rate 0.0% 12.7%NOTE 14 - Tax on profit for the yearSEK thousands <strong>2006</strong> 2005The GroupActual tax for the year -22,997 -18,372Deferred tax pertaining to temporary differences 576 91-22,421 -18,281Parent companyActual tax for the year -257 -1,948Tax effect of Group contribution 257 -- -1,948<strong>BTS</strong> <strong>Annual</strong> <strong>Report</strong> <strong>2006</strong>57
NOTE 15 - Earnings per shareThe Groupa) Before dilutionEarnings per share before dilution are calculated by dividing the profit attributableto the parent company's shareholders with the weighed averagenumber of outstanding common stock during the period.The year’s profi t attributable to the parentcompany’s shareholders, SEK thousandsAverage number of shares before dilution(thousands)<strong>2006</strong> 200538,531 36,64317,812 5,897Earnings per share, before dilution, SEK 2.18 2.07 1b) After dilutionIn calculating the earnings per share after dilution, the weighed averagenumber of outstanding common stock is adjusted for the dilution effect of allpotential common stock. The parent company has stock options as potentialstock with dilution effect. The stock options give rise to a dilution effect whenthe average price for common stock during the period exceeds the exerciseprice for the options.The year’s profi t attributable to the parentcompany’s shareholders, SEK thousandsAverage number of shares before dilution(thousands)<strong>2006</strong> 200538,531 36,64317,829 5,897Earnings per share, after dilution, SEK 2.18 2.07 11Previous years' earnings per share have been adjusted using a 0.3333 correctionfactor due to the 3:1 split in May <strong>2006</strong>.NOTE 16 - Financial fixed assetsParent companyParticipation in Group companiesParent company holdings:No. ofsharesProportionof equity, %Bookedvalue12-31-<strong>2006</strong>SEKthousandsBookedvalue12-31-2005SEKthousands<strong>BTS</strong> Sverige AB 5,000 100 7,838 7,838Company reg. no. 556566-7127Domicile: Stockholm<strong>BTS</strong> US, Inc. 1,000 100 78,396 52,071Company reg. no. 06-1356708Domicile: Connecticut<strong>BTS</strong> in London Ltd. 5,000 100 6,901 6,901Company reg. no. 577 1376 13Domicile: LondonBusiness Training Systems A/S 100 100 94 94Company reg. no. 957 694 187Domicile: OsloCatalysts for profi tabilityand growth Ltd1,000 100 1 1Company reg. no.1998/010779/07Domicile: Centurion<strong>BTS</strong> Finland AB 1,000 100 100 100Company reg. no. 556583-1673Domicile: Stockholm<strong>BTS</strong> Australasia Pty Ltd 45,050 90.1 234 234Company reg. no. 099 066 501Domicile: SydneyBusiness Training Solutions S.L. 1,031 100 7,443 7,526Company reg. no. B95138160Domicile: Bilbo<strong>BTS</strong> Management SA 1,000 100 673 673Company reg. no. 01 73.802 11Domicile: GenevaBusiness Game Factory Oy 90,750 100 3,154 3,154Company reg. no. 1807788-2Domicile: Helsinki<strong>BTS</strong> Brussels NV 620,000 100 587 587Company reg. no. 878.155.648Domicile: BrusselsTotal shares in subsidiaries 105,422 79,180Opening acquisition value 79,180 41,034Investment/Acquisition 26,242 38,146Closing acquisition value 105,422 79,18058 <strong>BTS</strong> <strong>Annual</strong> <strong>Report</strong> <strong>2006</strong>
NOTE 17 - Cash flow information and acquisitionsLiquid assetsThe definition of liquid assets is presented in the section entitled “Accountingprinciples” above. On the balance sheet date there was only cash in handand bank balance.SEK thousands The Group Parent company<strong>2006</strong> 2005 <strong>2006</strong> 2005Financial income and expensesInterest income 1,170 1,309 2,209 1,771Exchange rate gains 106 5,148 106 4,899Exchange rate losses -347 - -348 -927 6,457 1,967 6,670Interest expenses -2,277 -95 -2,065 --1,350 6,362 -98 6,670Acquisition of The Advantage Performance Group (APG) and TheReal Learning Company (RLC)<strong>BTS</strong> completed the acquisition of all business operations in The AdvantagePerformance Group (APG) and The Real Learning Company (RLC) onSeptember 25, <strong>2006</strong>. The acquisitions of APG and RLC have provided <strong>BTS</strong>with some of the US's most experienced individuals in the training sectoralongside a vast Fortune 1000-heavy client base in the US.Through RLC, <strong>BTS</strong> gains access to a high-qualitative product portfolio thatconcentrates on sales and leadership development, as well as developmentresources in areas where <strong>BTS</strong> aims to grow. APG's franchise organizationconsists of the equivalent of 35 fulltime sales representatives and productexperts that work exclusively with APG's portfolio of training products. Inaddition, APG has access to over 100 qualified instructors who are in chargeof carrying out the projects.Integration activities proceeding according to plan with early synergiesIntegration of the acquired companies, APG and RLC, generated two newcontracts during Q4 <strong>2006</strong> through coordinated sales activities betweenRLC/APG and <strong>BTS</strong>' sales organizations. Contracts were signed for a totalvalue exceeding MSEK 2.The internal climate among <strong>BTS</strong> and APG/RLC's employees is optimistic andthe respective corporate cultures have proven to be a good match. <strong>BTS</strong> hasallocated earmarked resources to train all company units' account managersin identifying new business opportunities that the expanded product portfoliooffers and to provide sales support in executing new business. During theperiod, <strong>BTS</strong> initiated several negotiations with many of the company's keycustomers about how <strong>BTS</strong> can fulfill and supply solutions to meet more oftheir current and future needs. <strong>BTS</strong> implemented a close, smoothly operatingcollaboration with APG and RLC in order to offer training and support for<strong>BTS</strong>' solutions, too.Many of the essential basic conditions for the acquisition of APG and RLChave been confirmed. The companies complement each other. Only 10% ofthe respective client bases overlap, corresponding to 20 of the 200 leadingUS-based companies included in RLC and APG's client bases. Examplesof key clients of APG and RLC include: Toyota, UPS, Bristol-Myers Squibb,American Express, Wells Fargo, Ingersoll-Rand, Daimler-Chrysler, Genetech,Catholic Health and Insight.The acquisition's effect on earnings and fi nancial positionThe acquired companies contributed MSEK 43.7 in income and MSEK 4.9 inoperating profit to the <strong>BTS</strong> Group for the period September 25 –December 31, <strong>2006</strong>.The year's increase in goodwill and other intangible fixed assets in the consolidatedbalance sheets is solely attributable to these acquisitions and a minoradjustment of the forecasted final supplementary purchase price relatedto the earlier acquisition of the Spanish company I-Simco S.L. in 2003.The information provided below for corporate acquisitions is insignificantfrom an individual perspective, which is why the details are presented in anaggregated form.Purchase price and fi nancing; acquisition analysis and goodwill<strong>BTS</strong> acquired all business operations included in APG and RLC, including allintellectual property rights and USD 1.7 million in net current assets withoutassuming any interest-bearing liabilities. An external market valuation of theacquired assets was conducted in conjunction with the acquisition.The agreed purchase price includes:• USD 2 million in a new issue of 356,400 Class B <strong>BTS</strong> shares directed atsales representatives at a subscription price of SEK 40.93. The issue wascarried out in line with the authorization from the last AGM. The shares arecovered by a 26–30 month lock-up clause. The new issue was carried outduring Q4, <strong>2006</strong>.• Final cash payment corresponding to USD 17.1 million, of which USD 11.8million is currently financed by external lenders in USD. The remaining USD5.3 million was financed from <strong>BTS</strong>' own cash and bank balance.• The supplementary purchase price for a maximum USD 4 million is pursuantto APG and RLC achieving set financial targets in <strong>2006</strong> and 2007. As perDecember 31, <strong>2006</strong>, sales representatives had realized the target for <strong>2006</strong>that gives entitlement to a supplementary purchase price of USD 1 million,which will be settled during Q1, 2007.Information about the purchase price and goodwill at the time of acquisitionconverted to closing day rate, December 31, <strong>2006</strong>:SEK thousands- paid in cash 116,427- direct expenses linked to the purchase 5,945- actual value of issued shares 14,587- anticipated supplementary purchase price 27,490Total purchase price 164,449Actual value of net assets acquired -46,983Goodwill 117,466Goodwill consists of expected future synergy effects generated by a broaderrange of products and services. In addition to synergy effects, employees andfuture profitability are also components in the goodwill item.The final acquisition analysis is adjusted due to the final valuation of assetsand liabilities, as well as the drop in the USD exchange rate from September–December<strong>2006</strong>. <strong>Report</strong>ed goodwill is therefore reduced by MSEK 15.7compared with the reported value in the interim report as per September 30,<strong>2006</strong>.<strong>BTS</strong> <strong>Annual</strong> <strong>Report</strong> <strong>2006</strong>59
Information about acquired assets and liabilities per September 25,<strong>2006</strong>, converted to closing day rate per December 31, <strong>2006</strong>.SEK thousandsActual valueAcquiredreported valueTangible fi xed assets 133 133Intangible fi xed assets;Franchise-holder contracts 8,497 -Customer contracts 2,328 -Products, technology and software 18,714 -Brands 7,226 -Accounts receivable and other receivables 31,405 31,405Accounts payable and other liabilities -21,320 -21,320Net assets 46,983 10,218The aquisitions’ impact on Group’s liquid assetsSEK thousands <strong>2006</strong> 2005Purchase price including acquisition expenses -122,372 -3,154Supplementary purchase price, <strong>BTS</strong> Spain -1,109 -2,715Liquid assets in companies acquired - 332Impact on Group’s liquid assets -123,481 -5,537Supplementary purchase price, <strong>BTS</strong> SpainInternet Simulations Consulting, S.L., renamed Business Training SolutionsS.L., was acquired on July 1, 2003. The initial purchase price was paid withliquid assets, in part on acquisition and in part through a performance-basedsupplementary purchase price in 2003. Additional supplementary purchaseprices were paid in 2004, 2005 and <strong>2006</strong>; please refer to the above table.The 2005 supplementary purchase price includes both the supplementarypurchase price for 2005 and the anticipated supplementary purchase pricefor <strong>2006</strong>. The <strong>2006</strong> supplementary purchase price includes the anticipatedfinal supplementary purchase price for <strong>2006</strong>. The anticipated supplementarypurchase prices have been set based on the assessment that the terms forsettlement will be fulfilled. See also the above table.NOTE 18 - Deferred tax receivables and tax liabilitiesSEK thousands <strong>2006</strong>-12-31 2005-12-31The GroupDeferred tax assetsDeferred tax assets that can be utilized within12 monthsDeferred prepaid tax that can be utilized aftermore than 12 months818 -467 477Total deferred tax assets 1,285 477No deferred tax liabilities have been reported for temporary differences attributableto shares and participations in subsidiaries as <strong>BTS</strong> can control thetime for repayment of these temporary differences, and it is likely that suchrepayments will not take place within the foreseeable future.NOTE 19 - Prepaid expenses and accrued incomeSEK thousands 12-31-<strong>2006</strong> 12-31-2005The GroupAccrued income 13,354 7,501Prepaid rent 753 663Other items 6,125 3,986Total 20,233 12,150SEK thousands 12-31-<strong>2006</strong> 12-31-2005Parent companyOther items 114 116NOTE 20 - Shareholders' equity<strong>BTS</strong>' <strong>Annual</strong> General Meeting held on April 7, <strong>2006</strong> approved a share splitin which three new shares are issued for each old share (3:1 split). Thenumber of shares before the split totaled 5,897,300 with the total amountingto 17,691,900 after the split. Monday, May 8, <strong>2006</strong>, was the first tradingday for <strong>BTS</strong> shares after the split. A directed new share issue for 356,400Class B shares to the sellers of the acquired companies, APG and RLC,was carried out during 4Q <strong>2006</strong>. The issue was carried out in line with themandate issued at the last AGM. The shares are covered by a 26–30 monthlock-up clause. After the new issue, the number of shares totals 18,048,300.The share capital consists of 853,800 Class A shares and 17,194,500 ClassB shares, totaling 18,048,300 shares at a quotient value of SEK 6,016,100.Each share has a quotient value of SEK 0.33. Each Class A share gives ten(10) votes per share, and each Class B share gives one (1) vote per share.Exchange rate differences - The GroupClosing accumulated exchange rate differences booked directly againstequity amount to SEK -21,522. Opening accumulated differences amount to-6,384. The changes are the result of translation of foreign subsidiaries.The GroupIn connection with the conversion to IFRS, the form of presentation ofshareholders’ equity in the balance sheets was altered. According to previousaccounting principles, shareholders' equity was divided into restrictedand non-restricted equity in line with the regulations in the Swedish <strong>Annual</strong>Accounts Act. In accordance with IAS 1, shareholders' equity is to insteadbe divided into the sub-components of which it is comprised. The Group haschosen to specify shareholders’ equity in accordance with the list below:• Share capital• Other contributed capital• Reserves• Profits carried forward• Minority interestsThe “share capital” item comprises the registered share capital of the parentcompany.“Other contributed capital” comprises capital generated through transactionswith the shareholder base. The transactions carried out with the shareholderbase consists of issues to the premium reserve up to and including December31, 2005.Reserves comprises the translation differences attributable to the translationof overseas subsidiaries and other restricted reserves in the parent company,such as the reserve fund.60 <strong>BTS</strong> <strong>Annual</strong> <strong>Report</strong> <strong>2006</strong>
The “Profits carried forward” item corresponds to the accumulated profitsgenerated in the Group and that part of the premium reserve fund transferredin line with the decision by the AGM in 2005 as well as the paid-in surplusattributable to the year's acquisition of APG and RLC.The “Minority interests” item comprises the minority interest in the total shareholders’equity of <strong>BTS</strong> Australasia PTY Limited.Parent companyIn 2005, the Swedish <strong>Annual</strong> Accounts Act (ÅRL) was changed as a consequenceof the new Swedish Companies Act (ABL). Shareholders’ equity inlegal entities is to be presented as previously to show restricted and non-restrictedshareholders’ equity. However, premium reserve funds created beforeDecember 31, 2005 are to be converted into reserve funds, which the parentcompany is to book in the balance sheets at December 31, 2005.NOTE 21 - Financial instruments and financialrisk managementDuring the year, <strong>BTS</strong>’s holdings of financial instruments have been limited toprimary instruments such as accounts receivables, accounts payable and thelike. Customer contracts contain no currency clauses or anything of the kindtermed embedded derivatives. No hedging instruments are held, have beenpurchased or sold during the year. For more information in line with a)-e)below, refer to Note 2 under Accounting Principles.a) Financial assets valued at actual value via the income statement.<strong>BTS</strong> had no assets in this category in <strong>2006</strong>b) Loans and accounts receivable<strong>BTS</strong> had no non-derivative financial assets with establishable payments thatare not listed on an active market in <strong>2006</strong>. Current receivables such as accountsreceivable are considered to constitute a reasonable approximationof the actual value, which is why the current value of these is not calculated.Reservations for doubtful receivables are made after testing in each individualcase.c) Financial instruments held until maturity<strong>BTS</strong> had no assets in this category in <strong>2006</strong>d) Financial assets that can be sold<strong>BTS</strong> had no assets in this category in <strong>2006</strong>e) Financial liabilitiesThe financial liabilities held during the year are valued at the accrued acquisitionvalue through application of the effective interest method. Currentliabilities such as accounts payable are considered to constitute a reasonableapproximation of the actual value, which is why the current value of these isnot calculated.Actual value of financial assets and liabilitiesSEK thousands 12-31-<strong>2006</strong> 12-31-<strong>2006</strong>The Group <strong>Report</strong>ed value Actual valueOther long-term receivables 1,968 1,968Accounts receivable 88,370 88,370Reservations for doubtful accounts receivable -323 -323Other current receivables 14,015 14,015Total fi nancial assets 104,030 104,030Other long-term liabilities 388 388Accounts payable 13,446 13,446Other current liabilities 87,473 87,473Total fi nancial liabilities 101,306 101,306Currency risksThe Group is exposed to currency risks linked to the translation of overseassubsidiaries, which influences the consolidated results and shareholders' equity.The currencies that have the greatest influence are USD, EUR and GBP.The sensitivity analysis below shows the effect on the operating result basedon <strong>BTS</strong>’ <strong>2006</strong> income statement and should only be seen as an indication ofthe significance of the different currencies.FactorsChange in Change, full-yearpercentage <strong>2006</strong>, SEK thousandsSEK/USD +/-10% -/+ 4,488SEK/EUR +/-10% -/+ 419SEK/GBP +/-10% -/+ 672Counterparty risks<strong>BTS</strong> only accepts creditworthy counterparties in financial transactions.<strong>BTS</strong>’s accounts receivable are spread among a large number of companiesoperating in a variety of sectors.The maximum credit risk amounts to SEK 5,517 thousands (3,079) at theend of the year, which corresponds to the largest credit exposure to any onegroup.Liquidity and interest risksThe liquidity risk is small as liquid assets only amount for 18 percent (43) ofthe balance sheet total. <strong>BTS</strong>’ policy is to allow borrowing with the approvalof the Board. Excess liquidity in subsidiaries is initially to be used to amortizeloans. Interest risks are limited to the fluctuating yield on the liquid assetsinvested at variable rates.<strong>BTS</strong> <strong>Annual</strong> <strong>Report</strong> <strong>2006</strong>61
NOTE 22 - Bank overdraft facilitiesNOTE 24 - Pledged assetsSEK thousands 12-31-<strong>2006</strong> 12-31-2005The GroupApproved credit 109,995 15,964Unutilized share -29,104 -15,964Utilized credit amount 80,891 -SEK thousands 12-31-<strong>2006</strong> 12-31-2005Parent companyApproved credit 94,841 -Unutilized share -13,949 -Utilized credit amount 80,891 -SEK thousands 12-31-<strong>2006</strong> 12-31-2005The GroupPledged assets for liabilities to credit institutionsCompany mortgages 10,000 10,000NOTE 25 - Contingent liabilities for the benefit of GroupcompaniesSEK thousands 12-31-<strong>2006</strong> 12-31-2005Parent companyGuarantee commitment for the benefi t ofsubsidiaries3,866 4,473NOTE 23 - Accrued expenses and prepaid incomeSEK thousands 12-31-<strong>2006</strong> 12-31-2005The GroupAccrued salaries 37,317 34,659Accrued social security expenses 2,386 2,421Other items 19,391 16,06159,094 53,141SEK thousands 12-31-<strong>2006</strong> 12-31-2005Parent companyOther items 331 631Stockholm, Sweden, April 12, 2007Dag SehlinChairman of the BoardHenrik EkelundChief Executive OfficerMariana Burenstam Linder Tomas Franzén Stefan GardefjordMy audit report has been submitted on April 16, 2007Lars BerglundAuthorized public accountant62 <strong>BTS</strong> <strong>Annual</strong> <strong>Report</strong> <strong>2006</strong>
Auditor's reportTo the <strong>Annual</strong> General Meeting of <strong>BTS</strong> Group AB, Corporate Identity Number 556566-7119We have examined the <strong>Annual</strong> <strong>Report</strong>, the consolidated financial statements, the accounting records and the administration of theBoard of Directors and the CEO of <strong>BTS</strong> Group AB for the fiscal year <strong>2006</strong>. The Board of Directors and the CEO are responsiblefor the accounts and the administration, and for ensuring that the Swedish <strong>Annual</strong> Accounts Act is applied when preparing the annualaccounts. They are also responsible for making sure that the International Financial <strong>Report</strong>ing Standards (IFRS) as approvedby the EU and the Swedish <strong>Annual</strong> Accounts Act are applied in the preparation of the consolidated financial statements. Ourresponsibility is to express an opinion on the annual report, the consolidated financial statements and the administration based onour audit.We conducted our audit in accordance with generally accepted auditing standards in Sweden. This involved planning and performingour audit to obtain reasonable, but not absolute, assurance that the annual report and the consolidated financial statementsare free of material misstatement. An audit includes examining a selection of the documentation with respect to amounts andother information in the accounting records. An audit also includes assessing the accounting principles used and their applicationby the Board of Directors and the CEO, as well as evaluating the important assessments made by the Board of Directors and CEOwhen preparing the annual report and consolidated financial statements, and appraising the overall presentation of informationin the annual report and the consolidated financial statements. As a basis for our pronouncement on discharge from liability, weexamined significant decisions, actions taken and circumstances at the company in order to determine the possible liability to thecompany of any Board member or the Chief Executive Officer. We also examined whether any Board member or the CEO hasotherwise acted in contravention of the Swedish Companies Act, the <strong>Annual</strong> Accounts Act or the Articles of Association. We areof the opinion that our audit gives us reasonable grounds for our opinion, presented below.The annual report has been prepared in accordance with the Swedish <strong>Annual</strong> Accounts Act and provides a true picture of thecompany’s income and position in line with generally accepted accounting practice in Sweden. The consolidated financial statementshave been prepared in accordance with International Financial <strong>Report</strong>ing Standards (IFRS) as approved by the EU andwith the Swedish <strong>Annual</strong> Accounts Act, and provide a true picture of the Group’s income and position. The Directors' <strong>Report</strong> isconsistent with other sections of the annual report and the consolidated financial statements.We recommend that the <strong>Annual</strong> General Meeting adopts the income statement and balance sheets of the parent company andthe Group, appropriate the parent company's surplus as proposed in the Directors' <strong>Report</strong> and grant the Members of the Boardand CEO discharge from liability for the fiscal year.Öhrlings PricewaterhouseCoopers ABStockholm, Sweden, March 16, 2007Lars BerglundAuthorized public accountant<strong>BTS</strong> <strong>Annual</strong> <strong>Report</strong> <strong>2006</strong>63
Board of directors and auditors1 234 51. Henrik Ekelund2. Stefan Gardefjord3. Tomas Franzén4. Mariana Burenstam Linder5. Dag SehlinHenrik EkelundGeneva, born 1955Chief Executive Offi cer and President of <strong>BTS</strong>Group AB.Shares and options in <strong>BTS</strong> Group AB: 816,000Class A shares and 3,151,616 Class B shares.Henrik Ekelund is the founder of <strong>BTS</strong> and hasbeen President of the company since the startin 1986.He has extensive experience as a previousBoard member and owner of growth companiesincluding Jobline AB, Image Publications AB,Strandfastigheter AB (now called Klövern AB)and Universum AB. Henrik Ekelund has an MScfrom the Stockholm School of Economics.Stefan GardefjordTäby, born 1958Member of the Board of <strong>BTS</strong> Group AB since2003. President WM-data Sverige AB.Other assignments: Board member, WM-dataSverige AB.Shares and options in <strong>BTS</strong> Group AB: 3000Class B shares.Since 1987, Stefan Gardefjord has held anumber of senior executive positions within theWM-data Group. including president of varioussubsidiaries, business area manager and groupexecutive for marketing, sales and information.In 2001, he was CEO and President of M2SSverige AB. Previous positions include Headof Consultancy for Consab Consult AB, beforewhich he worked in the finance and IT departmentsof Dow Chemical AB.Tomas FranzénNacka, born 1962Member of the Board of <strong>BTS</strong> Group AB since2000. President and CEO of Eniro AB.Other assignments: Member of the Board,Eniro AB, OEM International AB and SecuritasSystems AB.Shares and options in <strong>BTS</strong> Group AB: 15,000Class B shares.Tomas Franzén has years of experience fromkey positions at several companies. His previouspositions include CEO and President of SongNetworks Holding AB, CEO of AU-System, andVP Sales for Nokia Data/ICL Data AB. TomasFranzén has an MSc (Industrial Economics) fromLinköping Technical College.Mariana Burenstam LinderDanderyd, born 1957Member of the Board of <strong>BTS</strong> Group AB since2004. Managing Partner of Burenstam & PartnersAB.Other assignments: Chairman of the Board,Kontanten AB and the Sweden-America Foundation.Member of the Board, TietoEnator Oyand SäKi AB.Shares and options in <strong>BTS</strong> Group AB: 12,100Class B shares.Mariana Burenstam Linder has broad experiencefrom senior positions with a number of Swedishcompanies. Her previous positions includeCEO of Ainax, President of Enskilda Bankenand Global Executive for Private Banking, VicePresident of SEB, IT Manager for Trygg-Hansaand, subsequently, the SEB Group, CEO of ABBFinancial Consulting and CEO of Nordic ManagementAB. Mariana Burenstam Linder has anMSc from the Stockholm School of Economics.Dag SehlinBromma, born 1945. Chairman of the Board of<strong>BTS</strong> Group AB since 2003.Other assignments: Member of the Board, D.Carnegie & Co. AB, Carnegie Investment BankAB, Carnegie ASA, Tredje AP-fonden and Pro-Act IT Group AB, and of AB Piccola (which heowns) and its wholly-owned subsidiary FörvaltningMadape AB.Shares and options in <strong>BTS</strong> Group AB: 6,000Class B shares and 3,000 Class B shares viacompany.Dag Sehlin has extensive experience from leadingpositions in the Swedish financial sector. Hehas worked as a consultant since 1997. Previouspositions include CFO and Deputy CEO ofPosten AB, and Vice CEO of OM-Gruppen. Priorto this, he held a range of positions in the fieldsof economics and finance at a number of Swedishcompanies. Dag Sehlin has an MSc from theStockholm School of Economics.AUDITORLars BerglundStockholm, born 1950Authorized public accountant.Öhrlings Pricewaterhouse- Coopers AB.Auditor of <strong>BTS</strong> Group AB since 1999, and ofthe previous parent company and its Swedishsubsidiaries since 1985.The above information about shares and optionsrefers to conditions on December 31, <strong>2006</strong>.64 <strong>BTS</strong> <strong>Annual</strong> <strong>Report</strong> <strong>2006</strong>
Senior executivesHenrik EkelundChief Executive Offi cer and Presidentof <strong>BTS</strong> Group AB.Refer to data in the section Board ofDirectors.Stefan BrownNacka, born 1963. CFO and vicePresident of <strong>BTS</strong> Group AB.Employee of <strong>BTS</strong> since 1990.Shares and options in <strong>BTS</strong> Group AB:16,500 Class B shares and employeestock options for 22,500 Class Bshares.Stefan HellbergStockholm, born 1957. Head of salesand HR processes, as well as IT.Employee of <strong>BTS</strong> since 1986.Shares and options in <strong>BTS</strong> Group AB:1,483,454 Class B shares.Stefan af PetersenLidingö, born 1955. Acquisitions andkey account contacts.Employee of <strong>BTS</strong> since 1986.Shares and options in <strong>BTS</strong> Group AB:37,800 Class A shares and 2,360,753Class B shares.Jonas ÅkermanConnecticut, born 1963. President of<strong>BTS</strong> North America.Employee of <strong>BTS</strong> since 1991.Shares and options in <strong>BTS</strong> Group AB:913,800 Class B shares and employeestock options for 75,000 Class Bshares.The above information about shares and options refers to conditions on December 31, <strong>2006</strong>.<strong>BTS</strong> <strong>Annual</strong> <strong>Report</strong> <strong>2006</strong>65
Global partners in <strong>BTS</strong>Rommin AdlPhilidelphia, born 1964President and CEO,SMG.Employee of <strong>BTS</strong> since 1994.Peter MulfordNew York, born 1968Executive Vice President, Head of<strong>BTS</strong> New York and Stamford of ces.Employee of <strong>BTS</strong> since 1997.Dan ParisiSan Francisco, born 1968Executive Vice President, Head of<strong>BTS</strong> San Francisco of ce.Employee of <strong>BTS</strong> since 1995..CEO’s of The Real Learning Company andAdvantage Performance GroupRichard HodgeScottsdale, born 1947President, and CEO,The Real Learning Company.Employee of RLC since 1994.John HoskinsScottsdale, born 1950President and CEO,Advantage Performance Group.Employee of APG since 1990.66 <strong>BTS</strong> <strong>Annual</strong> <strong>Report</strong> <strong>2006</strong>
Addresses<strong>BTS</strong> GROUP ABGrevgatan 34114 53 StockholmSwedenPhone: +46 8 58 70 70 00Fax: +46 8 58 70 70 01<strong>BTS</strong> SWEDENGrevgatan 34114 53 StockholmSwedenPhone: +46 8 58 70 70 00Fax: +46 8 58 70 70 01<strong>BTS</strong> UNITED STATES300 First Stamford PlaceStamford, CT 06902USAPhone: +1 203 316 27 40Fax: +1 203 316 27 50New York122 East 42nd StreetSuite 1007New York, NY 10168USAPhone: +1 646 378 3730Fax: +1 646 378 3731San Francisco456 Montgomery StreetSuite 900San Francisco, CA 94104-2808USAPhone: +1 415 362 42 00Fax: +1 415 362 42 70PhiladelphiaSMG StrategicManagement Group, Inc.6 Tower Bridge, Suite 540 181Washington StreetConshohocken, PA 19428USAPhone: +1 484 391 29 00Fax: +1 484 391 29 01ADVANTAGE PERFORMANCEGROUP98 Main St.Ste. 336Tiburon, CA94920USAPhone: +1 800 494 6646Phone: +1 415 435 3040Fax: +1 800 578 8587THE REAL LEARNING COMPANY9455 E. Ironwood Square DriveScottsdale, AZ 85258USAPhone: +1 480 948 2777Phone: +1 800 500 0024Fax: +1 480 948 2928<strong>BTS</strong> UNITED KINGDOM346 Kensington High StreetLondon W14 8NSUKPhone: +44 207 348 18 00Fax: +44 207 348 18 01<strong>BTS</strong> SPAINPaseo General Martínez Campos, 53- semisótano derecho28010 MadridSpainPhone: +34 91 417 5327Fax. +34 91 555 2433Bilbaoc/ Simon Bolivar 27, 10, dpt. 19Bilbao 48010SpainPhone: +34 94 423 5594Fax: +34 94 423 6897<strong>BTS</strong> BELGIUMRue Breydelstraat 401040 BrusselsBelgiumPhone: +32 2 235 86 00Fax: +32 2 235 86 10<strong>BTS</strong> AUSTRALIASuite 103 Level 1109 Pitt StreetSydney NSW 2000AustraliaPhone: +61 2 9233 8833Fax. +61 2 9233 8655MelbourneSuite 8231 Queens RoadMelbourne, Vic 3004AustraliaPhone: +61 3 9863 7722Fax: +61 3 9863 7724<strong>BTS</strong> SOUTH AFRICA272 West AvenueLakefield Office Park, Building CCenturion, GautengSouth AfricaPhone: +27 12 663 6909Fax: +27 12 663 6887<strong>BTS</strong> FINLANDEriksgatan 7E00100 HelsinkiFinlandPhone: +358 9 68 11 270Fax: +358 9 68 11 27 16BUSINESS GAME FACTORY OYc/o Arabianranta 6005 60 HelsinkiFinlandPhone: +358 9 8622 3600Fax: +358 9 8622 3611
Production: Oxenstierna & Partners, Engström med fl era, Photo: Tedd Soost och Johnér Bildbyrå, Print: Bergs Grafi skaSan Francisco, USA London, UK Beijing, China<strong>BTS</strong> GROUP ABGrevgatan 34114 53 StockholmSwedenPhone +46 8 58 70 70 00Fax +46 8 58 70 70 01