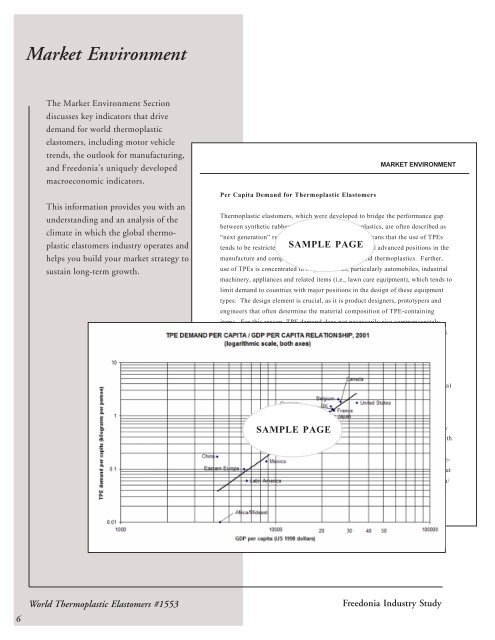
Market Environment<strong>The</strong> Market Environment Sectiondiscusses key indicators that drivedemand for world thermoplasticelastomers, including motor vehicletrends, the outlook for manufacturing,and <strong>Freedonia</strong>’s uniquely developedmacroeconomic indicators.This information provides you with anunderstanding and an analysis of theclimate in which the global thermoplasticelastomers industry operates andhelps you build your market strategy tosustain long-term growth.MARKET ENVIRONMENTPer Capita Demand for <strong><strong>The</strong>rmoplastic</strong> <strong>Elastomers</strong><strong><strong>The</strong>rmoplastic</strong> elastomers, which were developed to bridge the performance gapbetween synthetic rubber and conventional thermoplastics, are often described as“next generation” rubber. In functional terms, this means that the use of TPEsSAMPLE PAGEtends to be restricted to economies that have developed advanced positions in themanufacture and compounding of synthetic rubber and thermoplastics. Further,use of TPEs is concentrated in major durables, particularly automobiles, industrialmachinery, appliances and related items (i.e., lawn care equipment), which tends tolimit demand to countries with major positions in the design of these equipmenttypes. <strong>The</strong> design element is crucial, as it is product designers, prototypers andengineers that often determine the material composition of TPE-containingitems. For this reason, TPE demand does not necessarily rise commensuratelywith output of consumer goods, since many low wage countries are used simply aslow-wage assembly centers for labor-intensive products, with the product design,planning and testing aspects remaining in major developed countries.As is apparent from the following chart, there is a strong positive correlationbetween income levels (represented here by real gross domestic product per capita)and TPE demand per capita (presented in kilograms). In 2001, global TPEdemand was equivalent to 0.26 kilograms per capita, or aboutone-quarter of akilogram per person. <strong>The</strong> higher per capita TPE demand levels occur in the US,SAMPLE PAGECanada, the major economies of Western Europe (particularly Belgium, Germanyand the UK), and the export-oriented economies of Asia (particularly Japan, SouthKorea and Taiwan). China’s per capita TPE demand remains below the globalaverage, though the country’s domestic market for these materials grew at doubledigitrates throughout the 1990s. Demand for TPEs remains negligible throughoutmost of Latin America (with the exception of Brazil), Eastern Europe and Africa/Mideast. In most cases, countries in these regions are still focused on developing© Copyright by <strong>The</strong> <strong>Freedonia</strong> <strong>Group</strong>, Inc.6<strong>World</strong> <strong><strong>The</strong>rmoplastic</strong> <strong>Elastomers</strong> #1553<strong>Freedonia</strong> Industry Study
Supply & Demandby Region & Country<strong>The</strong> Supply and Demand Sectionhighlights the key issues that haveaffected the global thermoplasticelastomers market over the past tenyears and summarizes contributinggrowth factors.This information helps you:• Focus your sales and marketingefforts on high growth areas.• Propose new areas for developmentSouth KoreaSUPPLY & DEMAND BY REGION & COUNTRYDemand for thermoplastic elastomers in South Korea is forecast to increase 8.6percent per year to 92,000 metric tons in 2006, with market value expanding atdouble digit rates over the SAMPLE same period to PAGE reach $415 million. As South Korea isthe second largest motor vehicle producer in Asia behind Japan, a major share ofthe country’s TPE demand is related to the motor vehicle industry. Vehicleoutput is forecast to post moderate gains after a weak showing in the second halfof the 1990s, and this factor, along with continued supplantation of rubber parts,will promote favorable gains in TPEs.With the motor vehicle market leveling off, TPEs are finding their strongestopportunities in smaller sectors, particularly the industrial and manufacturingsectors, where TPEs are used in a wide range of parts and components -- e.g., belts,hoses, bumpers and vibration dampening elements. TPEs also are widely used inGermany - <strong><strong>The</strong>rmoplastic</strong> Elastomer Supply & Demandconsumer goods such as housewares, sporting goods, hand and power tools, andsmall (thousand appliances. metric Additionally, tons) although lower wage nations such as China areItemoffering intense competition for South Korea’s footwear industry, the use of1992 1996 2001 2006 2011styrenic block copolymers and TPUs in footwear-related applications will remain aPopulation (million)major factor in the South Korean TPE market.80.6 81.9 82.3 82.3 82.2GDP per capita 21040 21490 23390 26060 29320Gross Domestic Product (bil South US 98$) Korean TPE production 1696 1760 is forecast 1925 to reach 25,000 2145 metric 2410 tons in 2006.LG Chemical is the leading producer, with an SBS unit located in Yeochon. LG$ per mil $ GDPkg per capitakg per mil $ GDPChemical also is active 171.0 through 230.1 an agreement 290.9with Advanced 349.7 Elastomer 414.9 Systems.As part of the alliance, 0.83 AES allows 1.05LG Chemical 1.34 to 1.66 market the 2.04 company’sSANTOPRENE TPVs, 39.5 as well as 48.9 produce and 57.1distribute 63.9 compounds 69.7based on AES’TPVs in South Korea and other countries in the Asia/Pacific region.TPE Demand (mil $) 290 405 560 750 1000$/kg 4.33 4.71 5.09 5.47 5.95US-based Crompton expanded its position in South Korea in April 2001, when itacquired the DB Casthanes business of HST&C (South Korea). <strong>The</strong> DB Casthanes<strong><strong>The</strong>rmoplastic</strong> Elastomer Demand 67.0 86.0SAMPLE 110.0 137.0 TABLE 168.0Styrenic Block Copolymers (SBCs) 32.0 41.0 52.0 65.0 79.0<strong><strong>The</strong>rmoplastic</strong> Polyolefins (TPOs) 16.1 21.5 27.4 33.5 41.6<strong><strong>The</strong>rmoplastic</strong> Polyurethanes (TPUs) 10.8 13.2 16.8 20.9 25.3<strong><strong>The</strong>rmoplastic</strong> Vulcanizates (TPVs) 4.0 5.3 6.8 8.3 9.9Copolyester <strong>Elastomers</strong> (COPEs) 1.8 2.5 3.6 4.8 6.2Other TPEs 2.3 2.5 3.4 4.5 6.0+ net exports/stockpiles 31.0 38.0 44.0 59.0 82.0<strong><strong>The</strong>rmoplastic</strong> Elastomer Production 98.0 124.0 154.0 196.0 250.0© Copyright by <strong>The</strong> <strong>Freedonia</strong> <strong>Group</strong>, Inc.<strong>World</strong> <strong><strong>The</strong>rmoplastic</strong> <strong>Elastomers</strong> #1553Order form on last page7