World Industrial Silica Sand - The Freedonia Group
World Industrial Silica Sand - The Freedonia Group
World Industrial Silica Sand - The Freedonia Group
You also want an ePaper? Increase the reach of your titles
YUMPU automatically turns print PDFs into web optimized ePapers that Google loves.
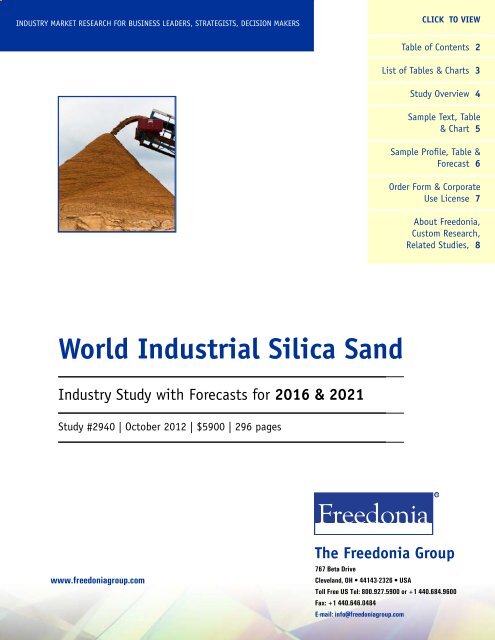
INDUSTRY MARKET RESEARCH FOR BUSINESS LEADERS, STRATEGISTS, DECISION MAKERSCLICK TO VIEWTable of Contents 2List of Tables & Charts 3Study Overview 4Sample Text, Table& Chart 5photo courtesy of corporate press officeSample Profile, Table &Forecast 6Order Form & CorporateUse License 7About <strong>Freedonia</strong>,Custom Research,Related Studies, 8<strong>World</strong> <strong>Industrial</strong> <strong>Silica</strong> <strong>Sand</strong>Industry Study with Forecasts for 2016 & 2021Study #2940 | October 2012 | $5900 | 296 pageswww.freedoniagroup.com<strong>The</strong> <strong>Freedonia</strong> <strong>Group</strong>767 Beta DriveCleveland, OH • 44143-2326 • USAToll Free US Tel: 800.927.5900 or +1 440.684.9600Fax: +1 440.646.0484E-mail: info@freedoniagroup.com
Study #2940October 2012$5900296 Pages<strong>World</strong> <strong>Industrial</strong> <strong>Silica</strong> <strong>Sand</strong>Industry Study with Forecasts for 2016 & 2021List of Tables/Charts(continued from previous page)6 <strong>World</strong> Crude Steel Production by Region...257 <strong>World</strong> Oil & Gas Output by Region...........278 <strong>World</strong> Oil & Gas Wells Drilled by Region....299 <strong>World</strong> Construction Expendituresby Type & Region..............................3610 <strong>World</strong> <strong>Silica</strong> <strong>Sand</strong> Prices.........................38WORLD SUPPLY & DEMAND1 <strong>World</strong> <strong>Industrial</strong> <strong>Silica</strong> <strong>Sand</strong>Demand by Region.............................46Cht <strong>World</strong> <strong>Silica</strong> <strong>Sand</strong> Demandby Region, 2011................................472 <strong>World</strong> <strong>Silica</strong> <strong>Sand</strong> Production by Region....493 <strong>World</strong> <strong>Silica</strong> <strong>Sand</strong> Net Exports by Region...504 <strong>World</strong> <strong>Silica</strong> <strong>Sand</strong> Demand by Market........51Cht <strong>World</strong> <strong>Silica</strong> <strong>Sand</strong> Demandby Market, 2011................................525 <strong>World</strong> Glass Demand for <strong>Silica</strong> <strong>Sand</strong>by Type & Region..............................556 <strong>World</strong> Container Glass Demandfor <strong>Silica</strong> <strong>Sand</strong> by Region....................577 <strong>World</strong> Flat & Other Glass Demandfor <strong>Silica</strong> <strong>Sand</strong> by Region....................598 <strong>World</strong> Foundry Demand for<strong>Silica</strong> <strong>Sand</strong> by Region.........................629 <strong>World</strong> Hydraulic Fracturing Demandfor <strong>Silica</strong> <strong>Sand</strong> by Region....................6610 <strong>World</strong> Building Products Demandfor <strong>Silica</strong> <strong>Sand</strong> by Region....................6811 <strong>World</strong> Chemical Demand for<strong>Silica</strong> <strong>Sand</strong> by Region.........................7012 <strong>World</strong> Demand for <strong>Silica</strong> <strong>Sand</strong> Usedin Other Markets by Region.................73NORTH AMERICA1 North America: <strong>Silica</strong> <strong>Sand</strong>Supply & Demand..............................77Cht North America: <strong>Silica</strong> <strong>Sand</strong>Demand by Country, 2011...................782 North America: <strong>Silica</strong> <strong>Sand</strong>Demand by Market.............................79Cht North America: <strong>Silica</strong> <strong>Sand</strong>Demand by Market, 2011....................803 United States: <strong>Silica</strong> <strong>Sand</strong>Supply & Demand..............................844 United States: <strong>Silica</strong> <strong>Sand</strong>Demand by Market.............................875 Canada: <strong>Silica</strong> <strong>Sand</strong> Supply & Demand.....906 Canada: <strong>Silica</strong> <strong>Sand</strong> Demand by Market....927 Mexico: <strong>Silica</strong> <strong>Sand</strong> Supply & Demand......958 Mexico: <strong>Silica</strong> <strong>Sand</strong> Demand by Market....97WESTERN EUROPE1 Western Europe: <strong>Silica</strong> <strong>Sand</strong>Supply & Demand............................ 101Cht Western Europe: <strong>Silica</strong> <strong>Sand</strong>Demand by Country, 2011................. 1022 Western Europe: <strong>Silica</strong> <strong>Sand</strong>Demand by Market........................... 103Cht Western Europe: <strong>Silica</strong> <strong>Sand</strong>Demand by Market, 2011.................. 1043 Germany: <strong>Silica</strong> <strong>Sand</strong> Supply & Demand. 1074 Germany: <strong>Silica</strong> <strong>Sand</strong> Demand by Market 1085 Italy: <strong>Silica</strong> <strong>Sand</strong> Supply & Demand...... 1116 Italy: <strong>Silica</strong> <strong>Sand</strong> Demand by Market..... 1127 France: <strong>Silica</strong> <strong>Sand</strong> Supply & Demand.... 1158 France: <strong>Silica</strong> <strong>Sand</strong> Demand by Market... 1169 Spain: <strong>Silica</strong> <strong>Sand</strong> Supply & Demand..... 11910 Spain: <strong>Silica</strong> <strong>Sand</strong> Demand by Market.... 12011 United Kingdom: <strong>Silica</strong> <strong>Sand</strong>Supply & Demand............................ 12312 United Kingdom: <strong>Silica</strong> <strong>Sand</strong>Demand by Market........................... 12513 Other Western Europe: <strong>Silica</strong> <strong>Sand</strong>Supply & Demand............................ 12814 Other Western Europe: <strong>Silica</strong> <strong>Sand</strong>Demand by Market........................... 130ASIA/PACIFIC1 Asia/Pacific: <strong>Silica</strong> <strong>Sand</strong>Supply & Demand............................ 134Cht Asia/Pacific: <strong>Silica</strong> <strong>Sand</strong>Demand by Country, 2011................. 1352 Asia Pacific: <strong>Silica</strong> <strong>Sand</strong>Demand by Market........................... 136Cht Asia/Pacific: <strong>Silica</strong> <strong>Sand</strong>Demand by Market, 2011.................. 1373 China: <strong>Silica</strong> <strong>Sand</strong> Supply & Demand..... 1414 China: <strong>Silica</strong> <strong>Sand</strong> Demand by Market.... 1445 Japan: <strong>Silica</strong> <strong>Sand</strong> Supply & Demand..... 1476 Japan: <strong>Silica</strong> <strong>Sand</strong> Demand by Market.... 1487 India: <strong>Silica</strong> <strong>Sand</strong> Supply & Demand...... 1518 India: <strong>Silica</strong> <strong>Sand</strong> Demand by Market..... 1539 South Korea: <strong>Silica</strong> <strong>Sand</strong>Supply & Demand............................ 15610 South Korea: <strong>Silica</strong> <strong>Sand</strong>Demand by Market........................... 15711 Australia: <strong>Silica</strong> <strong>Sand</strong> Supply & Demand 16012 Australia: <strong>Silica</strong> <strong>Sand</strong> Demand by Market 16213 Other Asia/Pacific: <strong>Silica</strong> <strong>Sand</strong>Supply & Demand............................ 16514 Other Asia/Pacific: <strong>Silica</strong> <strong>Sand</strong>Demand by Market........................... 167OTHER REGIONS1 Central & South America: <strong>Silica</strong><strong>Sand</strong> Supply & Demand..................... 1702 Central & South America: <strong>Silica</strong><strong>Sand</strong> Demand by Market................... 172Cht Central & South America: <strong>Silica</strong><strong>Sand</strong> Demand by Market, 2011........... 1733 Brazil: <strong>Silica</strong> <strong>Sand</strong> Supply & Demand..... 1764 Brazil: <strong>Silica</strong> <strong>Sand</strong> Demand by Market.... 1785 Other Central & South America:<strong>Silica</strong> <strong>Sand</strong> Supply & Demand............ 1816 Other Central & South America:<strong>Silica</strong> <strong>Sand</strong> Demand by Market........... 1827 Eastern Europe: <strong>Silica</strong> <strong>Sand</strong>Supply & Demand............................ 185Cht Eastern Europe: <strong>Silica</strong> <strong>Sand</strong>Demand by Country, 2011................. 1868 Eastern Europe: <strong>Silica</strong> <strong>Sand</strong>Demand by Market........................... 187Cht Eastern Europe: <strong>Silica</strong> <strong>Sand</strong>Demand by Market, 2011.................. 1889 Russia: <strong>Silica</strong> <strong>Sand</strong> Supply & Demand.... 19110 Russia: <strong>Silica</strong> <strong>Sand</strong> Demand by Market... 19311 Poland: <strong>Silica</strong> <strong>Sand</strong> Supply & Demand.... 19612 Poland: <strong>Silica</strong> <strong>Sand</strong> Demand by Market... 19713 Other Eastern Europe: <strong>Silica</strong><strong>Sand</strong> Supply & Demand..................... 20014 Other Eastern Europe: <strong>Silica</strong><strong>Sand</strong> Demand by Market................... 20215 Africa/Mideast: <strong>Silica</strong> <strong>Sand</strong>Supply & Demand............................ 205Cht Africa/Mideast: <strong>Silica</strong> <strong>Sand</strong>Demand by Country, 2011................. 20616 Africa/Mideast: <strong>Silica</strong> <strong>Sand</strong>Demand by Market........................... 207Cht Africa/Mideast: <strong>Silica</strong> <strong>Sand</strong>Demand by Market, 2011.................. 20817 Turkey: <strong>Silica</strong> <strong>Sand</strong> Supply & Demand.... 21118 Turkey: <strong>Silica</strong> <strong>Sand</strong> Demand by Market... 21219 South Africa: <strong>Silica</strong> <strong>Sand</strong>Supply & Demand............................ 21520 South Africa: <strong>Silica</strong> <strong>Sand</strong>Demand by Market........................... 21621 Other Africa/Mideast: <strong>Silica</strong><strong>Sand</strong> Supply & Demand..................... 21922 Other Africa/Mideast: <strong>Silica</strong><strong>Sand</strong> Demand by Market................... 221INDUSTRY STRUCTURE1 <strong>World</strong> <strong>Silica</strong> <strong>Sand</strong> Salesby Company, 2011........................... 224Cht <strong>World</strong> <strong>Silica</strong> <strong>Sand</strong> Market Share, 2011..... 225Page Click here to purchase onlineOrder now, click here!
Study #2940October 2012$5900296 Pages<strong>World</strong> <strong>Industrial</strong> <strong>Silica</strong> <strong>Sand</strong>Industry Study with Forecasts for 2016 & 2021Sample Text,Table & ChartTABLE VI-3CHINA:SILICA SAND SUPPLY & DEMANDItem 2001 2006 2011 2016 2021asia/pacificPopulation (million persons) 1273 1310 1342 1369 1388GDP/capita 3180 5120 8230 11910 16570Gross Domestic Product (bil 2010$) 4045 6705 11048 16300 23000China: <strong>Silica</strong> <strong>Sand</strong> OutlookChina’s silica sand demand is projected to expand 6.3 percent Flat per Glass Production (000 metric tons) 105002328036900 58500 86000year through 2016 to 100.5 million metric tons with a value of $2.7 Crude Steel Production (mil metric tons) 151.6421.0 681.0 940.01297.0billion, moderating from the robustsamplegains posted between 2006 and Oil 2011 & Gas Wells Drilled 10200 16980 sample 24350 26700 29600but still the second fastest growth rate of any national market behindIndia. Consumption will be stimulatedtextin large part by the continued kg silica sand/capita 16 table 35 55 73 97expansion of -- and associated demand for silica sand by -- the nation’s kg silica sand/000$ GDP 5.19 6.81 6.71 6.17 5.85glass industry. For example, China’s flat glass production is forecastto reach 47.9 million metric tons in 2016, accounting for 56 percent <strong>Silica</strong> of <strong>Sand</strong> Demand (mil metric tons) 20.99 45.65 74.10100.50134.50all global output in that year. Production of glass containers will also net exports 0.70 -- -0.30 -1.80 -3.00register healthy gains supported by the country’s large beer industry <strong>Silica</strong> and <strong>Sand</strong> Production (mil metric tons) 21.6945.65 73.80 98.70131.50growing wine output. China’s glass industry in general is a more intensiveuser of sand due to relatively low recycling rates. Suppliers will % China 46.7 61.3 69.6 72.3 74.4also benefit from across-the-board gains in the foundry, building product, A/P <strong>Silica</strong> <strong>Sand</strong> Prdn (mil metric tons) 46.41 74.44106.00136.60176.80chemical, and other markets as output levels climb further.<strong>The</strong>re is a high level of interest regarding the future level ofhydraulic fracturing activity in China with demand for proppants (of alltypes) in China projected to post robust increases through 2021. Chinaproduces no shale gas commercially right now despite its huge resources,and the nation is acquiring expertise from foreign oil and oil servicesfirms to set the industry in motion. Leading energy companies includingBP (UK), Chevron (US), Conoco-Phillips (US), and Shell (UK) areworking in conjunction with a number of China’s state-owned companiesto develop the country’s shale gas resources. Shell signed a productionsharing contract with China National Petroleum in March 2012, the firstsuch agreement in China. Furthermore, in August 2012 Shell announcedit would spend at least $1 billion annually exploring China’s shaleresources.<strong>The</strong> Chinese government has set a target of producing 229.5 billioncubic feet a year of shale by 2015. However, it is not likely thatCHART VIII-1WORLD SILICA SAND MARKET SHARE($6.0 billion, 2011)142Copyright 2012 <strong>The</strong> <strong>Freedonia</strong> <strong>Group</strong>, Inc.O th e rs7 9 .5 %M a rke tL e a d e rs2 0 .5 %samplechart11.7%4.5%Sib elcoU S <strong>Silica</strong>4.3%F airm o u n tM in eralsPage Click here to purchase onlineOrder now, click here!
Study #2940October 2012$5900296 Pages<strong>World</strong> <strong>Industrial</strong> <strong>Silica</strong> <strong>Sand</strong>Industry Study with Forecasts for 2016 & 2021Sample Profile,Table & ForecastTABLE VI-4CHINA: SILICA SAND DEMAND BY MARKET(million metric tons)Item 2001 2006 2011 2016 2021Asia/Pacific <strong>Silica</strong> <strong>Sand</strong> Demand 48.51 77.76110.50143.60185.80% China 43.3 58.7 67.1 70.0 72.4COMPANY PROFILES<strong>Silica</strong> <strong>Sand</strong> Demand 20.99 45.65 74.10100.50134.50Glass: 11.33 22.07 37.35 49.70 64.35Container Glass 4.33 6.57 13.25 18.70 26.35sampleFlat & Other Glass 7.00 15.50 24.10 31.00 38.00Foundries 6.79 18.18 26.65 35.50 47.95tableHydraulic Fracturing 0.03 0.07 0.17 0.30 0.70Building Products 0.98 2.25 4.68 7.16 10.35Chemicals 0.89 1.47 2.73 4.03 5.66Other 0.97 1.61 2.52 3.81 5.49EUROQUARZ GmbHKirchhellener Allee 53Dorsten 46282Germany49-2362-2005-0http://www.euroquarz.comsampleprofileAnnual Sales: $50 million (estimated)Employment: 220 (estimated)Key Products: standard silica sand, water filter silica sand, coloredsilica sand, silica flour, and related productsEUROQUARZ specializes in the extraction, treatment, and furtherprocessing of silica sand and silica gravel at several plants in Germanyand the Netherlands. <strong>The</strong> privately held company also makes specialready-mixed mortars, tile adhesives, screeds, sealing mortars, andrelated products on a contract basis. EUROQUARZ serves customersin Germany, the Netherlands, and elsewhere.<strong>The</strong> Company is active in the world silica sand industry throughthe manufacture and supply of standard silica sand, water filter silicasand, colored silica sand, silica flour, and related silica products.EUROQUARZ produces a variety of standard silica sands, includingthose sold under the SILGRAN and SILGRANO brand names. Forexample, SILGRAN dried silica sand is available in grain sizes rangingfrom .1 to .3 millimeters (mm) in size. This sand features a silicondioxide content of 99.44 percent. End uses for SILGRAN silica includebrake sands for rail bounded vehicles, artificial turf sand, golf coursesand, bird sands, poultry forage amendment, and winter traction sand.$/metric ton 17 19 22 27 30<strong>Silica</strong> <strong>Sand</strong> Demand (mil $) 350 861 1665 2720 4045“Production of industrial sandby facilities in China is expectedto climb at a strong 6.0 percentannual pace through 2016 to 98.7million metric tons, but not rapidenough to prevent the country’strade deficit in silica sand fromwidening further. Domestic industryoutput will be fueled by healthylocal sales conditions that willserve as catalysts for expansions inproduction. On the other hand, ...”--Section VI, pg. 143246Copyright 2012 <strong>The</strong> <strong>Freedonia</strong> <strong>Group</strong>, Inc.Page Click here to purchase onlineOrder now, click here!
Order InformationFive Convenient Ways to OrderINDUSTRY MARKET RESEARCH FOR BUSINESSLEADERS, STRATEGISTS, DECISION MAKERSONLINE: www.freedoniagroup.comMAIL: Print out and complete the orderform and send to <strong>The</strong> <strong>Freedonia</strong> <strong>Group</strong>(see address at the bottom of this form)PHONE: Call toll free, 800.927.5900(US) or +1 440.684.9600FAX: +1 440.646.0484 (US)EMAIL: info@freedoniagroup.comFree Handling & Shipping<strong>The</strong>re is NO charge for handling or UPS shippingin the US. Expect delivery in 3 to 5 business days.Outside the US, <strong>Freedonia</strong> provides free airmailservice. Express delivery is available at cost.Orders Outside of the USChecks must be made payable in US funds,drawn against a US bank and mailed directly to<strong>The</strong> <strong>Freedonia</strong> <strong>Group</strong>. For wire transfers pleasecontact our customer service department at info@freedoniagroup.com. Credit cards accepted.Credit Card OrdersFor convenience, <strong>Freedonia</strong> accepts American Express,MasterCard or Visa. Credit card purchasesmust include account number, expiration date andauthorized signature.Save 15%If you order three (3) different titles at the sametime, you can receive a 15% discount. If yourorder is accompanied by a check or wire transfer,you may take a 5% cash discount (discounts donot apply to Corporate Use Licenses).Corporate Use LicenseNow every decision maker in your organization can act on the key intelligence found in all<strong>Freedonia</strong> studies. For an additional $2600, companies receive unlimited use of an electronicversion (PDF) of the study. Place it on your intranet, e-mail it to coworkers around the world,or print it as many times as you like,Click here to learn more aboutthe Corporate Use LicenseOrder FormF-WEB.-2940Name<strong>World</strong> <strong>Industrial</strong> <strong>Silica</strong> <strong>Sand</strong>..................................... $5900Corporate Use License (add to study price) * +$2600Additional Print Copies @ $600 each *Total (including selected option) $Enclosed is my check (5% discount) drawn on a US bank and payable to<strong>The</strong> <strong>Freedonia</strong> <strong>Group</strong>, Inc., in US funds (Ohio residents add 7.75% sales tax)TitleCompanyDivisionStreet(No PO Box please)Bill my companyAmerican ExpressMasterCardVisaCity/State/ZipMMYYCountryCredit Card #Expiration DatePhoneFaxSignatureEmail* Please check appropriate option and sign below to order an electronicversion of the study.Corporate Use License Agreement<strong>The</strong> above captioned study may be stored on the company’s intranet orshared directory, available to company employees. Copies of the study maybe made, but the undersigned represents that distribution of the study willbe limited to employees of the company.Individual Use License Agreement<strong>The</strong> undersigned hereby represents that the above captioned study will beused by only ___ individual(s) who are employees of the company and thatthe study will not be loaded on a network for multiple users. In the eventthat usage of the study changes, the Company will promptly notify <strong>Freedonia</strong>of such change and will pay to <strong>Freedonia</strong> the appropriate fee based on<strong>Freedonia</strong>’s standard fee schedule then in effect. Note: Entire company corporateuse license, add $2600; one additional user, add $600; two additionalusers, add $1200; three additional users, add $1800.SignatureSignature<strong>The</strong> <strong>Freedonia</strong> <strong>Group</strong>, Inc. 767 Beta Drive • Cleveland, OH • 44143-2326 • USA • Web site: www.freedoniagroup.comTel US: 800.927.5900 or +1 440.684.9600 • Fax: +1 440.646.0484 • e-mail: info@freedoniagroup.comPage 7
INDUSTRY MARKET RESEARCH FOR BUSINESS LEADERS, STRATEGISTS, DECISION MAKERSOther Studies<strong>World</strong> Flat Glass<strong>World</strong> demand for flat glass is forecast to rise 7.1 percentper year through 2016 to 9.2 billion square meters.<strong>The</strong> dominant Asia/Pacific region will continue topost the fastest gains. Fabricated flat glass demandwill benefit from rapid growth in sales of energyefficient products such as solar control, insulationand low-E glass. This study analyzes the 6.6 billionsquare meter world flat glass industry, with forecastsfor 2016 and 2021 by product, market, world regionand for 21 countries. <strong>The</strong> study also evaluates companymarket share and profiles industry players.#2970.................January 2013.................. $6400<strong>World</strong> Oilfield Chemicals<strong>World</strong> demand for oilfield chemicals is expected toincrease 8.9 percent annually to $28 billion in 2016.<strong>The</strong> US will remain the largest market based on itsmany mature wells and rapid growth in horizontaldrilling and hydraulic fracturing. Brazil will be the fastestgrowing market. Drilling fluids and completion andworkover fluids will lead gains. This study analyzesthe $18 billion world oilfield chemical industry, withforecasts for 2016 and 2021 by product, world regionand for 44 countries. <strong>The</strong> study also evaluates companymarket share and profiles industry participants.#2973................December 2012................. $6200Well Stimulation MaterialsUS demand for well stimulation materials is forecastto rise 10.2 percent annually to nearly $12 billion in2016. Growth will be driven by continued advances inhydraulic fracturing technology designed to increasethe productivity of both new and existing wells. Proppants,gases, and base fluid materials will be amongthe fastest growing products. This study analyzes the$7.4 billion US well stimulation material industry, withforecasts for 2016 and 2021 by product and regionalmarket. <strong>The</strong> study also evaluates company marketshares and profiles industry players.#2867..................March 2012................... $5100<strong>World</strong> SaltGlobal demand for salt will rise 2.9 percent annuallythrough 2015 to 327 million metric tons. Growthin chemical production, especially in China, willfuel most new demand. Demand will also benefitfrom shale gas drilling in North America, which willboost chloralkali output in the US and Canada. Thisstudy analyzes the 284 million metric ton world saltindustry, with forecasts for 2015 and 2020 by market,production method, world region and for 20 countries.<strong>The</strong> study also evaluates company market share andprofiles industry competitors.#2857................ February 2012................. $5900About <strong>The</strong> <strong>Freedonia</strong> <strong>Group</strong><strong>The</strong> <strong>Freedonia</strong> <strong>Group</strong>, Inc., is a leading international industry market research companythat provides its clients with information and analysis needed to make informedstrategic decisions for their businesses. Studies help clients identify business opportunities,develop strategies, make investment decisions and evaluate opportunitiesand threats. <strong>Freedonia</strong> research is designed to deliver unbiased views and reliableoutlooks to assist clients in making the right decisions. <strong>Freedonia</strong> capitalizes onthe resources of its proprietary in-house research team of experienced economists,professional analysts, industry researchers and editorial groups. <strong>Freedonia</strong> covers adiverse group of industries throughout the United States, the emerging China market,and other world markets. Industries analyzed by <strong>Freedonia</strong> include:• Chemicals • Plastics • Life Sciences • Packaging • Building Materials • Security& Electronics • <strong>Industrial</strong> Components & Equipment • Automotive & TransportationEquipment • Household Goods • Energy/Power Equipment<strong>Freedonia</strong> Custom ResearchClick here to learn more about <strong>Freedonia</strong><strong>Freedonia</strong> Custom Research delivers the same high quality, thorough and unbiasedassessment of an industry or market as an industry study. Since the research initiativeis based upon a company’s specific needs, companies harness <strong>Freedonia</strong>’sresearch capabilities and resources to answer unique questions. When you leveragethe results of a <strong>Freedonia</strong> Custom Research engagement, you are able to obtainimportant answers to specific questions and issues associated with: mergers andacquisitions, new product launches/development, geographic expansion, entry intonew markets, strategic business planning, and investment and funding decisions.<strong>Freedonia</strong> Custom Research is ideal for companies seeking to make a strategic differencein the status quo and focus on future business growth. Working side by sidewith clients, <strong>Freedonia</strong>’s team is able to define a research project that is customtailoredto answer specific questions and provide the basis from which a companycan make informed business decisions.Click here to learn more about Custom ResearchOilfield ChemicalsUS oilfield chemical demand will rise 8.3 percentyearly through 2015, driven by the recovery of oilprices and the development of shale gas resources.Stimulation and cementing chemicals will be thefastest growing products, followed by drilling fluids.Natural gums, polymers, acids and surfactants willbe among the best prospects in raw materials. Thisstudy analyzes the $9.1 billion US oilfield chemicalindustry, with forecasts for 2015 and 2020 by productand raw material. <strong>The</strong> study also evaluates companymarket share and profiles industry players.#2821............... November 2011................. $4900Click here for complete title listClick here to visit freedoniagroup.comPage 8<strong>The</strong> <strong>Freedonia</strong> <strong>Group</strong>, Inc. 767 Beta Drive • Cleveland, OH • 44143-2326 • USA • Web site: www.freedoniagroup.comTel US: 800.927.5900 or +1 440.684.9600 • Fax: +1 440.646.0484 • e-mail: info@freedoniagroup.com


