Caps & Closures - The Freedonia Group
Caps & Closures - The Freedonia Group
Caps & Closures - The Freedonia Group

You also want an ePaper? Increase the reach of your titles
YUMPU automatically turns print PDFs into web optimized ePapers that Google loves.
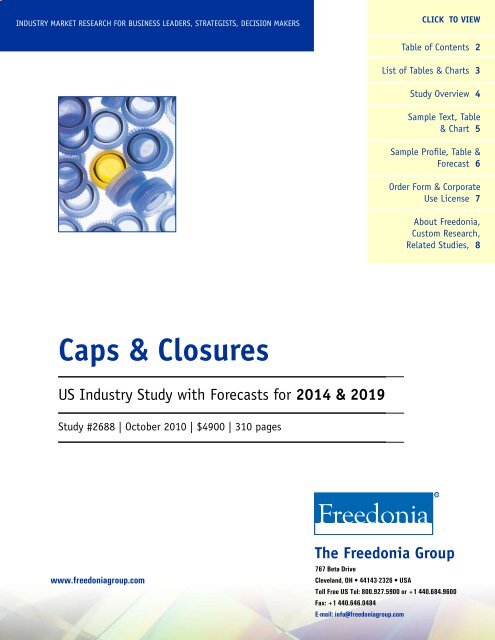
INDUSTRY MARKET RESEARCH FOR BUSINESS LEADERS, STRATEGISTS, DECISION MAKERSCLICK TO VIEWTable of Contents 2List of Tables & Charts 3Study Overview 4Sample Text, Table& Chart 5Sample Profile, Table &Forecast 6Order Form & CorporateUse License 7About <strong>Freedonia</strong>,Custom Research,Related Studies, 8<strong>Caps</strong> & <strong>Closures</strong>US Industry Study with Forecasts for 2014 & 2019Study #2688 | October 2010 | $4900 | 310 pageswww.freedoniagroup.com<strong>The</strong> <strong>Freedonia</strong> <strong>Group</strong>767 Beta DriveCleveland, OH • 44143-2326 • USAToll Free US Tel: 800.927.5900 or +1 440.684.9600Fax: +1 440.646.0484E-mail: info@freedoniagroup.com
Study #2688October 2010$4900310 Pages<strong>Caps</strong> & <strong>Closures</strong>US Industry Study with Forecasts for 2014 & 2019Table of ContentsExecutive SummaryMarket EnvironmenTGeneral.................................................4Macroeconomic Outlook...........................5Demographic & Household Trends..............8Consumer Income & Spending Trends....... 11Manufacturing Outlook.......................... 13Packaging Trends.................................. 16Container Overview............................... 20Types............................................... 22Markets & Materials........................... 25Plastic.......................................... 27Metal............................................ 29Glass............................................ 31Paperboard.................................... 34Historical Market Trends........................ 36Pricing Trends...................................... 39Environmental Issues............................ 42Regulatory Issues................................. 44Global Trends....................................... 47Foreign Trade....................................... 49RAW MATERIALSGeneral............................................... 53Plastic Resins....................................... 55Polypropylene................................... 57Polyethylene..................................... 59Polystyrene....................................... 60Other Resins..................................... 61Metal.................................................. 63Steel & Tin....................................... 65Aluminum........................................ 66Other.................................................. 68Elastomers........................................ 69Paperboard....................................... 70PRODUCTSGeneral............................................... 71Plastic <strong>Caps</strong> & <strong>Closures</strong>.......................... 75Threaded.......................................... 79Standard....................................... 81Pressurized.................................... 86Vacuum......................................... 89Dispensing....................................... 91Pump, Trigger & Spray Dispensers...... 94Other Dispensing <strong>Closures</strong>................ 97Producers.................................... 100Unthreaded.................................... 100Lids............................................ 102Aerosol <strong>Caps</strong> & <strong>Closures</strong>................. 105Synthetic Corks............................ 108Child-Resistant................................ 112Products..................................... 114Producers.................................... 117Metal <strong>Caps</strong> & <strong>Closures</strong>.......................... 118Screw & Lug................................... 121Vacuum....................................... 123Nonvacuum................................. 126Crowns........................................... 128Roll-Ons......................................... 130Products..................................... 133Producers.................................... 134Other............................................. 134Other <strong>Caps</strong> & <strong>Closures</strong>.......................... 136Elastomer & Rubber......................... 138Cork.............................................. 141Paperboard..................................... 144MARKETSGeneral............................................. 147Beverages.......................................... 151Beverage Outlook............................ 152Cap & Closure Demand...................... 154Carbonated Soft Drinks.................. 156Water......................................... 159Fruit Beverages............................ 161Wine & Spirits.............................. 163Milk........................................... 165Beer........................................... 168Other.......................................... 170Pharmaceuticals................................. 173Pharmaceutical Industry Outlook........ 173Cap & Closure Demand...................... 176Food................................................. 180Food & Food Container Outlook.......... 181Cap & Closure Demand...................... 184Dairy Products............................. 187Sauces & Condiments.................... 190Other.......................................... 194Cosmetics & Toiletries......................... 198Cosmetic & Toiletry Industry Outlook.. 199Cap & Closure Demand...................... 201Products..................................... 203Producers.................................... 205Household Cleaning Chemicals.............. 206Household Cleaning Chemical Outlook 206Cap & Closure Demand...................... 208Automotive Chemicals......................... 212Automotive Chemical Industry Outlook 212Cap & Closure Demand...................... 214Other Markets.................................... 217INDUSTRY STRUCTUREGeneral............................................. 221Industry Composition.......................... 222Market Share...................................... 225Acquisitions & Divestitures.................. 231Marketing.......................................... 233Distribution....................................... 235Manufacturing & Development.............. 236Integration Strategies......................... 238Cooperative Agreements...................... 239Company ProfilesAmcor Limited................................... 243Aptar<strong>Group</strong> Incorporated..................... 245BERICAP Holding................................ 250Berry Plastics..................................... 253CLARCOR Incorporated......................... 256Cobra Plastics.................................... 257Crown Holdings.................................. 258Daetwyler Holding.............................. 260Dayton Systems <strong>Group</strong>......................... 262Drug Plastics and Glass........................ 263Global Closure Systems........................ 264Huhtamaki Oyj................................... 266IPN Europe........................................ 267Jarden Corporation............................. 268MeadWestvaco Corporation................... 270Nomacorc LLC.................................... 273Paradigm Packaging............................ 275Phoenix <strong>Closures</strong>................................ 276PolyChem Alloy.................................. 277Polytop Corporation............................ 278Portola Packaging............................... 280Rexam plc......................................... 282Reynolds <strong>Group</strong>.................................. 287Saint-Gobain...................................... 292Silgan Holdings.................................. 294Stull Technologies.............................. 296Supreme Corq..................................... 297Tecnocap SpA..................................... 299Tetra Laval International...................... 301Weatherchem Corporation.................... 303West Pharmaceutical Services............... 304Additional Companiesin <strong>Caps</strong> & <strong>Closures</strong>............................ 307Page Click here to purchase onlineOrder now, click here!
Study #2688October 2010$4900310 Pages<strong>Caps</strong> & <strong>Closures</strong>US Industry Study with Forecasts for 2014 & 2019List of TablesExecutive Summary1 Summary Table.................................3Market EnvironmenT1 Macroeconomic Indicators..................82 Population & Households................. 113 Personal Consumption Expenditures... 134 Manufacturers’ Shipments................ 165 Packaging Supply & Demand............. 206 Container Demand by Type............... 257 Container Demand byMarket & Material........................ 278 Plastic Container Demandby Type & Market......................... 299 Metal Container Demandby Type & Market......................... 3110 Glass Container Demandby Type & Market......................... 3411 Paperboard Container Demandby Type & Market......................... 3612 Cap & Closure Market, 1999-2009...... 3813 Cap & Closure Pricing by Material...... 4214 Foreign Trade in <strong>Caps</strong> & <strong>Closures</strong>....... 51RAW MATERIALS1 Raw Material Use in <strong>Caps</strong> & <strong>Closures</strong>.. 542 Plastic Use in <strong>Caps</strong> & <strong>Closures</strong>.......... 573 Metal Use in <strong>Caps</strong> & <strong>Closures</strong>............ 654 Other Material Use in <strong>Caps</strong> & <strong>Closures</strong> 69PRODUCTS1 Cap & Closure Demand by Material..... 742 Plastic Cap & ClosureSupply & Demand........................ 783 Threaded Plastic Cap & ClosureDemand by Type.......................... 814 Standard Threaded Plastic Cap& Closure Demand by Market......... 835 Pressurized Threaded PlasticCap & Closure Demand.................. 896 Vacuum Threaded PlasticCap & Closure Demand.................. 917 Plastic Dispensing Cap & ClosureDemand by Type & Market............. 948 Unthreaded Plastic Cap & ClosureDemand by Type........................ 1029 Plastic Lid Demand by Market......... 10510 Aerosol Cap & Closure Demandby Type & Market....................... 10811 Synthetic Cork Demand.................. 11212 Plastic Child-Resistant Cap &Closure Demand by Type............. 11413 Metal Cap & ClosureSupply & Demand...................... 12014 Metal Screw & Lug Cap & ClosureDemand by Type & Market........... 12315 Vacuum Screw & Lug Cap& Closure Demand..................... 12616 Nonvacuum Screw & LugCap & Closure Demand................ 12717 Metal Crown Demand..................... 13018 Metal Roll-On Closure Demand........ 13319 Other Metal Cap & Closure Demand.. 13620 Other Cap & ClosureSupply & Demand...................... 13821 Elastomer & RubberStopper Demand........................ 14122 Cork Closure Demand..................... 14423 Paperboard Cap & Closure Demand... 146MARKETS1 Cap & Closure Demand by Market.... 1502 Beverage Indicators...................... 1543 Beverage Cap & Closure Demandby Market & Material.................. 1564 Carbonated Soft Drink Cap& Closure Market....................... 1595 Bottled Water Cap & Closure Market 1616 Fruit Beverage Cap & Closure Market 1637 Wine & Spirits Cap & Closure Market 1658 Milk Cap & Closure Market.............. 1689 Beer Cap & Closure Market............. 17010 Other Beverage Cap &Closure Markets......................... 17311 Pharmaceutical Supply & Demand.... 17612 Pharmaceutical Cap& Closure Market....................... 18013 Food Indicators............................ 18414 Food Cap & Closure Demandby Market & Material.................. 18715 Dairy Product Cap & Closure Demand 19016 Sauce & Condiment Cap& Closure Market....................... 19417 Other Food Cap & Closure Market..... 19818 Cosmetic & ToiletrySupply & Demand...................... 20119 Cosmetic & Toiletry Cap& Closure Market....................... 20320 Household Cleaning ChemicalShipments................................ 20821 Household Cleaning ProductCap & Closure Market................. 21122 Automotive Chemical Indicators...... 21423 Automotive Chemical Cap& Closure Market....................... 21724 Other Cap & Closure Markets........... 220INDUSTRY STRUCTURE1 US Cap & Closure Salesby Company, 2009..................... 2242 Selected Acquisitions & Divestitures 2333 Selected Cooperative Agreements.... 241List of ChartsMarket EnvironmenT1 Cap & Closure Market, 1999-2009...... 392 Cap & Closure Imports &Exports by Country, 2009.............. 52RAW MATERIALS1 Raw Material Use in <strong>Caps</strong> & <strong>Closures</strong>.. 55PRODUCTS1 Cap & Closure Demand by Material..... 752 Plastic Cap & Closure Demandby Type, 2009............................. 793 Metal Cap & Closure Demandby Type, 2009........................... 121MARKETS1 Cap & Closure Demandby Market, 2009........................ 151INDUSTRY STRUCTURE1 US Cap & ClosureMarket Share, 2009.................... 227Page Click here to purchase onlineOrder now, click here!
Study #2688October 2010$4900310 Pages<strong>Caps</strong> & <strong>Closures</strong>US Industry Study with Forecasts for 2014 & 2019Advances will be aided by greater use of more expensive dispensing closures and child-resistantclosures (CRCs), as well as by the continued popularity of single-serving containers.US demand to grow 4%annually through 2014US demand for caps and closures isforecast to increase 4.0 percent per yearto $9.5 billion in 2014, reaching 275billion units. Advances will be aided bygreater use of more expensive dispensingclosures and child-resistant closures(CRCs). Unit gains will be supported bythe continued popularity of single-servingcontainers, especially in the beveragemarket, and further inroads by plasticcontainers in applications formerlydominated by glass and metal containers.However, unit advances will deceleratefrom the pace of the 1999-2009period based on the maturity of severallarge beverage applications and environmentalconcerns regarding bottled water.Competition from closureless packagingformats, such as aluminum beveragecans, most stand-up pouches, andblister packs, will moderate gains, as willthe use of flexible foil, paper and filmlidding rather than rigid lids in manyapplications.Plastic caps, closures to remaindominant, lead gainsPlastic caps and closures, which comprised79 percent of unit demand in2009, will post above-average unit andvalue advances, reflecting continuedinroads by plastic containers into numerousmarkets. Plastic cap and closuredemand is forecast to climb 4.5 percentannually to $7.7 billion in 2014, supportedby the long-term shift in theUS Cap & Closure Demand, 2009($7.8 billion)consumer packaging mix away fromglass and metal containers to plasticalternatives, as plastic containers tend toemploy plastic closures. Moreover, thecompatibility of plastic caps with glasscontainers and the use of such caps ongabletop cartons will boost growth.However, gains will decelerate from the1999-2009 performance, reflecting thealready significant penetration of plasticcontainers in most markets as mostlarge-scale conversions have alreadytaken place.Metal cap and closure demand isexpected to decline moderately through2014 as a result of further inroads byplastic containers and closures and asluggish outlook for production of beer,Plastic79%Metal11%Other10%the dominant application for metalcrowns. Among major cap and closurematerials, elastomer and rubber stopperswill experience the fastest growththrough 2014 based on increasingpreferences for stoppers made fromhigher value-added elastomeric andsynthetic rubber materials. Gains willalso be driven by the continuing commercializationof injectable biotechnology-baseddrugs and the increasingavailability of parenteral medication inprefilled syringes. Demand for naturalcork closures will be adversely affectedby inroads from synthetic corks andaluminum roll-on closures in the wineindustry.photo: O-ICopyright 2010 <strong>The</strong> <strong>Freedonia</strong> <strong>Group</strong>, Inc.Page Click here to purchase onlineOrder now, click here!
Study #2688October 2010$4900310 Pages<strong>Caps</strong> & <strong>Closures</strong>US Industry Study with Forecasts for 2014 & 2019Sample Text,Table & ChartTABLE IV-2PLASTIC CAP & CLOSURE SUPPLY & DEMAND(million dollars)Item 1999 2004 2009 2014 2019Total <strong>Caps</strong> & <strong>Closures</strong> (bil units) 167.9 200.6 241.6 274.5 308.0% plastic 68.1 74.0 77.9 79.8 81.0productsPlastic <strong>Caps</strong> & <strong>Closures</strong> (bil units) 114.3 148.4 188.3 219.1 249.6Metal <strong>Caps</strong> & <strong>Closures</strong>cents/unit 2.7 2.9 3.3 3.5 3.9US demand for metal caps and closures is expected to register asamplemodest decline through 2014, losing further ground to plastic closures. Plastic Cap & Closure Demand 3039 4290 6165 7675 9615A sluggish outlook will be based on the ongoing supplantation of glass Threaded 1413 1936 table 2785 3345 4070containers -- which generally employ metal caps and closures -- by plasticDispensing 673 1001 1500 1990 2645alternatives and compatible plastic closures. In addition, many plastic Unthreadedclosures can be used with glass bottles and jars, further eroding demand Child-Resistantfor metal closure products. Moreover, marginal growth for beer production469484678675950 1180 1460930 1160 1440-- a principal application for metal closures -- will be a factor in + net exportsweak prospects for metal closures. However, the overall outlook masks26 28 35 30 30well-above average growth (albeit from a smaller base) in aluminum Plastic Cap & Closure Shipments 3065 4318 6200 7705 9645roll-on closures for wine packaging. Additionally, increasing usage ofaluminum bottles in certain beverage applications will benefit demandfor the metal caps and closures -- typically crowns and roll-ons -- usedwith these containers. In value terms, metal cap and closure demand willfall to $855 million in 2014 as a result of leveling off or slight declines inpricing after the price surges seen in the 2004-2009 period.Despite their dwindling market share, metal caps and closuresexhibit numerous textadvantages, including strength, the ability to createa tamper-evident vacuum seal, superior barrier properties and goodaesthetics (e.g., an upscale image in many applications and amenabilityto high-quality metal lithographic printing). However, improvementsin plastic containers and plastic closures have allowed plastic closuresto penetrate many hot-fill food and beverage markets once exclusivelyserved by metal closures. In the case of metal vacuum caps, an expensive,energy-intensive steam process is typically needed to soften theplastisol gasket inside the cap. In order to cut costs and eliminate stepsin the packaging process, many producers have opted for hot-fill bottlingmethods that use less costly plastic caps that do not need steaming.Since metal caps and closures are primarily used with glass bottlesand jars, growth prospects are heavily influenced by those forecast for118sampleCopyright 2010 <strong>The</strong> <strong>Freedonia</strong> <strong>Group</strong>, Inc.O th e rs5 8 .2 %CHART VI-1US CAP & CLOSURE MARKET SHARE, 2009($7.8 billion)O th e r L e a d e rs1 0 .5 %M a rke tL e a d e rs3 1 .3 %samplechart9.1%5.0%4.9%4.2%4.2%3.9%R examAp t arG ro u pB erry Plast icsSilg anR eyn o ld s G rpM ead W est v acoPage Click here to purchase onlineOrder now, click here!
Study #2688October 2010$4900310 Pages<strong>Caps</strong> & <strong>Closures</strong>US Industry Study with Forecasts for 2014 & 2019Sample Profile,Table & ForecastTABLE V-8MILK CAP & CLOSURE MARKET(million units)Item 1999 2004 2009 2014 2019Milk Container Demand (bil units) 18.1 18.0 18.9 19.5 20.0% with closures 39.3 48.8 53.8 57.7 60.9Milk Closure Demand 7105 8790 10175 11245 12180Plastic: 7080 8770sample10155 11225 12160Standard (Threaded) 3190 5480 7225 8425 9420Lids 3850 3200 2800 2630 2530tableDispensing 40 90 130 170 210Metal 25 20 20 20 20COMPANY PROFILEScents/unit 1.3 1.7 2.1 2.2 2.5Drug Plastics and Glass Company Incorporated1 Bottle DriveBoyertown, PA 19512610-367-5000http://www.drugplastics.comsampleprofileAnnual Sales: $170 million (estimated)Employment: over 620 (estimated)Key Products: senior-friendly child-resistant, continuous thread anddispensing closuresDrug Plastics and Glass (DP&G) is a privately held manufacturerof plastic bottles, jars and closures. <strong>The</strong> Company markets its productsto the pharmaceutical, personal care, cosmetic, chemical and foodindustries.<strong>The</strong> Company is involved in the US cap and closure industrythrough the production of senior-friendly child-resistant, continuousthread and dispensing closures. <strong>The</strong>se items are manufactured throughDP&G’s makes these products through its Drug Plastics <strong>Closures</strong> subsidiary(Boyertown, Pennsylvania).Senior-friendly child-resistant closures produced by Drug Plastics<strong>Closures</strong>, which are sold under the SECURX brand name, are madefrom polypropylene in 24- to 63-millimeter (mm) sizes. SECURX closuresfeature a push-and-turn design and are available with ribbed skirtsand debossed text or pictorial tops. <strong>The</strong>se closures are suitable for usein automotive chemical, household chemical, lawn and garden product,personal care, pharmaceutical, pool chemical, and vitamin packagingapplications. Continuous thread closures from the company are madewith smooth or matte tops and ribbed or smooth skirts. Drug PlasticsMilk Closure Demand (mil $) 95 150 215 250 305“Demand for caps and closures inmilk packaging is expected to expand3.1 percent annually to $250 millionin 2014, with demand in unit termsclimbing 2.0 percent per year to 11.2billion units. Although demand forfluid white milk in conventional gallonand half-gallon containers will postlimited growth, demand for flavoredmilk and single-serving containers ofmilk will expand significantly faster.”--Section V, pg. 165-6263Copyright 2010 <strong>The</strong> <strong>Freedonia</strong> <strong>Group</strong>, Inc.Page Click here to purchase onlineOrder now, click here!
Order InformationFive Convenient Ways to OrderINDUSTRY MARKET RESEARCH FOR BUSINESSLEADERS, STRATEGISTS, DECISION MAKERSONLINE: www.freedoniagroup.comMAIL: Print out and complete the orderform and send to <strong>The</strong> <strong>Freedonia</strong> <strong>Group</strong>(see address at the bottom of this form)PHONE: Call toll free, 800.927.5900(US) or +1 440.684.9600FAX: +1 440.646.0484 (US)EMAIL: info@freedoniagroup.comFree Handling & Shipping<strong>The</strong>re is NO charge for handling or UPS shippingin the US. Expect delivery in 3 to 5 business days.Outside the US, <strong>Freedonia</strong> provides free airmailservice. Express delivery is available at cost.Orders Outside of the USChecks must be made payable in US funds,drawn against a US bank and mailed directly to<strong>The</strong> <strong>Freedonia</strong> <strong>Group</strong>. For wire transfers pleasecontact our customer service department at info@freedoniagroup.com. Credit cards accepted.Credit Card OrdersFor convenience, <strong>Freedonia</strong> accepts American Express,MasterCard or Visa. Credit card purchasesmust include account number, expiration date andauthorized signature.Save 15%If you order three (3) different titles at the sametime, you can receive a 15% discount. If yourorder is accompanied by a check or wire transfer,you may take a 5% cash discount (discounts donot apply to Corporate Use Licenses).Corporate Use LicenseNow every decision maker in your organization can act on the key intelligence found in all<strong>Freedonia</strong> studies. For an additional $2600, companies receive unlimited use of an electronicversion (PDF) of the study. Place it on your intranet, e-mail it to coworkers around the world,or print it as many times as you like,Click here to learn more aboutthe Corporate Use LicenseOrder FormF-WEB.-2688Name<strong>Caps</strong> & <strong>Closures</strong>............................................................. $4900Corporate Use License (add to study price) * +$2600Additional Print Copies @ $600 each *Total (including selected option) $Enclosed is my check (5% discount) drawn on a US bank and payable to<strong>The</strong> <strong>Freedonia</strong> <strong>Group</strong>, Inc., in US funds (Ohio residents add 7.75% sales tax)TitleCompanyDivisionStreet(No PO Box please)Bill my companyAmerican ExpressMasterCardVisaCity/State/ZipMMYYCountryCredit Card #ExpirationPhoneFaxSignatureEmail* Please check appropriate option and sign below to order an electronicversion of the study.Corporate Use License Agreement<strong>The</strong> above captioned study may be stored on the company’s intranet orshared directory, available to company employees. Copies of the study maybe made, but the undersigned represents that distribution of the study willbe limited to employees of the company.Individual Use License Agreement<strong>The</strong> undersigned hereby represents that the above captioned study will beused by only ___ individual(s) who are employees of the company and thatthe study will not be loaded on a network for multiple users. In the eventthat usage of the study changes, the Company will promptly notify <strong>Freedonia</strong>of such change and will pay to <strong>Freedonia</strong> the appropriate fee based on<strong>Freedonia</strong>’s standard fee schedule then in effect. Note: Entire company corporateuse license, add $2600; one additional user, add $600; two additionalusers, add $1200; three additional users, add $1800.SignatureSignature<strong>The</strong> <strong>Freedonia</strong> <strong>Group</strong>, Inc. 767 Beta Drive • Cleveland, OH • 44143-2326 • USA • Web site: www.freedoniagroup.comTel US: 800.927.5900 or +1 440.684.9600 • Fax: +1 440.646.0484 • e-mail: info@freedoniagroup.comPage 7
INDUSTRY MARKET RESEARCH FOR BUSINESS LEADERS, STRATEGISTS, DECISION MAKERSOther StudiesWorld <strong>Caps</strong> & <strong>Closures</strong>World demand for caps and closures will rise 4.6%annually through 2014. Growth will be based inpart by a shift toward higher-value closures such aschild-resistant, tamper-evident and dispensing types.Some of the best opportunities will be found in theAsia/Pacific region, where over two-fifths of marketgains will occur. This study analyzes the $32 billionworld cap and closure industry, with forecasts for2014 and 2019 by material, market, world region andfor 18 countries. It also evaluates company marketshare and profiles industry participants.#2719.................January 2011.................. $6100Pharmaceutical PackagingDemand for pharmaceutical packaging in the US isforecast to increase 5.3% annually through 2014.Gains will be driven by recently upgraded regulationsand standards that will boost demand for highvalue-added containers and accessories. Parenteralcontainers and labels will be among the fastest growingtypes. This study analyzes the $14.3 billion USpharmaceutical packaging industry, with forecasts for2014 and 2019 by type and market. It also evaluatescompany market share and profiles industry players.#2645...............September 2010................ $4900Cups & LidsUS demand for cups and lids will increase 4.4%per year to 2014, driven by expanding foodservicerevenues and favorable prospects for food packagingcups. Value gains will be bolstered by increasingdemand for environmentally friendly cups, such ascups made from higher-value biodegradable resins orrecycled content. This study analyzes the $6.6 billionUS cups and lids industry, with forecasts for 2014 and2019 by product and market. It also evaluates companymarket share and profiles industry players.#2679................. August 2010.................. $4800Plastic ContainersUS plastic container demand will rise 4.3% yearly to2014, driven by performance advantages over alternativepackaging media. Bottles and jars will remainthe dominant type, while pails and other containersgrow the fastest. PET and HDPE will remain the mostcommon resins while polypropylene leads gains.This study analyzes the 12.5 billion pound US plasticcontainer industry, with forecasts for 2014 and 2019by type and resin. It also evaluates company marketshare and profiles industry players.#2672................. August 2010.................. $4900About <strong>The</strong> <strong>Freedonia</strong> <strong>Group</strong><strong>The</strong> <strong>Freedonia</strong> <strong>Group</strong>, Inc., is a leading international industry market research companythat provides its clients with information and analysis needed to make informedstrategic decisions for their businesses. Studies help clients identify business opportunities,develop strategies, make investment decisions and evaluate opportunitiesand threats. <strong>Freedonia</strong> research is designed to deliver unbiased views and reliableoutlooks to assist clients in making the right decisions. <strong>Freedonia</strong> capitalizes onthe resources of its proprietary in-house research team of experienced economists,professional analysts, industry researchers and editorial groups. <strong>Freedonia</strong> covers adiverse group of industries throughout the United States, the emerging China market,and other world markets. Industries analyzed by <strong>Freedonia</strong> include:• Chemicals • Plastics • Life Sciences • Packaging • Building Materials • Security& Electronics • Industrial Components & Equipment • Automotive & TransportationEquipment • Household Goods • Energy/Power Equipment<strong>Freedonia</strong> Custom ResearchClick here to learn more about <strong>Freedonia</strong><strong>Freedonia</strong> Custom Research delivers the same high quality, thorough and unbiasedassessment of an industry or market as an industry study. Since the research initiativeis based upon a company’s specific needs, companies harness <strong>Freedonia</strong>’sresearch capabilities and resources to answer unique questions. When you leveragethe results of a <strong>Freedonia</strong> Custom Research engagement, you are able to obtainimportant answers to specific questions and issues associated with: mergers andacquisitions, new product launches/development, geographic expansion, entry intonew markets, strategic business planning, and investment and funding decisions.<strong>Freedonia</strong> Custom Research is ideal for companies seeking to make a strategic differencein the status quo and focus on future business growth. Working side by sidewith clients, <strong>Freedonia</strong>’s team is able to define a research project that is customtailoredto answer specific questions and provide the basis from which a companycan make informed business decisions.Click here to learn more about Custom ResearchTube & Stick PackagingUS tube and stick packaging demand will rise5.1% annually through 2014. <strong>The</strong> fastest gains areexpected for stick packs, driven by advantagesof product differentiation, portability and materialsavings compared to conventional single-portionpouches. <strong>The</strong> dominant squeeze tube segment willslightly lag the overall industry. This study analyzesthe $1.4 billion tube and stick packaging industry,with forecasts for 2014 and 2019 by product type andmarket. It also evaluates company market share andprofiles industry players.#2631................... May 2010.................... $4800Click here for complete title listClick here to visit freedoniagroup.comPage 8<strong>The</strong> <strong>Freedonia</strong> <strong>Group</strong>, Inc. 767 Beta Drive • Cleveland, OH • 44143-2326 • USA • Web site: www.freedoniagroup.comTel US: 800.927.5900 or +1 440.684.9600 • Fax: +1 440.646.0484 • e-mail: info@freedoniagroup.com