

Annual Report Samas NV 2008 2009 Annual ... - Alle jaarverslagen
Annual Report Samas NV 2008 2009 Annual ... - Alle jaarverslagen
Annual Report Samas NV 2008 2009 Annual ... - Alle jaarverslagen
- No tags were found...

Create successful ePaper yourself
Turn your PDF publications into a flip-book with our unique Google optimized e-Paper software.
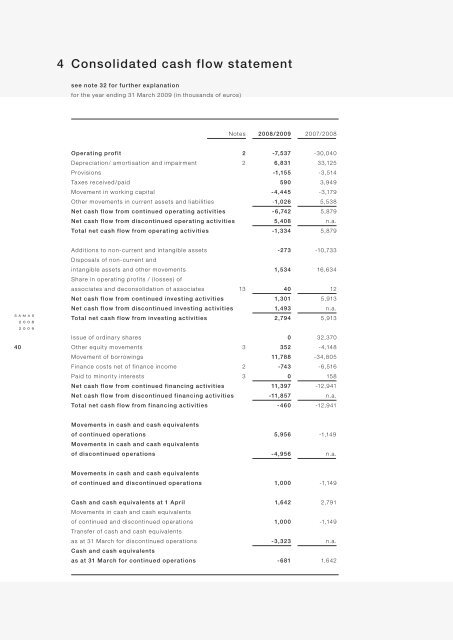
4 Consolidated cash flow statementsee note 32 for fur ther explanationfor the year ending 31 March <strong>2009</strong> (in thousands of euros)Notes <strong>2008</strong> /<strong>2009</strong> 2007/<strong>2008</strong>Operating profit 2 -7,537 -30,040Depreciation / amor tisation and impairment 2 6,831 33,125Provisions -1,155 -3,514Taxes received /paid 590 3,949Movement in working capital - 4,445 -3,179Other movements in current assets and liabilities -1,026 5,538Net cash flow from continued operating activities -6,742 5,879Net cash flow from discontinued operating activities 5,408 n.a.Total net cash flow from operating activities -1,334 5,879S a m a s2 0 0 82 0 0 940Additions to non-current and intangible assets -273 -10,733Disposals of non-current andintangible assets and other movements 1,534 16,634Share in operating profits / (losses) ofassociates and deconsolidation of associates 13 40 12Net cash flow from continued investing activities 1,301 5,913Net cash flow from discontinued investing activities 1,493 n.a.Total net cash flow from investing activities 2,794 5,913Issue of ordinar y shares 0 32,370Other equity movements 3 352 -4,148Movement of borrowings 11,788 -34,805Finance costs net of finance income 2 -743 -6,516Paid to minority interests 3 0 158Net cash flow from continued financing activities 11,397 -12,941Net cash flow from discontinued financing activities -11,857 n.a.Total net cash flow from financing activities - 460 -12,941Movements in cash and cash equivalentsof continued operations 5,956 -1,149Movements in cash and cash equivalentsof discontinued operations - 4,956 n.a.Movements in cash and cash equivalentsof continued and discontinued operations 1,000 -1,149Cash and cash equivalents at 1 April 1,642 2,791Movements in cash and cash equivalentsof continued and discontinued operations 1,000 -1,149Transfer of cash and cash equivalentsas at 31 March for discontinued operations -3,323 n.a.Cash and cash equivalentsas at 31 March for continued operations -681 1,642


