The Bulletin, Vol. 40, No. 1 September/October 1996 from the NL ...
The Bulletin, Vol. 40, No. 1 September/October 1996 from the NL ...
The Bulletin, Vol. 40, No. 1 September/October 1996 from the NL ...
- No tags were found...
Create successful ePaper yourself
Turn your PDF publications into a flip-book with our unique Google optimized e-Paper software.
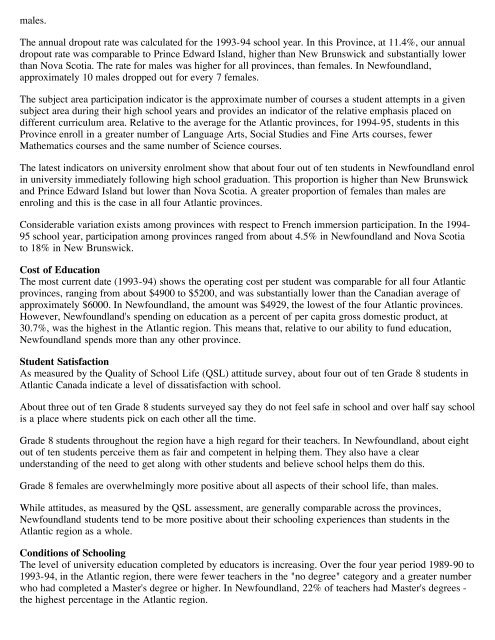
males.<strong>The</strong> annual dropout rate was calculated for <strong>the</strong> 1993-94 school year. In this Province, at 11.4%, our annualdropout rate was comparable to Prince Edward Island, higher than New Brunswick and substantially lowerthan <strong>No</strong>va Scotia. <strong>The</strong> rate for males was higher for all provinces, than females. In Newfoundland,approximately 10 males dropped out for every 7 females.<strong>The</strong> subject area participation indicator is <strong>the</strong> approximate number of courses a student attempts in a givensubject area during <strong>the</strong>ir high school years and provides an indicator of <strong>the</strong> relative emphasis placed ondifferent curriculum area. Relative to <strong>the</strong> average for <strong>the</strong> Atlantic provinces, for 1994-95, students in thisProvince enroll in a greater number of Language Arts, Social Studies and Fine Arts courses, fewerMa<strong>the</strong>matics courses and <strong>the</strong> same number of Science courses.<strong>The</strong> latest indicators on university enrolment show that about four out of ten students in Newfoundland enrolin university immediately following high school graduation. This proportion is higher than New Brunswickand Prince Edward Island but lower than <strong>No</strong>va Scotia. A greater proportion of females than males areenroling and this is <strong>the</strong> case in all four Atlantic provinces.Considerable variation exists among provinces with respect to French immersion participation. In <strong>the</strong> 1994-95 school year, participation among provinces ranged <strong>from</strong> about 4.5% in Newfoundland and <strong>No</strong>va Scotiato 18% in New Brunswick.Cost of Education<strong>The</strong> most current date (1993-94) shows <strong>the</strong> operating cost per student was comparable for all four Atlanticprovinces, ranging <strong>from</strong> about $4900 to $5200, and was substantially lower than <strong>the</strong> Canadian average ofapproximately $6000. In Newfoundland, <strong>the</strong> amount was $4929, <strong>the</strong> lowest of <strong>the</strong> four Atlantic provinces.However, Newfoundland's spending on education as a percent of per capita gross domestic product, at30.7%, was <strong>the</strong> highest in <strong>the</strong> Atlantic region. This means that, relative to our ability to fund education,Newfoundland spends more than any o<strong>the</strong>r province.Student SatisfactionAs measured by <strong>the</strong> Quality of School Life (QSL) attitude survey, about four out of ten Grade 8 students inAtlantic Canada indicate a level of dissatisfaction with school.About three out of ten Grade 8 students surveyed say <strong>the</strong>y do not feel safe in school and over half say schoolis a place where students pick on each o<strong>the</strong>r all <strong>the</strong> time.Grade 8 students throughout <strong>the</strong> region have a high regard for <strong>the</strong>ir teachers. In Newfoundland, about eightout of ten students perceive <strong>the</strong>m as fair and competent in helping <strong>the</strong>m. <strong>The</strong>y also have a clearunderstanding of <strong>the</strong> need to get along with o<strong>the</strong>r students and believe school helps <strong>the</strong>m do this.Grade 8 females are overwhelmingly more positive about all aspects of <strong>the</strong>ir school life, than males.While attitudes, as measured by <strong>the</strong> QSL assessment, are generally comparable across <strong>the</strong> provinces,Newfoundland students tend to be more positive about <strong>the</strong>ir schooling experiences than students in <strong>the</strong>Atlantic region as a whole.Conditions of Schooling<strong>The</strong> level of university education completed by educators is increasing. Over <strong>the</strong> four year period 1989-90 to1993-94, in <strong>the</strong> Atlantic region, <strong>the</strong>re were fewer teachers in <strong>the</strong> "no degree" category and a greater numberwho had completed a Master's degree or higher. In Newfoundland, 22% of teachers had Master's degrees <strong>the</strong> highest percentage in <strong>the</strong> Atlantic region.


