Nanostructured Spinel ZnFe2O4 for the Detection of ... - ResearchGate
Nanostructured Spinel ZnFe2O4 for the Detection of ... - ResearchGate
Nanostructured Spinel ZnFe2O4 for the Detection of ... - ResearchGate
- No tags were found...

Create successful ePaper yourself
Turn your PDF publications into a flip-book with our unique Google optimized e-Paper software.
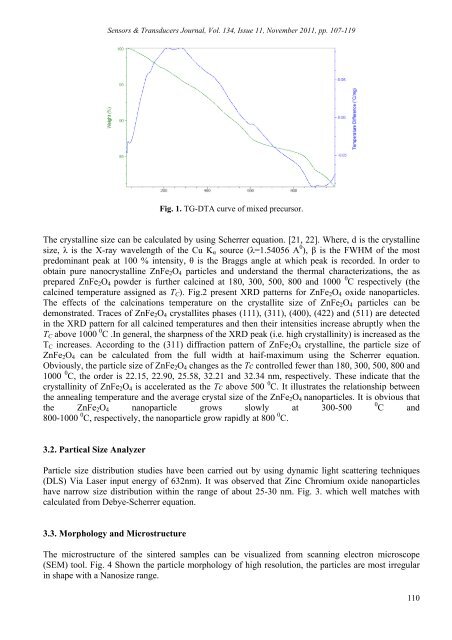
Sensors & Transducers Journal, Vol. 134, Issue 11, November 2011, pp. 107-119Fig. 1. TG-DTA curve <strong>of</strong> mixed precursor.The crystalline size can be calculated by using Scherrer equation. [21, 22]. Where, d is <strong>the</strong> crystallinesize, λ is <strong>the</strong> X-ray wavelength <strong>of</strong> <strong>the</strong> Cu K α source (λ=1.54056 A 0 ), β is <strong>the</strong> FWHM <strong>of</strong> <strong>the</strong> mostpredominant peak at 100 % intensity, θ is <strong>the</strong> Braggs angle at which peak is recorded. In order toobtain pure nanocrystalline ZnFe 2 O 4 particles and understand <strong>the</strong> <strong>the</strong>rmal characterizations, <strong>the</strong> asprepared ZnFe 2 O 4 powder is fur<strong>the</strong>r calcined at 180, 300, 500, 800 and 1000 0 C respectively (<strong>the</strong>calcined temperature assigned as T C ). Fig.2 present XRD patterns <strong>for</strong> ZnFe 2 O 4 oxide nanoparticles.The effects <strong>of</strong> <strong>the</strong> calcinations temperature on <strong>the</strong> crystallite size <strong>of</strong> ZnFe 2 O 4 particles can bedemonstrated. Traces <strong>of</strong> ZnFe 2 O 4 crystallites phases (111), (311), (400), (422) and (511) are detectedin <strong>the</strong> XRD pattern <strong>for</strong> all calcined temperatures and <strong>the</strong>n <strong>the</strong>ir intensities increase abruptly when <strong>the</strong>T C above 1000 0 C .In general, <strong>the</strong> sharpness <strong>of</strong> <strong>the</strong> XRD peak (i.e. high crystallinity) is increased as <strong>the</strong>T C increases. According to <strong>the</strong> (311) diffraction pattern <strong>of</strong> ZnFe 2 O 4 crystalline, <strong>the</strong> particle size <strong>of</strong>ZnFe 2 O 4 can be calculated from <strong>the</strong> full width at haif-maximum using <strong>the</strong> Scherrer equation.Obviously, <strong>the</strong> particle size <strong>of</strong> ZnFe 2 O 4 changes as <strong>the</strong> Tc controlled fewer than 180, 300, 500, 800 and1000 0 C, <strong>the</strong> order is 22.15, 22.90, 25.58, 32.21 and 32.34 nm, respectively. These indicate that <strong>the</strong>crystallinity <strong>of</strong> ZnFe 2 O 4 is accelerated as <strong>the</strong> Tc above 500 0 C. It illustrates <strong>the</strong> relationship between<strong>the</strong> annealing temperature and <strong>the</strong> average crystal size <strong>of</strong> <strong>the</strong> ZnFe 2 O 4 nanoparticles. It is obvious that<strong>the</strong> ZnFe 2 O 4 nanoparticle grows slowly at 300-5000 C and800-1000 0 C, respectively, <strong>the</strong> nanoparticle grow rapidly at 800 0 C.3.2. Partical Size AnalyzerParticle size distribution studies have been carried out by using dynamic light scattering techniques(DLS) Via Laser input energy <strong>of</strong> 632nm). It was observed that Zinc Chromium oxide nanoparticleshave narrow size distribution within <strong>the</strong> range <strong>of</strong> about 25-30 nm. Fig. 3. which well matches withcalculated from Debye-Scherrer equation.3.3. Morphology and MicrostructureThe microstructure <strong>of</strong> <strong>the</strong> sintered samples can be visualized from scanning electron microscope(SEM) tool. Fig. 4 Shown <strong>the</strong> particle morphology <strong>of</strong> high resolution, <strong>the</strong> particles are most irregularin shape with a Nanosize range.110