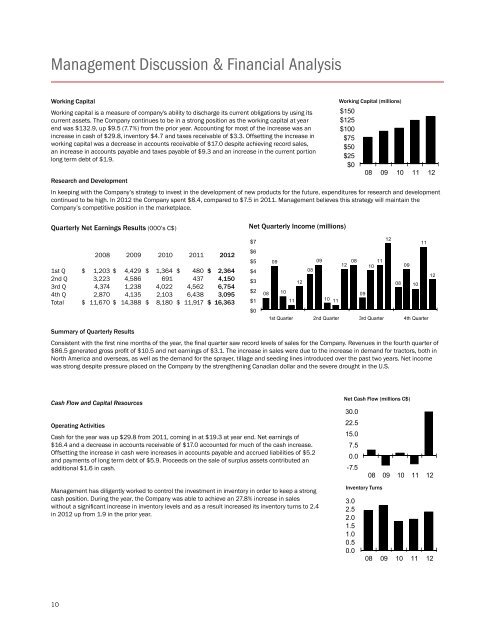
Management Discussion & Financial AnalysisWorking CapitalWorking Capital (millions)Working capital is a measure of company's ability to discharge its current obligations by using itscurrent assets. The Company continues to be in a strong position as the working capital at yearend was $132.9, up $9.5 (7.7%) from the prior year. Accounting for most of the increase was an$150$125$100increase in cash of $29.8, inventory $4.7 and taxes receivable of $3.3. Offsetting the increase in $75working capital was a decrease in accounts receivable of $17.0 despite achieving record sales,$50an increase in accounts payable and taxes payable of $9.3 and an increase in the current portion$25long term debt of $1.9.$008 09 10 11 12Research and DevelopmentIn keeping with the Company’s strategy to invest in the development of new products for the future, expenditures for research and developmentcontinued to be high. In 2012 the Company spent $8.4, compared to $7.5 in 2011. Management believes this strategy will maintain theCompany’s competitive position in the marketplace.Quarterly Net Earnings Results (000’s C$)Net Quarterly <strong>Inc</strong>ome (millions)2008 2009 2010 2011 20121st Q $ 1,203 $ 4,429 $ 1,364 $ 480 $ 2,3642nd Q 3,223 4,586 691 437 4,1503rd Q 4,374 1,238 4,022 4,562 6,7544th Q 2,870 4,135 2,103 6,438 3,095Total $ 11,670 $ 14,388 $ 8,180 $ 11,917 $ 16,363$7$6$5$4$3$2$1$0121109 0908 1112 100809121208 1008 100911 10 111st Quarter 2nd Quarter 3rd Quarter 4th QuarterSummary of Quarterly ResultsConsistent with the first nine months of the year, the final quarter saw record levels of sales for the Company. Revenues in the fourth quarter of$86.5 generated gross profit of $10.5 and net earnings of $3.1. The increase in sales were due to the increase in demand for tractors, both inNorth America and overseas, as well as the demand for the sprayer, tillage and seeding lines introduced over the past two years. Net incomewas strong despite pressure placed on the Company by the strengthening Canadian dollar and the severe drought in the U.S.Cash Flow and Capital ResourcesOperating ActivitiesCash for the year was up $29.8 from 2011, coming in at $19.3 at year end. Net earnings of$16.4 and a decrease in accounts receivable of $17.0 accounted for much of the cash increase.Offsetting the increase in cash were increases in accounts payable and accrued liabilities of $5.2and payments of long term debt of $5.9. Proceeds on the sale of surplus assets contributed anadditional $1.6 in cash.Management has diligently worked to control the investment in inventory in order to keep a strongcash position. During the year, the Company was able to achieve an 27.8% increase in saleswithout a significant increase in inventory levels and as a result increased its inventory turns to 2.4in 2012 up from 1.9 in the prior year.Net Cash Flow (millions C$)30.022.515.07.50.0-7.5Inventory Turns3.02.52.01.51.00.50.008 09 10 11 1208 09 10 11 1210
Management Discussion & Financial AnalysisInvesting ActivitiesCash used during the year for investing activities was $0.9. Cash utilized in investing activitiesin the prior year was $20.2, most of which funded the seeding and tillage acquisition. Capitalpurchases of $2.5 were offset by the proceeds on the sale of excess land and building of $1.6.Asset Purchases (millions)$10$8$6$4$2$008 09 10 11 12Financing ActivitiesThe Company had an outflow of cash during the year of $5.9 for repayment of long term debt offset by a $0.5 decrease in long term receivables,for a net outflow of $5.4. This compares to 2011 where the Company increase long term debt by $17.1 and reduced long term receivables by$4.0 offset by a repayment of long term debt of $1.6.ResourcesIn order for the Company to operate and grow, continued funding resources are required. The Company has several options for funding availableto it, such as cash in the bank, cash provided by operations and acquiring new debt. Under the current bank agreements in place, the Companyhas access to a $67.5 credit facilities.Risks and Financial InstrumentsThe Company recognizes that net earnings are exposed to changes in market interest rates, foreign exchange rates, prices of raw materials andrisks regarding the <strong>financial</strong> condition of customers. These market conditions are regularly monitored and actions are taken when appropriate.Despite the methods employed to manage these risks, future fluctuations in interest rates, exchange rates, raw material costs and customerscondition can be expected to impact net earnings.The Company may enter into fixed-rate debt to minimize the risk associated with interest rate fluctuations. In addition, the Company may employhedging programs to minimize foreign exchange risks associated with the changes in the value of the Canadian dollar relative to the U.S. dollar.To the extent possible, the Company maximizes natural currency hedging by matching inflows from sales in either currency with outflows of costsand expenses denominated in the same currency. A portion of the remaining exposure to fluctuations in exchange rates may be mitigated withforward and option contracts.The Company currently has a variable interest bank credit facility, a low interest loan from the State of South Dakota, two loans from the Stateof North Dakota (one of which is zero interest, the other at low interest), loans from the Bank of Montreal, the Canadian Imperial Bank ofCommerce, Heloval Holdings Ltd., US Bank and the Southwest Initiative Foundation. Should future cash requirements result in additional debtbe taken on, management would evaluate the financing options available at that time and take a course of action that is in the best interests ofthe Company in the long term. Currently, all of the financing needs of the Company are being met by the bank credit facility, which carries a lowrate of variable interest.With respect to foreign exchange, the Company manages risk by use of the natural hedge that exists between the U.S. dollar denominatedaccounts receivables and accounts payable. Where a large difference in this hedge is anticipated, forward foreign exchange contracts may beentered into to mitigate the risk. Purchases of foreign exchange products for the purpose of speculation are not permitted. Transactions are onlyconducted with certain approved <strong>financial</strong> institutions. Fluctuations in foreign exchange rates represent a material exposure for the Company’s<strong>financial</strong> results. Hedging programs employed may mitigate a portion of exposures to short-term fluctuations in foreign currency exchange rates.The Company’s <strong>financial</strong> results over the long term will be affected by sizeable changes in the value of the Canadian dollar relative to the U.S.dollar.Credit risk arises from cash held with banks and credit exposure to customers, including outstanding accounts receivable. The Companyassesses the credit quality of customers, taking into account their <strong>financial</strong> position, past experience and other factors. Management regularlymonitors customer credit limits, performs credit reviews and, in certain cases, insures accounts receivable balances against credit losses.Nonetheless, unexpected deterioration in the <strong>financial</strong> condition of a customer can have a negative impact on net earnings in the case ofdefault.11


