complete financial statement - Buhler Industries Inc.
complete financial statement - Buhler Industries Inc.
complete financial statement - Buhler Industries Inc.
- No tags were found...

You also want an ePaper? Increase the reach of your titles
YUMPU automatically turns print PDFs into web optimized ePapers that Google loves.
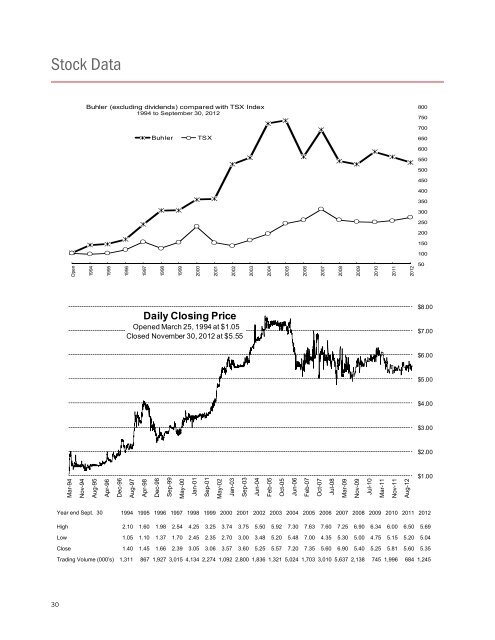
Stock Data<strong>Buhler</strong> (excluding dividends) compared with TSX Index1994 to September 30, 2012800750<strong>Buhler</strong>TSX700650600550500450400350300250200150100Open199419951996199719981999200020012002200320042005200620072008200920102011201250Daily Closing PriceOpened March 25, 1994 at $1.05Closed November 30, 2012 at $5.55$8.00$7.00$6.00$5.00$4.00$3.00$2.00Mar-94Nov-94Aug-95Apr-96Dec-96Aug-97Apr-98Dec-98Sep-99May-00Jan-01Sep-01May-02Jan-03Sep-03Jun-04Feb-05Oct-05Jun-06Feb-07Oct-07Jul-08Mar-09Nov-09Jul-10Mar-11Nov-11Aug-12$1.00Year end Sept. 30 1994 1995 1996 1997 1998 1999 2000 2001 2002 2003 2004 2005 2006 2007 20082009201020112012High 2.10 1.60 1.98 2.54 4.25 3.25 3.74 3.75 5.50 5.92 7.30 7.63 7.60 7.25 6.90Low 1.05 1.10 1.37 1.70 2.45 2.35 2.70 3.00 3.48 5.20 5.48 7.00 4.35 5.30 5.00Close 1.40 1.45 1.66 2.39 3.05 3.06 3.57 3.60 5.25 5.57 7.20 7.35 5.60 6.90 5.40Trading Volume (000’s) 1,311 867 1,927 3,015 4,134 2,274 1,092 2,800 1,836 1,321 5,024 1,703 3,010 5,637 2,1386.34 6.004.75 5.155.25 5.81745 1,9966.50 5.695.20 5.045.60 5.35684 1,24530