
You also want an ePaper? Increase the reach of your titles
YUMPU automatically turns print PDFs into web optimized ePapers that Google loves.
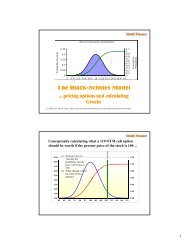
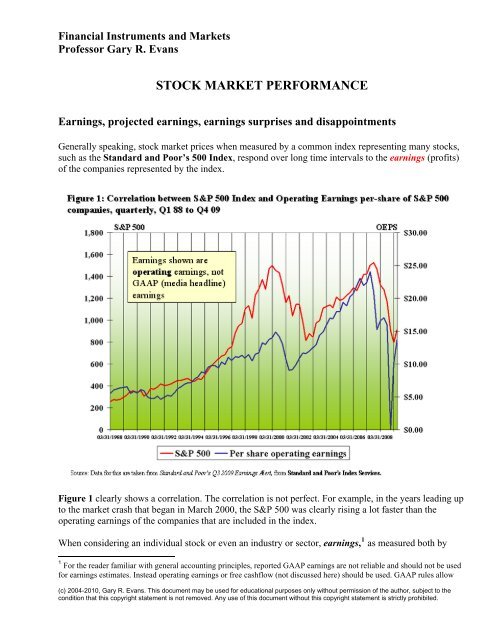
Financial Instruments and <strong>Market</strong>sProfessor Gary R. EvansSTOCK MARKET PERFORMANCEEarnings, projected earnings, earnings surprises and disappointmentsGenerally speaking, stock market prices when measured by a common index representing many stocks,such as the Standard and Poor’s 500 Index, respond over long time intervals to the earnings (profits)of the companies represented by the index.Figure 1 clearly shows a correlation. The correlation is not perfect. For example, in the years leading upto the market crash that began in March 2000, the S&P 500 was clearly rising a lot faster than theoperating earnings of the companies that are included in the index.When considering an individual stock or even an industry or sector, earnings, 1 as measured both by1 For the reader familiar with general accounting principles, reported GAAP earnings are not reliable and should not be usedfor earnings estimates. Instead operating earnings or free cashflow (not discussed here) should be used. GAAP rules allow(c) 2004-2010, Gary R. Evans. This document may be used for educational purposes only without permission of the author, subject to thecondition that this copyright statement is not removed. Any use of this document without this copyright statement is strictly prohibited.
2earnings per share or absolutely, will normally matter more than any other variable. But in today’ssophisticated markets static earnings, how much the company made in the last twelve months (shown inthe data as ttm for trailing twelve months), is only the starting point. In the eyes of many investors,earnings growth matters much more than the level of earnings. Many investors will prefer and pay apremium for a company with relatively low earnings per share but high projected growth in thoseearnings compared to a company with higher earnings per share but with lower projected earningsgrowth.For younger companies, especially in emerging industries with ill-defined markets, sometimes revenueor sales growth matters more than earnings growth. This is because investors will place a high value ona company that is increasing its relative share of the market, and especially so if it appears that thecompany in question might dominate the market. It is assumed that the profits will come later.A metric that is commonly used the compare one company or one industry to another is called the Priceto-Earningsratio (P/E).. The Price-to-Earnings ratio at any moment is the price per share of a stockdivided by its annual earnings, usually represented by its operating profit for the last year (ttm) Thisstatistic is also called the trailing P/E ratio.For example, Intel ( INTC ) on Sept. 10, 2010 had a closing price $17.99. Earnings per share (ttm)was $1.67, so P/E = 17.99/1.67 = 10.77 , which as it turns out in the weak market at that time, was alow value historically for Intel.A forward P/E ratio uses the current price divided by estimated future earnings. Current stock marketprices are more influenced by expected earnings than current earnings. If estimated (future) earningsbegin to rise because of good news, then trailing P/E will typically rise, and that is a logical reaction tothe news (up to a point).companies to register large losses that are anticipated in a single huge writedown in one quarter, which allows earnings tolook “better.”
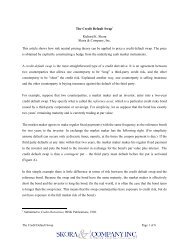
3Companies with high growth rates typically have higher trailing P/Es than slow-growing companies.As an example, in 2005, investors seemed to prefer upstart Google over stodgy Microsoft becauseGoogle was growing faster than Microsoft. At the end of the year, Google was trading at a trailing P/Eof about 75 to 1, whereas Microsoft was trading at a trailing P/E of less than 25 to 1! Figure 2 fromfinance.yahoo.com shows the relative performance of GOOG and MSFT in 2005.Although Microsoft had an earnings growth rate of 24%, the same for Google was 82%. Probably moreimportant, revenue growth at Microsoft was only 6% compared to Google’s 86%!Estimates or Projections of future earnings, but also revenue growth and cashflow made by analystsand other market experts matter a great deal when considering the prices of individual stocks or industrygroups. Theories of valuation claim that the long-range projected value of profits and/or cashflow of acorporation should strongly impact the present-day market valuation of a stock. In fact, one commontheory of valuation claims that the present price of a stock equals the discounted present value of thelifetime free cashflow of a corporation. There is certainly some truth to this theory. Companies that lookgood over a long horizon to analysts do tend to be market favorites and perform well.The problem, of course, is found in the accuracy of the projections. A very rosy scenario can be dashedby a string of bad news, and the valuation adjustment (the change in the stock price) can be very abrupt.This abrupt adjustment sometimes happens when companies either “miss” or “surprise” on theirearnings forecasts in their quarterly reports. Publicly traded companies issue earnings reports quarterly.These reports include earnings and sales results for the most recent fiscal quarter, but also include anoverview of how the company is expected to do in the near future. These overviews, some of which areadjusted mid-quarter, are referred to as guidance. Based upon this guidance and other research, stock-
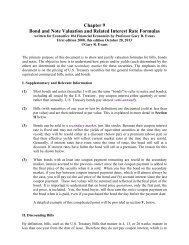
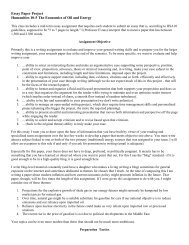
4tracking analysts form an estimate of a company’s earnings. This information is generally available tothe public. For example, on finance.yahoo.com once the user has asked for a quote for a company likeMSFT, these analyst estimates and other related information are made available under the tab AnalystsEstimates.When companies release their quarterly earnings reports, they almost always do so at the end of thebusiness day after markets are closed. If a company makes an earnings announcement that far exceedsor falls short of the consensus earnings estimates made by analysts, the stock can rise or plunge severely,by more than 10% in some cases. Further, the price may exhibit a discontinuity, where the price doesnot smoothly move from the old price to the adjusted price, but instead opens the next morning at a pricediscretely higher or lower than the old price by many dollars.For example, look at Figure 3 above that shows the effects of a Google earnings surprise released onOctober 20, 2005. As can be seen, the stock opened the next day at a price nearly $40 higher thanwhere it had closed the day before! This is an example of a discontinuity caused by an earnings surprise.On February 1, 2006, Google missed earnings estimates by about 27 cents. The result is shown in theFigure 4 below.Along the same lines, individual stocks, industry or stock groups sometimes react sharply when analystsclaim that future prospects for the industry look very bright given changes in technology or market shareor some perception that the stocks are undervalued and have been ignored. Examples from recentdecades have included mid-range computing companies, defense stocks, utilities, food processingcompanies, and especially internet stocks prior to the 2000 crash. Any industry, large or obscure, is acandidate for this phenomena. If the "fad" catches on, the stocks shoot up. Be warned, however. Theanalysts are often wrong and a few months or years later the stocks come tumbling down. A perfectexample of this was the fascination through the 1980s with mid-sized computer companies like DECand Prime Computers. The analysts saw them picking up huge market share and their stocks soared.The analysts were wrong and the stocks retreated.
6demand floor for stocks. Note the correlation between these changes in the 1990s and the phenomenalbull market of the same period.So long as this flow continues and stocks remain an attractive investment, this will be the foundation forsolid growth. However, in a panic theoretically much of this money will exit just as quickly - or evenmore quickly, than it arrived. As the graph shows, in 2000, more than $309 billion net flowed into equitymutual funds, compared to $13 million in 1990. This same figure plunged 90% to $32.3 billion in 2001,which removed the demand floor from the stock market for that entire year. That figure plunged evenmore to outflows of $27.75 billion in 2002, then fully recovered in 2003 to healthy inflows of $152.8billion, perfectly correlated with the market’s 2003 recovery.Even worse, as can be seen in the same graph, in the serious market downturn that began in late 2007and continued through 2009, there was a record outflow of funds from stock mutual funds, which greatlycontributed to the decline of the market. Given the distress in the credit markets in these years, it wouldnot be correct to say that this outflow caused the market decline. More accurately, it reflected thedecline and contributed greatly to its depth and duration.In 2009 equity funds continued to lose assets, although only slightly. But as can be seen in Figure 5,mutual funds in general had a strong positive flow. Almost all of this flow went into bond funds asinvestors remained wary of stocks and placed their investment bets on interest-bearing note and bondfunds, including U.S. Treasury Notes and Bonds, but also corporate notes and bonds. Bond fundsoffered good yields through 2009 and 2010, drawing interest away from the tepid stock market.The public can be very fickle and a loss of confidence by the investing public can slow the river to atrickle.Inflation and High Interest RatesHigh inflation will always beaccompanied by high interestrates, but there are times whenhigh interest rates are notassociated with high inflation rates(such as when the Federal ReserveSystem is using high interest ratesas the means to prevent anemerging inflation).Generally speaking, stock pricesand high inflation and/or interestrates are inversely correlated. Theygenerally move in oppositedirections. Although stockbehavior is a function of manymore variables than interest rates,generally, when interest rates fallstocks view this favorably andhave a tendency to rise, but if interest rates shoot up, especially if unexpected, stock prices usually beginto show to resistance to further increases.
7This negative correlation is made evident by looking at the performance of the Dow Jones IndustrialAverage during the most inflationary period of the United States in this century, shown Figure 6 above.As can be seen, this benchmark index did not rise on net at all over this period, which lasts more than adecade. (Dividend yields, which were around 2% annually during this period, are not represented inFigure 6.). Considering, in fact, that there was severe inflation during this period, the purchasing powerof investments in stock actually fell more than 50%.In part, this inverse reaction can be attributed to a portfolio effect, also called a portfolio shift. Theyields on interest-bearing portfolios, many of which are not very risky, begin to look very attractivecompared to much riskier stocks. This is especially true of overseas investors who may be leery ofinvesting in U.S. stocks because of exchange rate risk and their memories of recent market malfunctionsin the United States.Figure 7 shows a simple hypothetical example of a portfolio effect. Professional mutual fund and hedgefund portfolio managers, responsible for balancing risk and yield in a large investment portfolioconsisting of many securities, including a mix of stocks and bonds 2 , will often favor stocks over bonds.This is also true of sophisticated retail (individual) investors who are pro-active in managing their owninvestment accounts. These same people, however, often rebalance (change the proportion of majorclasses of investment assets) the portfolios when economic conditions change.2 For convenience, the single term “bonds” will be used to refer to all interest-bearing assets, including bonds, notes, andbills.
8Even though real returns (yields adjusted for inflation) are very low or even negative on bonds andnotes during inflationary periods, their nominal returns (the actual market yields not adjusted forinflation) are quite high, often higher than 10%. It is very difficult for stocks to maintain the same highnominal rate of return through capital gains.For example, the blue-ribbon U.S. Treasury 10-year note may look much more attractive to investorswhen it is yielding 7% than when it is yielding 4%. This would be true even if the reason for the higheryield is inflation and the inflation rate isn’t much below the new, higher yield (e.g. at 5%). This isbecause the inflation is undermining the yields on all financial assets, including stocks. One can beconfident that the yield-bearing treasury securities will at least stay ahead of the inflation. You certainlycan’t extend that certainty to stocks.This reaction could result in the sample rebalancing shown in Figure 7 – a shift away from stocks(which requires that the stocks be sold) in favor of bonds.The 2009 data for the river of money shown in Figure 5 is a very specific example of a portfolio shift infavor of bonds. This was not because of any inflationary threat. <strong>Stock</strong>s had been so hammered since2007 that investors, and especially retail investors, had lost their confidence in stocks and so wererebalancing their portfolios in favor of bonds.It is worth mentioning that there is a very specific kind of global portfolio shift that has become verycommon and sometimes substantially disturbs global equity and other markets. Sometimes the globaleconomic news is so bad that it provokes a massive, even if temporary, shift in global portfolios awayfrom stocks and other classes of bonds, like corporate bonds and the bonds of foreign governments, intoexclusively United States Treasury Securities because of their perceived safety. When this happens, thisis called a flight to quality by the financial media.Speculation and MomentumSubstantial excess speculation can push stocks up at exponential rates into ranges that economicallymake no sense. This can happen for an individual stock, an entire industry, or an entire market,including overseas markets (this discussion is by no means restricted to the U.S. market). This cyclerecurs periodically.Look at Figure 8 below. It shows a momentum ramp, a rapid acceleration of stock prices, that began inthe 1990s and contributed to the severe stock market decline that begin in March, 2000.For the stock market as a whole, such a cycle usually begins when stocks are truly undervalued,justifying a rapid rise, which begins to happen. Then heavy and immediate capital gains produces amarket euphoria where speculative investments, in part from unsophisticated investors (eveninstitutional investors) blows the market higher and higher. In the final phase of the market explosion,the only operative variable is momentum. The clear, obvious, and well-publicized profits being madeattracts more money which, results in more demand, which causes prices to accelerate. Sometimes therise is exponential in the final phase before the correction, which is sometimes a collapse.Sometimes the market is then collapsed by a "feather" - relatively insignificant news. Unfortunately, itis very hard to time the peak. No one knew that March, 2000, would be the peak for this most recentcycle prior to that date. After a year had passed, everyone knew it.
9Why rational people and professionals get caught up in this is hard to understand. This is especiallydifficult to understand when the market actually give off signals that it may be overvalued, such as in thecase of stocks, with insanely high P/E ratios for keys stocks or even entire indexes. For example, theP/E ratio for many established technology stocks was well above 100 before the 2000 collapse of themarket (and many companies had no earnings at all). That compared to an historical average of about 19for S&P 500 stocks.Again, overseas markets are also subject to excess speculation, perhaps more so than markets in theUnited States. And the phenomenon is hardly restricted to stocks. History also provides multipleexamples in real estate, precious metals, oil, and other commodities, and even tulip bulbs.Mergers and Acquisitions (Buyouts)Business combinations are common in market economies and to some extent define modern corporatehistory. Very few large-cap corporations grew to their present size by simply expanding their ownmarket. Most grew by acquiring other companies.When two companies of roughly equal stature combine to form one much large company, oftenrenamed, this is typically called a merger. In contrast, when one company, typically larger, buys anotherand absorbs the latter into the parent company where the identity of the purchased company largelydisappears, 3 this is called an acquisition or buyout.Both mergers and buyouts will always have some impact upon the stock prices of the companiesaffected. In the case of a merger, analysts will try to figure out if synergies are to be found in the merger– such as economies of scale because of the larger size, savings in costs because of the ability toeliminate redundancy in labor processes or management, the ability to combine retail outlets, the3 But not always. Sometimes the brand identity of the acquired company is of such value that the company name and otherbranding trademarks are preserved.
10elimination of competition (with each other) and so forth. If analysts can find synergies and shareholdersare convinced, then the stock price of the new merged company can rise. On the other hand, if synergiesaren’t obvious, the merged company may stall in the markets.More interesting to stock investors is the impact of buyouts. When a large company buys a smallertarget company two large obstacles emerge: (1) If the target company is publicly traded, the buyingcompany must succeed at buying a majority of the stock outstanding from the current shareholders, andtherefore must offer a price sufficiently high to do this, and (2) competitors of the buying company maynot want this to happen and so, in response, may trigger a bidding war for the stock of the targetcompany, each side pushing the offer price higher and higher.The final typical effect is to push the stock price of the target company to a very high level relative towhere it was prior to the buyout effort.An example (and this is not an unsusual example) is shown in Figure 9. After the stock market closedon Monday, September 13, 2010, tech giant HP announced that it was making an offer of $43.50 pershare to buy a security software company ArcSight (ARST). This was part of an acquisition binge byHP to expand the scope of their business by earlier buying 3Com and smartphone loser Palm.Generally, a buyout is almost always beneficial to the shareholders of the target company (there aresome historical exceptions). The impact upon the stock of the buying company is historically mixed.Often such buying sprees must be financed with debt, and it is obvious from the example given abovethat some investors may think that a company paid too much for a target company. Therefore the stock
11of the buying might initially respond by declining or simply remaining tepid for awhile. Over the longrun, when the synergies of the buyout become more obvious (if that happens), then the stock of theparent company should rise to reflect the growth.These business combinations affect the stocks involved more than the market as a whole, but when thepace mergers and acquisitions picks up in a market, stock market growth in general can benefit.DividendsAlthough the primary investment objective of buying stocks is realizing capital gains, dividends paid bystocks certainly matter. When capital gains are hard to come by because of poor market performance,investors will often shift their stock selections more in favor of dividend-paying stocks (which is anothertype of portfolio shift within the equities component of an investment portfolio).In the summer of 2010, 372 of the 500 companies in the S&P 500 index paid dividends. The dividendyield average about 2.8% for these companies in 2009. 4<strong>Stock</strong> dividends are paid quarterly. The dividend yield, also called the dividend rate at any point in timeis equal to the amount of the annual dividend in dollars divided by the price of the stock at that time.4 Standard and Poor’s Q3 2009 Earnings Alert, from Standard and Poor’s Index Services.
12For example, on September 15, 2010, Intel (INTC) was paying a dividend of $0.63 per share and thestock was trading at $18.65. Therefore the dividend yield equaled 0.63/18.65, or 3.37%.Because dividends are fixed by votes of the Board of Directors of any company paying the dividend, andare therefore “sticky,” or slow to change, it should be obvious that if the stock of a dividend-payingcompany declines sharply, then the dividend yield will rise. So long as the reason for the decline doesnot threaten a suspension of dividend payments (it often does) then suck stocks can become popularamong yield-seeking investors, potentially putting a floor on the decline.Figure 10 shows the fluctuation in dividend rates between the fourth quarter of 1988 and the thirdquarter of 1999. As can be seen, dividends slowly fell out of favor as investors opted more for capitalgains and companies kept cash to help finance growth. But with the poorly performing markets of thelast decade, dividends are once again on the rise, mostly because investors are now more inclined toseek dividends, which requires companies to pay them if they want to remain popular with investors.The large spike above 3% in late 2008 and 2009 was caused by the fact that even though stock priceswere declining sharply, many companies continued to pay their dividends for awhile, causing the yieldto rise. The rapid retraction from the spike in 2009 largely reflects the inability of companies during thatrecession to raise sufficient cash to continue to pay dividends.General Economic and Business ConditionsPeriods of stable business conditions and general high profitability, with relatively little uncertainty,seems to produce a healthy environment for stocks. Not easily quantifiable, there is sometimes almost ahealthy, stable "atmosphere" for stocks. Good investors learn to sense this after some years ofexperience.There is no strong evidence that mild recessions have any significant effect upon stocks For example,the stock market fared relatively well through the mild recession that began in July 1990 and ending inMarch 1991, and was slightly higher at the end of this period.In the recession that lasted between March 2001 and November 2001, the market as measured by allthree major indexes (the Dow Jones Industrial Averages, the Standard and Poors 500, and the NASDAQComposite) held about even, although by the beginning of that recession, all three were down sharplyfrom where they had been in late 1999. But that recession was largely caused by the collapse of manytechnology companies and provides a good example of how a large market collapse can trigger arecession.Because stock investors are so forward-looking, even prior to the beginning of a strong economicrecovery at the end of a mild recession, stocks will begin to rise. Aggressive investors and speculatorswill want to take advantage of the rally before it begins, and ironically, begin the rally!But a deep and longer recession, such as the one that began in late 2007, is another matter. Againbecause stock prices respond so strongly to expected earnings, once it becomes clear that earnings acrossthe board are going to suffer for an extended period of time, then market prices will reflect that.Consequently, the worst recession in the last 50 years contributed to the worst stock market performancesince the Great Depression.