6demand floor for stocks. Note the correlation between these changes in the 1990s and the phenomenalbull market of the same period.So long as this flow continues and stocks remain an attractive investment, this will be the foundation forsolid growth. However, in a panic theoretically much of this money will exit just as quickly - or evenmore quickly, than it arrived. As the graph shows, in 2000, more than $309 billion net flowed into equitymutual funds, compared to $13 million in 1990. This same figure plunged 90% to $32.3 billion in 2001,which removed the demand floor from the stock market for that entire year. That figure plunged evenmore to outflows of $27.75 billion in 2002, then fully recovered in 2003 to healthy inflows of $152.8billion, perfectly correlated with the market’s 2003 recovery.Even worse, as can be seen in the same graph, in the serious market downturn that began in late 2007and continued through 2009, there was a record outflow of funds from stock mutual funds, which greatlycontributed to the decline of the market. Given the distress in the credit markets in these years, it wouldnot be correct to say that this outflow caused the market decline. More accurately, it reflected thedecline and contributed greatly to its depth and duration.In 2009 equity funds continued to lose assets, although only slightly. But as can be seen in Figure 5,mutual funds in general had a strong positive flow. Almost all of this flow went into bond funds asinvestors remained wary of stocks and placed their investment bets on interest-bearing note and bondfunds, including U.S. Treasury Notes and Bonds, but also corporate notes and bonds. Bond fundsoffered good yields through 2009 and 2010, drawing interest away from the tepid stock market.The public can be very fickle and a loss of confidence by the investing public can slow the river to atrickle.Inflation and High Interest RatesHigh inflation will always beaccompanied by high interestrates, but there are times whenhigh interest rates are notassociated with high inflation rates(such as when the Federal ReserveSystem is using high interest ratesas the means to prevent anemerging inflation).Generally speaking, stock pricesand high inflation and/or interestrates are inversely correlated. Theygenerally move in oppositedirections. Although stockbehavior is a function of manymore variables than interest rates,generally, when interest rates fallstocks view this favorably andhave a tendency to rise, but if interest rates shoot up, especially if unexpected, stock prices usually beginto show to resistance to further increases.
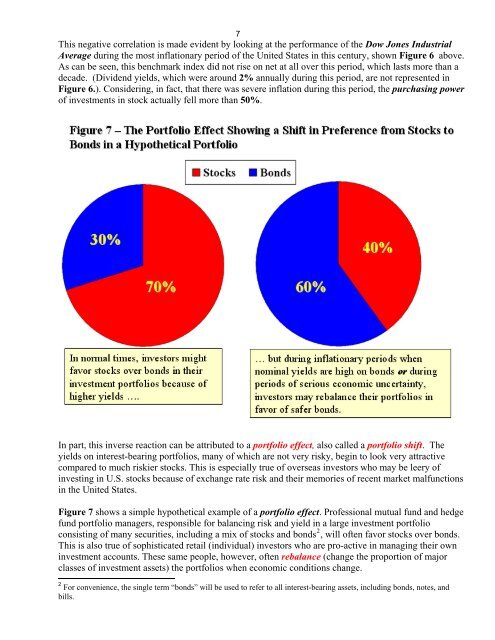
7This negative correlation is made evident by looking at the performance of the Dow Jones IndustrialAverage during the most inflationary period of the United States in this century, shown Figure 6 above.As can be seen, this benchmark index did not rise on net at all over this period, which lasts more than adecade. (Dividend yields, which were around 2% annually during this period, are not represented inFigure 6.). Considering, in fact, that there was severe inflation during this period, the purchasing powerof investments in stock actually fell more than 50%.In part, this inverse reaction can be attributed to a portfolio effect, also called a portfolio shift. Theyields on interest-bearing portfolios, many of which are not very risky, begin to look very attractivecompared to much riskier stocks. This is especially true of overseas investors who may be leery ofinvesting in U.S. stocks because of exchange rate risk and their memories of recent market malfunctionsin the United States.Figure 7 shows a simple hypothetical example of a portfolio effect. Professional mutual fund and hedgefund portfolio managers, responsible for balancing risk and yield in a large investment portfolioconsisting of many securities, including a mix of stocks and bonds 2 , will often favor stocks over bonds.This is also true of sophisticated retail (individual) investors who are pro-active in managing their owninvestment accounts. These same people, however, often rebalance (change the proportion of majorclasses of investment assets) the portfolios when economic conditions change.2 For convenience, the single term “bonds” will be used to refer to all interest-bearing assets, including bonds, notes, andbills.