Raven's Advanced Progressive Matrices – Short (APM ... - TalentLens
Raven's Advanced Progressive Matrices – Short (APM ... - TalentLens
Raven's Advanced Progressive Matrices – Short (APM ... - TalentLens

You also want an ePaper? Increase the reach of your titles
YUMPU automatically turns print PDFs into web optimized ePapers that Google loves.
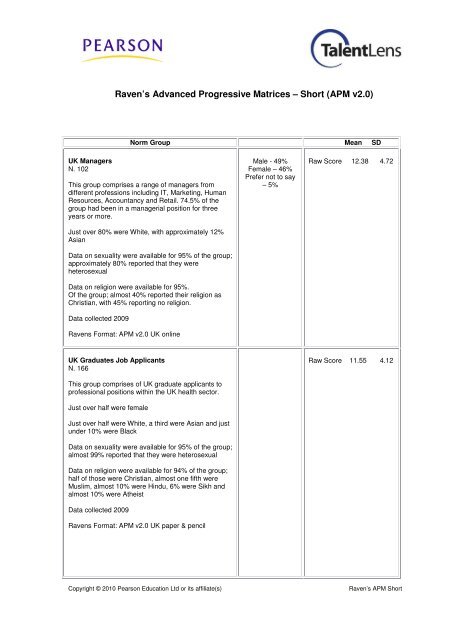
Raven’s <strong>Advanced</strong> <strong>Progressive</strong> <strong>Matrices</strong> – <strong>Short</strong> (<strong>APM</strong> v2.0)Norm Group Mean SDUK ManagersN. 102This group comprises a range of managers fromdifferent professions including IT, Marketing, HumanResources, Accountancy and Retail. 74.5% of thegroup had been in a managerial position for threeyears or more.Just over 80% were White, with approximately 12%AsianData on sexuality were available for 95% of the group;approximately 80% reported that they wereheterosexualData on religion were available for 95%.Of the group; almost 40% reported their religion asChristian, with 45% reporting no religion.Data collected 2009Ravens Format: <strong>APM</strong> v2.0 UK onlineMale - 49%Female – 46%Prefer not to say– 5%Raw Score 12.38 4.72UK Graduates Job ApplicantsN. 166This group comprises of UK graduate applicants toprofessional positions within the UK health sector.Just over half were femaleJust over half were White, a third were Asian and justunder 10% were BlackData on sexuality were available for 95% of the group;almost 99% reported that they were heterosexualData on religion were available for 94% of the group;half of those were Christian, almost one fifth wereMuslim, almost 10% were Hindu, 6% were Sikh andalmost 10% were AtheistData collected 2009Ravens Format: <strong>APM</strong> v2.0 UK paper & pencilRaw Score 11.55 4.12Copyright © 2010 Pearson Education Ltd or its affiliate(s)Raven’s <strong>APM</strong> <strong>Short</strong>
US Collected Global Executives, Directors, andManagersN. 175This group is based on <strong>APM</strong> data collected via onlineadministration of the assessment during 2008.Education - 4% Some College, 37% Bachelor Degree,39% Master’s Degree, 3% Doctorate,17% No AnswerIndustry - 30% Manufacturing & Production, 23%Financial Services, Banking, & Insurance, 10%Pharmaceuticals and Biotechnology, 6% Retail &Wholesale, 2% IT& Telecommunications, 28% OtherMale – 61%Female – 22%Prefer not to say– 17%70% - White7% - Asian4% - Hispanic3% - Black1% - Multiracial18% - Prefer notto sayRaw Score 12.2 4.1US Individual ContributorN. 199The norm group data were collected from recent(2008) customer online test administrations.All test takers self-identified as IndividualContributors, from various occupations, includingFinancial Analysts, IT Professionals, EducationProfessionals, Engineers, Marketing Professionals,Sales, and Human Resources.Education - 1% Some College, 43% Bachelor Degree,51% Master’s Degree, 5% DoctorateIndustry - 41% Financial Services, Banking,Insurance, 9% Education, 9% IT &Telecommunications, 8% Professional, BusinessServices, 7% Manufacturing & Production, 26% OtherMale - 66%Female - 33.5%Prefer not to say -0.5%47% - White33% - Asian4%-Hispanic10% - Black4% - Other2% - Prefer not tosayRaw Score 13.06 4.31Copyright © 2010 Pearson Education Ltd or its affiliate(s)Raven’s <strong>APM</strong> <strong>Short</strong>