Food Chemistry - ESA
Food Chemistry - ESA
Food Chemistry - ESA

Create successful ePaper yourself
Turn your PDF publications into a flip-book with our unique Google optimized e-Paper software.
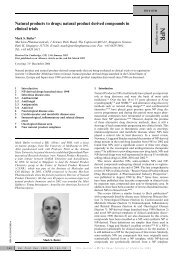
Antioxidant activity of Agaricus sp. mushrooms by chemical, biochemical<br />
and electrochemical assays<br />
Lillian Barros a , Soraia Falcão a,b , Paula Baptista a , Cristina Freire b , Miguel Vilas-Boas a , Isabel C.F.R. Ferreira a, *<br />
a CIMO – Escola Superior Agrária, Instituto Politécnico de Bragancßa, Campus de Sta. Apolónia, Apartado 1172, 5301-855 Bragancßa, Portugal<br />
b REQUIMTE/Departamento de Química, Faculdade de Ciências, Universidade do Porto, Rua do Campo Alegre, 4169-007 Porto, Portugal<br />
article info<br />
Article history:<br />
Received 6 November 2007<br />
Received in revised form 6 January 2008<br />
Accepted 11 March 2008<br />
Keywords:<br />
Agaricus sp. mushrooms<br />
Electrochemical assays<br />
Lipid peroxidation inhibition<br />
1. Introduction<br />
abstract<br />
Living cells, including those of man, animals, and plants, are<br />
continuously exposed to a variety of challenges that exert oxidative<br />
stress. Oxidative stress arises in a biological system after an increased<br />
exposure to oxidants, a decrease in the antioxidant<br />
capacity of the system, or both. It is often associated with or leads<br />
to the generation of reactive oxygen species (ROS), including free<br />
radicals, which are strongly implicated in the pathophysiology of<br />
diseases, such as cancer, rheumatoid arthritis, cirrhosis and arteriosclerosis<br />
as well as in degenerative processes associated with<br />
ageing. Reactive free radicals may come from endogenous sources<br />
through normal physiological and metabolic processes such as<br />
mitochondrial respiration. Alternatively, they could result from<br />
exogenous sources such as exposure to pollutants and ionizing<br />
irradiation, and particularly oxygen derived radicals are capable<br />
of oxidizing biomolecules, resulting in cell death and tissue damage<br />
(Ames, Shigenaga, & Hagen, 1993; Chevion, Roberts, & Chevion,<br />
2000; Halliwell & Gutteridge, 2003). Oxidation is also one of the<br />
most important processes of food deterioration since it may affect<br />
food safety, colour, flavour and texture.<br />
Cells are equipped with several defence systems against free<br />
radical damage, including oxidative enzymes such as superoxide<br />
dismutase (SOD) and catalase (CAT), or chemical compounds such<br />
as a-tocopherol, ascorbic acid, carotenoids, polyphenol compounds<br />
and glutathione (Niki, Shimaski, & Mino, 1994). However, antioxi-<br />
* Corresponding author. Tel.: +351 273303219; fax: +351 273325405.<br />
E-mail address: iferreira@ipb.pt (I.C.F.R. Ferreira).<br />
0308-8146/$ - see front matter Ó 2008 Elsevier Ltd. All rights reserved.<br />
doi:10.1016/j.foodchem.2008.03.033<br />
<strong>Food</strong> <strong>Chemistry</strong> 111 (2008) 61–66<br />
Contents lists available at ScienceDirect<br />
<strong>Food</strong> <strong>Chemistry</strong><br />
journal homepage: www.elsevier.com/locate/foodchem<br />
The antioxidant activity of five Agaricus sp. mushrooms was screened through chemical, biochemical and<br />
electrochemical techniques. The chemical assays allowed an evaluation of their reducing power and radical<br />
scavenging activity, while biochemical assays evaluated the lipid peroxidation inhibition capacity,<br />
using erythrocytes and brain cells as models; the electrochemical characterization of the mushrooms<br />
extracts were performed by cyclic voltammetry and differential pulse voltammetry. All the species<br />
proved to have antioxidant activity and particularly, by the electrochemical techniques, it has been<br />
shown that mushroom extracts revealed similar electrochemical responses, suggesting similar electroactive<br />
chemical composition, and oxidation potentials more positive than those of the standards (ascorbic<br />
and gallic acids). Agaricus silvaticus was the most efficient species presenting the lowest EC50 values in the<br />
chemical and biochemical assays, and the highest ‘‘antioxidant power” in the electrochemical assays.<br />
Ó 2008 Elsevier Ltd. All rights reserved.<br />
dant supplements or antioxidant-containing foods may be used to<br />
help the human body to reduce oxidative damage or to protect<br />
food quality by preventing oxidative deterioration (Elmastasa, Isildaka,<br />
Turkekulb, & Temura, 2007; Halliwell & Gutteridge, 2003). In<br />
recent years, the restriction in the use of synthetic antioxidants,<br />
such as BHA (2-tert-butyl-4-methoxyphenol) and BHT (2,6-ditert-butyl-4-methylphenol),<br />
has caused an increased interest towards<br />
natural antioxidant substances (Ames, 1983; Branen,<br />
1975). Natural antioxidants are being extensively studied for their<br />
capacity to protect organisms and cells from damage brought on by<br />
oxidative stress, the latter being considered a cause of ageing and<br />
degenerative diseases. The antioxidants contained in foods, especially<br />
vegetables, are phenolic compounds (phenolic acids and<br />
flavonoids), carotenoids, tocopherol and ascorbic acid (Cazzi<br />
et al., 1997; Elmastasa et al., 2007) that are important protective<br />
agents for human health (Block, Patterson, & Subar, 1992; Gillman<br />
et al., 1995).<br />
Mushrooms are rich sources of those compounds (Barros, Ferreira,<br />
Queirós, Ferreira, & Baptista, 2007; Barros & Calhelha et al.,<br />
2007; Valentão & Andrade et al., 2005; Valentão & Lopes et al.,<br />
2005) and in the last years we have reported several protocols to<br />
determine their antioxidant activity based on spectrophotometric<br />
techniques (Barros, Baptista, Correia, Morais, & Ferreira, 2007; Barros,<br />
Baptista, & Ferreira, 2007; Ferreira, Baptista, Vilas-Boas, & Barros,<br />
2007). Progressively, electrochemical techniques have been<br />
tested and developed as an alternative tool, for the evaluation of<br />
different food extracts, expressed in terms of ‘‘antioxidant power”,<br />
due to their quickness, simplicity and low cost (Blasco, González, &<br />
Escarpa, 2004; Blasco, Rogerio, González, & Escarpa, 2005; Chevion,
62 L. Barros et al. / <strong>Food</strong> <strong>Chemistry</strong> 111 (2008) 61–66<br />
et al., 2000; Cosio, Buratti, Mannino, & Benedetti, 2006; Korotkova,<br />
Karbainov, & Shevchuk, 2002).<br />
Antioxidant compounds can act as reduction agents and, in<br />
solutions, they tend to be easily oxidised at inert electrodes. Based<br />
on this fact, some of the previous cited authors established an<br />
interesting relationship between electrochemical behaviour of<br />
the antioxidant compounds and their resultant ‘‘antioxidant<br />
power”, where ‘‘low oxidation potential” corresponds to ‘‘high<br />
antioxidant power”. On the other hand, ascorbic acid and phenols<br />
compounds are common antioxidants in mushrooms. Electrochemical<br />
measurement at positive potentials will then correspond<br />
to the oxidation of ‘‘total phenolic” and ascorbic acid, plus all compounds<br />
with natural antioxidant properties and electrochemical<br />
activity, which are present in foods. Blasco et al. defined an ‘‘Electrochemical<br />
Index” to express the evaluation of the ‘‘total natural<br />
antioxidants (Blasco et al., 2004).<br />
In the present work, cyclic voltammetry and differential pulse<br />
voltammetry were used to evaluate Agaricus sp. mushrooms antioxidant<br />
activity. Moreover, the lipid peroxidation inhibition capacity<br />
of the edible mushrooms was accessed by biochemical assays<br />
used as models for the lipid peroxidation damage in biomembranes,<br />
namely inhibition of b-carotene bleaching in the presence<br />
of linoleic acid radicals, inhibition of erythrocytes hemolysis mediated<br />
by peroxyl radicals, and inhibition of thiobarbituric acid reactive<br />
substances (TBARS) formation in brain cells. Their antioxidant<br />
properties were also evaluated through the reducing power determination<br />
and radical scavenging activity of 2,2-diphenyl-1-picrylhydrazyl<br />
(DPPH) radicals. Bioactive compounds such as<br />
phenols, flavonoids, ascorbic acid, b-carotene and lycopene were<br />
also determined.<br />
2. Materials and methods<br />
2.1. Samples<br />
Five mushrooms species: Agaricus bisporus (Lange) Imbach,<br />
Agaricus arvensis Schaeffer, Agaricus romagnesii Wasser, Agaricus<br />
sivaticus Schaeff., and Agaricus silvicola (Vittadini) Peck were<br />
analysed. The first was a commercial sample obtained in a local<br />
supermarket. All the others were wild species and were collected<br />
in Bragancßa (Northeast of Portugal), in autumn 2006, under<br />
live pine trees (Pinus sp.) for the first two species and<br />
under oak trees (Quercus pyrenaica Willd.) for the last species.<br />
Taxonomic identification was made according to several authors<br />
(Courtecuisse & Duhem, 1995; Moser, 1983) and representative<br />
voucher specimens were deposited at the herbarium of Escola<br />
Superior Agrária of Instituto Politécnico de Bragancßa. After collection<br />
and taxonomic identification, all the mushrooms were<br />
dried in a freeze-drier (Ly-8-FM-ULE, Snijders, HOLLAND) before<br />
analysis.<br />
2.2. Sample preparation<br />
The samples (typically 3 g) were extracted by stirring with<br />
100 ml of methanol at 25 °C at 150 rpm for 24 h and filtered<br />
through Whatman No. 4 paper. The residue was then extracted<br />
with two additional 100 ml portions of methanol. The combined<br />
methanolic extracts were evaporated at 40 °C to dryness and redissolved<br />
in methanol at a concentration of 100 mg/ml, and stored at<br />
4 °C for further use.<br />
2.3. Standards and reagents<br />
Standards BHA (2-tert-butyl-4-methoxyphenol), TBHQ (tertbutylhydroquinone),<br />
L-ascorbic acid, a-tocopherol, gallic acid and<br />
(+)-catechin were purchased from Sigma (St. Louis, MO, USA).<br />
2,2-diphenyl-1-picrylhydrazyl (DPPH) was obtained from Alfa Aesar<br />
(Ward Hill, MA, USA). Sodium perchlorate monohydrate, puriss<br />
grade, was purchased from Fluka, and kept at 30 °C before use. All<br />
other chemicals were obtained from Sigma Chemical Co. (St. Louis,<br />
MO, USA). Methanol was obtained from Pronalab (Lisbon, Portugal).<br />
Water was treated in a Mili-Q water purification system<br />
(TGI Pure Water Systems, USA).<br />
2.4. Chemical assays<br />
2.4.1. Determination of bioactive components<br />
Bioactive compounds in the mushrooms extracts were determined<br />
by colorimetric assays, based on procedures described by<br />
us in previous works (Barros & Baptista et al., 2007; Barros & Ferreira<br />
et al., 2007).<br />
For phenolic compounds estimation, the extract solution (1 ml)<br />
was mixed with of Folin and Ciocalteu’s phenol reagent (1 ml).<br />
After 3 min, saturated sodium carbonate solution (1 ml) was added<br />
to the mixture and adjusted to 10 ml with distilled water. The reaction<br />
was kept in the dark for 90 min, after which the absorbance<br />
was read at k = 725 nm (Analytikijena 200-2004 spectrophotometer).<br />
Gallic acid was used to calculate the standard curve (0.01-<br />
0.4 mM; Y = 2.8557X-0.0021; R 2 = 0.9999) and the results were<br />
expressed as mg of gallic acid equivalents (GAEs) per g of extract.<br />
For flavonoid contents determination, the mushroom extract<br />
(250 ll) was mixed with distilled water (1.25 ml) and NaNO 2 solution<br />
(5%, 75 ll). After 5 min, AlCl3 H2O solution (10%, 150 ll) was<br />
added. After 6 min, NaOH (1 M, 500 ll) and distilled water (275 ll)<br />
were added to the mixture. The solution was mixed well and the<br />
intensity of pink colour was measured at k = 510 nm. (+)-catechin<br />
was used to calculate the standard curve (0.022–0.34 mM;<br />
Y = 0.9629X 0.0002; R 2 = 0.9999) and the results were expressed<br />
as mg of (+)-catechin equivalents (CEs) per g of extract.<br />
For ascorbic acid determination, the dried methanolic extract<br />
(100 mg) was re-extracted with metaphosphoric acid (1%, 10 ml)<br />
for 45 min at room temperature and filtered through Whatman<br />
No. 4 filter paper. The filtrate (1 ml) was mixed with 2,6-dichlorophenolindophenol<br />
(9 ml) and the absorbance was measured within<br />
30 min at 515 nm against a blank. Content of ascorbic acid was calculated<br />
on the basis of the calibration curve of authentic L-ascorbic<br />
acid (0.020–0.12 mg/ml; Y = 3.4127X 0.0072; R 2 = 0.9905) and<br />
the results were expressed as mg of ascorbic acid/g of extract.<br />
For b-carotene and lycopene determination, the dried methanolic<br />
extract (100 mg) was vigorously shaken with acetone–hexane<br />
mixture (4:6, 10 ml) for 1 min and filtered through Whatman No.<br />
4 filter paper. The absorbance of the filtrate was measured at<br />
k = 453, 505 and 663 nm. Contents of b-carotene and lycopene<br />
were calculated according to the following equations: lycopene<br />
(mg/100 ml) = 0.0458 A663 + 0.372 A505 0.0806 A453; b-carotene<br />
(mg/100 ml) = 0.216 A663 0.304 A505 + 0.452 A453. The results<br />
were expressed as lg of carotenoid/g of extract.<br />
2.4.2. DPPH radical scavenging activity<br />
Various concentrations of mushroom extracts (0.3 ml) were<br />
mixed with methanolic solution containing DPPH radicals<br />
(6 10 5 mM, 2.7 ml). The mixture was shaken vigorously and left<br />
to stand for 60 min in the dark (until stable absorption values were<br />
obtained). The reduction of the DPPH radical was determined by<br />
measuring the absorption at k = 517 nm. The radical scavenging<br />
activity (RSA) was calculated as a percentage of DPPH discolouration<br />
using the equation: % RSA = [(A DPPH A S)/A DPPH] 100,<br />
where AS is the absorbance of the solution when the sample extract<br />
has been added at a particular level, and A DPPH is the absorbance of<br />
the DPPH solution. The extract concentration providing 50% of radicals<br />
scavenging activity (EC 50) was calculated from the graph of
RSA percentage against extract concentration. BHA and a-tocopherol<br />
were used as standards (Barros & Baptista et al., 2007; Barros<br />
& Ferreira et al., 2007).<br />
2.4.3. Reducing power<br />
Various concentrations of mushroom methanolic extracts<br />
(2.5 ml) were mixed with sodium phosphate buffer (pH 6.6,<br />
200 mM, 2.5 ml) and potassium ferricyanide (1% w/v, 2.5 ml). The<br />
mixture was incubated at 50 °C for 20 min. Trichloroacetic acid<br />
(10%, 2.5 ml) was added, and the mixture was centrifuged at<br />
1000 rpm for 8 min (Centorion K24OR-2003 refrigerated centrifuge).<br />
The upper layer (5 ml) was mixed with deionised water<br />
(5 ml) and ferric chloride (0.1%, 1 ml), and the absorbance was<br />
measured spectrophotometrically at 700 nm. The extract concentration<br />
providing 0.5 of absorbance (EC50) was calculated from<br />
the graph of absorbance at k = 700 nm against extract concentration.<br />
BHA and a-tocopherol were used as standards (Barros & Baptista<br />
et al., 2007; Barros & Ferreira et al., 2007).<br />
2.5. Biochemical assays<br />
2.5.1. Inhibition of b-carotene bleaching<br />
The antioxidant activity of mushroom extracts was evaluated<br />
by the b-carotene linoleate model system. A solution of b-carotene<br />
was prepared by dissolving b-carotene (2 mg) in chloroform<br />
(10 ml). Two millilitres of this solution were pipetted into a<br />
100 ml round-bottom flask. After the chloroform was removed<br />
at 40 °C under vacuum, linoleic acid (40 mg), Tween 80 emulsifier<br />
(400 mg), and distilled water (100 ml) were added to the flask<br />
with vigorous shaking. Aliquots (4.8 ml) of this emulsion were<br />
transferred into different test tubes containing different concentrations<br />
of the mushroom extracts (0.2 ml). The tubes were shaken<br />
and incubated at 50 °C in a water bath. As soon as the emulsion<br />
was added to each tube, the zero time absorbance was measured<br />
at k = 470 nm using a spectrophotometer. Absorbance readings<br />
were then recorded at 20-min intervals until the control sample<br />
had changed colour. A blank, devoid of b-carotene, was prepared<br />
for background subtraction. Lipid peroxidation (LPO) inhibition<br />
was calculated using the following equation: LPO inhibition = (bcarotene<br />
content after 2 h of assay/initial b-carotene content)<br />
100. The extract concentration providing 50% antioxidant<br />
activity (EC50) was calculated from the graph of antioxidant activity<br />
percentage against extract concentration. TBHQ was used as<br />
standard (Barros & Baptista et al., 2007; Barros & Ferreira et al.,<br />
2007).<br />
2.5.2. Inhibition of erythrocyte hemolysis mediated by peroxyl free<br />
radicals<br />
The antioxidant activity of the mushroom extracts was measured<br />
as the inhibition of erythrocyte hemolysis. Blood was obtained<br />
from a male ram (churra galega transmontana) of body<br />
weight 67 kg. Erythrocytes separated from the plasma and the<br />
buffy coat were washed three times with phosphate buffer saline<br />
(PBS, 10 mM, 10 ml) at pH 7.4 (prepared by mixing 10 mM of<br />
NaH2PO4 and Na2HPO4, and 125 mM of NaCl in 1 l of distilled<br />
water) and centrifuged at 1500g for 5 min. During the last washing,<br />
the erythrocytes were obtained by centrifugation at 1500g<br />
for 10 min. A suspension of erythrocytes in PBS (20%, 0.1 ml)<br />
was added to 2,2 0 -azobis(2-amidinopropane)dihydrochloride<br />
(AAPH, 200 mM, 0.2 ml) solution (in PBS) and mushroom methanolic<br />
extracts of different concentrations (0.1 ml). The reaction<br />
mixture was shaken gently (30 rpm) while being incubated at<br />
37 °C for 3 h. The reaction mixture was diluted with PBS (8 ml)<br />
and centrifuged at 3000g for 10 min; the absorbance of its supernatant<br />
was then read at k = 540 nm by a spectrophotometer, after<br />
filtration with a syringe filter (cellulose membrane 30 mm,<br />
L. Barros et al. / <strong>Food</strong> <strong>Chemistry</strong> 111 (2008) 61–66 63<br />
0.20 lm, Titan). The percentage hemolysis inhibition was calculated<br />
by the equation% hemolysis inhibition = [(A AAPH A S)/<br />
AAAPH] 100, where AS is the absorbance of the sample containing<br />
the mushroom extract, and A AAPH is the absorbance of the control<br />
sample containing no mushroom extract. The extract concentration<br />
providing 50% inhibition (EC 50) was calculated from the graph<br />
of hemolysis inhibition percentage against extract concentration.<br />
L-Ascorbic acid was used as standard (Barros & Baptista et al.,<br />
2007; Barros & Ferreira et al., 2007).<br />
2.5.3. Inhibition of lipid peroxidation using thiobarbituric acid<br />
reactive substances (TBARS)<br />
Brains were obtained from pig (Sus scrofa) of body weight 150<br />
kg, dissected and homogenized with a Polytron in ice-cold Tris–HCl<br />
buffer (pH 7.4, 20 mM) to produce a 1:2 (w/v) brain tissue homogenate<br />
which was centrifuged at 3000g for 10 min. An aliquot<br />
(0.1 ml) of the supernatant was incubated with the mushrooms extracts<br />
(0.2 ml) in the presence of FeSO4 (10 lM; 0.1 ml) and ascorbic<br />
acid (0.1 mM; 0.1 ml) at 37 °C for 1 h. The reaction was stopped<br />
by the addition of trichloroacetic acid (28% w/v, 0.5 ml), followed<br />
by thiobarbituric acid (TBA, 2%, 0.38 ml), and the mixture was then<br />
heated at 80 °C for 20 min. After centrifugation at 3000g for 10 min<br />
to remove the precipitated protein, the colour intensity of the malondialdehyde<br />
(MDA)–TBA complex in the supernatant was measured<br />
by its absorbance at k = 532 nm. The inhibition ratio (%)<br />
was calculated using the following formula: Inhibition ratio<br />
(%) = [(A B)/A] 100%, where A and B were the absorbance of<br />
the control and the compound solution, respectively. The extract<br />
concentration providing 50% lipid peroxidation inhibition (EC 50)<br />
was calculated from the graph of antioxidant activity percentage<br />
against extract concentration. BHA was used as standard (Barros<br />
& Baptista et al., 2007; Barros & Ferreira et al., 2007).<br />
2.6. Electrochemical characterization<br />
2.6.1. Instrumentation<br />
Cyclic voltammetry (CV) and differential pulse voltammetry<br />
(DPV) measurements were performed on an Autolab PGSTAT 302<br />
potentiostat/galvanostat using a closed standard three electrode<br />
cell. A glassy carbon (BAS, / = 0.314 cm 2 ) was used as the working<br />
electrode and a Pt foil as the counter electrode. All potentials are<br />
refer to an Ag/AgCl 3 M KCl reference electrode (Methrom). Prior<br />
to use, the working electrode was polished in an aqueous suspension<br />
of 0.3 lm alumina (Beuhler) on a Master-Tex (Beuhler) polishing<br />
pad, then rinsed with water. Subsequently, in a chemical<br />
treatment, the electrode was sonicated in 6 M HCl for 1 min, and<br />
then in methanol. This cleaning procedure was applied always before<br />
any electrochemical measurements.<br />
2.6.2. Procedure<br />
All the mushroom extracts and standard compounds were studied<br />
in methanol/acetate buffer 0.1 M (pH 4)/NaClO4 (70:28:2) solutions.<br />
For calibration standards (ascorbic and gallic acids), the<br />
concentration was set between 0.1 and 1 mM, while for mushroom<br />
extracts solutions the concentration was changed between 0.5 and<br />
15 mg/ml. All solutions were analysed immediately after preparation<br />
and the electrochemical responses recorded after the glassy<br />
carbon electrode immersion, to minimize adsorption of species<br />
onto the electrode surface prior to the run.<br />
Cyclic voltammetry was used to characterization the electrochemical<br />
responses between 0 and 1.2 V, at 0.1 V s 1 , whereas<br />
the antioxidant power was evaluated by DPV, using the following<br />
operating conditions for DPV were set at 60 mV pulse amplitude<br />
and 0.030 V s 1 as scan rate. For each extract, the current density<br />
was plotted as a function of mushroom extract mass and compared<br />
with those of the standards.
64 L. Barros et al. / <strong>Food</strong> <strong>Chemistry</strong> 111 (2008) 61–66<br />
2.7. Statistical analysis<br />
For each one of the Agaricus sp. three samples were analysed<br />
and also all the assays were carried out in triplicate. The results<br />
are expressed as mean values and standard error (SE) or standard<br />
deviation (SD). The mushrooms antioxidant activity was analysed<br />
using one-way analysis of variance (ANOVA) followed by Tukey’s<br />
HSD Test with a = 0.05. This treatment was carried out using SAS<br />
v. 9.1.3 program.<br />
3. Results and discussion<br />
3.1. Evaluation of antioxidant properties by chemical and biochemical<br />
assays<br />
Several chemical and biochemical assays were used to screen<br />
the antioxidant properties: reducing power (measuring the conversion<br />
of a Fe 3+ /ferricyanide complex to the ferrous form), scavenging<br />
activity on DPPH radicals (measuring the decrease in<br />
DPPH radical absorption after exposure to radical scavengers),<br />
inhibition of b-carotene bleaching (by neutralizing the linoleatefree<br />
radical and other free radicals formed in the system which attack<br />
the highly unsaturated b-carotene models), and inhibition of<br />
lipid peroxidation in brain tissue (measured by the colour intensity<br />
of MDA–TBA complex). The assays were performed in the whole<br />
extract, since it could be more beneficial than isolated constituents;<br />
a bioactive individual component can change its properties<br />
in the presence of other compounds present in the extracts.<br />
According to Liu (2003), additive and synergistic effects of phytochemicals<br />
in fruits and vegetables are responsible for their potent<br />
bioactive properties and the benefit of a diet rich in fruits and vegetables<br />
is attributed to the complex mixture of phytochemicals<br />
present in whole foods. This explains why no single antioxidant<br />
can replace the combination of natural phytochemicals to achieve<br />
health benefits.<br />
Table 1 shows EC50 values obtained in the antioxidant activity<br />
assays of Agaricus sp. mushrooms. All the species proved to have<br />
antioxidant activity, namely radical scavenging activity and lipid<br />
peroxidation inhibition capacity. The antioxidant activity was better<br />
(lower EC50 values) in chemical assays than in the biochemical<br />
assay using animal cells.<br />
Table 2 presents phenol, flavonoid, ascorbic acid and carotenoids<br />
concentrations contained in the five Agaricus sp. mushroom<br />
extracts. Phenols were the major antioxidant components found<br />
in the extracts, followed by flavonoids (3.88–1.65 mg/g). Ascorbic<br />
acid was found in small amounts (0.02–0.04 mg/g), and b-carotene<br />
and lycopene were only found in vestigial amounts (50a<br />
A. bisporus 9.61 ± 0.07b 3.63 ± 0.02b 21.39 ± 0.45b >50a 46.82 ± 0.03b<br />
A. romagnesii 6.22 ± 0.10c 2.23 ± 0.01d 4.36 ± 0.86d 35.38 ± 0.9c 22.38 ± 0.05d<br />
A. silvaticus 5.37 ± 0.06d 2.08 ± 0.05e 3.72 ± 0.21d 22.15 ± 0.31d 17.79 ± 0.10e<br />
A. silvicola 6.39 ± 0.16c 3.24 ± 0.01c 14.75 ± 1.57c 43.75 ± 0.11b 31.97 ± 0.04c<br />
Sample Total phenols (mg/g) Flavonoids (mg/g) Ascorbic acid (mg/g) b-Carotene (lg/g) Lycopene (lg/g)<br />
A. arvensis 2.72 ± 0.17d 1.65 ± 0.09d 0.02 ± 0.00c 8.52 ± 0.38a 4.70 ± 0.25a<br />
A. bisporus 4.49 ± 0.16c 1.73 ± 0.11d 0.03 ± 0.01b 1.95 ± 0.10d 0.91 ± 0.06d<br />
A. romagnesii 6.18 ± 0.44b 2.87 ± 0.12c 0.04 ± 0.00a 1.32 ± 0.03e 0.38 ± 0.02e<br />
A. silvaticus 8.95 ± 0.30a 3.88 ± 0.04a 0.04 ± 0.00a 5.42 ± 0.10b 2.63 ± 0.06b<br />
A. silvicola 6.40 ± 0.17b 3.40 ± 0.01b 0.04 ± 0.00a 3.02 ± 0.12c 1.14 ± 0.08c
j / μAcm -2<br />
j / μAcm -2<br />
j / μAcm -2<br />
50<br />
40<br />
30<br />
20<br />
10<br />
0<br />
50<br />
40<br />
30<br />
20<br />
10<br />
0<br />
50<br />
40<br />
30<br />
20<br />
10<br />
0<br />
0.0 0.2 0.4 0.6<br />
0.0 0.2 0.4 0.6 0.8 1.0<br />
(c)<br />
0.0 0.2 0.4 0.6 0.8 1.0 1.2<br />
E / V<br />
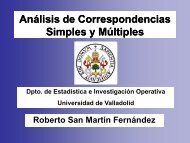
Fig. 1. Cyclic voltamogram, at 0.1 V s 1 , of methanol/acetate buffer 0.1 M (pH 4)/<br />
NaClO 4 (70:28:2) solutions of: (a) 0.5 mM ascorbic acid, (b) 0.5 mM gallic acid, (c)<br />
5 mg/ml extract of A. silvaticus.<br />
Table 3<br />
Electrochemical results from cyclic voltammetry and differential pulse voltammetry<br />
of the methanolic mushroom extracts<br />
Sample E 1/2/V Slope/lAcm 2<br />
mg 1 ml<br />
A.P. (AA)<br />
mg/g<br />
Cyclic voltammetry is frequently used for the characterization<br />
of electroactive systems. However, when organic substances are<br />
present, there are greater chances for adsorption phenomena on<br />
the electrode surface, limiting the use of this technique to quantitative<br />
measurements. To overcome this constriction and gain<br />
quantitative information in the antioxidant capabilities of the extracts,<br />
differential pulse voltammetry was used. In this technique<br />
the current is measured before and after the potential pulse application<br />
allowing the discrimination of effects, like absorption on the<br />
electrode, that are approximately constants in a certain potential<br />
interval (Brett & Brett, 1993).<br />
Fig. 2 shows the differential pulse voltamograms for the mushroom<br />
extracts. They resemble the behaviour of the cyclic voltamogram<br />
responses, with one peak at the same potential values. The<br />
exception is A. bisporus extract where it is possible to observe a<br />
broad peak around 0.6 V. In fact, with this technique the peaks<br />
are better resolved than in CV, overcoming the difficulties in<br />
accessing a correct baseline.<br />
The differential pulse voltamograms, at several concentrations<br />
of gallic acid, are shown in Fig. 3. As can be seen there is an increase<br />
in peak current with the increase in gallic acid concentration,<br />
(a)<br />
(b)<br />
A.P. (GA)<br />
mg/g<br />
A. arvensis 0.90 0.55 3.1 2.7<br />
A. bisporus 0.92 0.79 1.9 1.6<br />
A. romagnesii 0.92 0.50 2.8 2.4<br />
A. silvaticus 0.92 0.85 4.4 3.7<br />
A. silvicola 0.94 0.85 4.6 4.0<br />
Ascorbic acid 0.26 204.75 1000 616<br />
Gallic acid 0.36/0.62 247.81 1302 1000<br />
A.P. – antioxidant power; AA – ascorbic acid; GA – gallic acid.<br />
L. Barros et al. / <strong>Food</strong> <strong>Chemistry</strong> 111 (2008) 61–66 65<br />
j / μAcm -2<br />
30<br />
25<br />
20<br />
15<br />
10<br />
5<br />
0<br />
0.0 0.2 0.4 0.6<br />
E / V<br />
0.8 1.0 1.2<br />
which leads to a linear relation between the two parameters. The<br />
same behaviour was found for ascorbic acid and mushroom extracts<br />
(Fig. 4 and Table 3) although the slopes for the plots peak<br />
current density vs. extract concentration are very different. For this<br />
technique the peak current density, j, depends, not only on the<br />
concentration, but also on the electron transfer kinetics and the<br />
diffusion coefficient of the electroactive species (or the average of<br />
several species) (Brett & Brett, 1993), preventing the direct<br />
comparison between the standards and samples data. Moreover,<br />
the standards tested were not detected within the mushrooms<br />
extracts, at an electrochemically detectable concentration, and<br />
(b)<br />
(a)<br />
(b)<br />
(c)<br />
(d)<br />
(e)<br />
Fig. 2. Differential pulse voltamogram of 10 mg/ml Agaricus methanolic extracts in<br />
methanol/acetate buffer 0.1 M (pH 4)/NaClO 4 (70:28:2) solutions. (a) A. silvicola, (b)<br />
A. bisporus, (c) A. silvaticus, (d) A. arvensis, and (e) A. romagnesii.<br />
j / μAcm -2<br />
j / μAcm -2<br />
60<br />
50<br />
40<br />
30<br />
20<br />
10<br />
0<br />
15<br />
10<br />
5<br />
0<br />
0.0 0.2 0.4 0.6 0.8 1.0<br />
E / V<br />
(a)<br />
(a)<br />
(b)<br />
(c)<br />
(d)<br />
(e)<br />
Fig. 3. Differential pulse voltamograms of gallic acid in methanol/acetate buffer<br />
0.1 M (pH 4)/NaClO 4 (70:28:2) solutions. (a) 0.20 mg/ml, (b) 0.15 mg/ml, (c) 0.1 mg/<br />
ml, (d) 0.05 mg/ml, and (e) 0.02 mg/ml.<br />
(b)<br />
(c)<br />
(d)<br />
(e)<br />
0 2 4 6 8 10 12 14 16<br />
Extract/ mgml -1<br />
Fig. 4. Variation of the peak current density, in DPV voltamograms, with extract<br />
concentration. (a) A. silvicola, (b) A. bisporus, (c) A. silvaticus, (d) A. arvensis, and (e) A.<br />
romagnesii.
66 L. Barros et al. / <strong>Food</strong> <strong>Chemistry</strong> 111 (2008) 61–66<br />
therefore the relation between current density and concentration<br />
for the mushroom extracts will differs from that of gallic and ascorbic<br />
acid. The difference between the slopes of the two standards in<br />
Table 3, reflects the difference between their diffusion coefficients.<br />
However, when compared with the extracts slopes, the enormous<br />
discrepancy cannot be explained on the basis of their different<br />
diffusion coefficients (species belong to a chemically comparable<br />
family of phenol compounds), but to the amount of effective electroactive<br />
mass in the mushroom extract composition. Based on the<br />
similarity in the cyclic voltamograms of Agaricus sp, it can be<br />
assumed that the species responsible for the electrochemical<br />
activity are chemically similar as well as their diffusion coefficient.<br />
In this context and based on the slopes values of peak current<br />
density vs. extract concentration plots, it can be concluded that<br />
the amount of electroactive phenolic compounds in A. bisporus,<br />
A. silvaticus and A. silvicola are almost double of that present in<br />
the extract of A. arvensis and A. romagnesii.<br />
In order to express the ‘‘antioxidant power” of the mushrooms<br />
extracts in equivalent terms we compared the results with that<br />
of the standards. We must mention that at very low and high concentrations<br />
of extract there are significant deviations in linearity of<br />
j vs. mass, most probably due to adsorption phenomena on the<br />
electrode. The values are presented in Table 3, and are expressed<br />
in terms of either gallic or ascorbic acid. These results show that<br />
A. silvicola and A. silvaticus exhibit the highest ‘‘antioxidant power”<br />
in agreement with the results obtained in the biochemical assays.<br />
The values obtained from the electrochemical experiment are lower<br />
than those resulting from Folin Ciocalteús assay. This outcome is<br />
frequently observed when comparing the colorimetric method<br />
with others and is attributed to the overestimation of the ‘‘total<br />
polyphenolic” content due to the interferences of other non-phenolic<br />
species like reduction sugars (Blasco et al., 2005).<br />
Overall, all the species proved to have antioxidant properties,<br />
namely radical scavenging activity and lipid peroxidation inhibition<br />
capacity. By using electrochemical techniques, it was also<br />
proved that mushroom extracts have a similar composition on<br />
the electroactive species, which exhibit oxidation potentials more<br />
positive than the standards. A. silvaticus was the most efficient species<br />
presenting the lowest EC 50 values in the chemical and biochemical<br />
assays, and the highest ‘‘antioxidant power” in the<br />
electrochemical assays. Finally, the work described in this study<br />
showed that cyclic voltammetry and differential pulse voltammetry<br />
can be considered as important techniques for the evaluation<br />
of mushrooms antioxidant properties.<br />
Acknowledgements<br />
The authors are grateful to Fundacßão para a Ciência e a Tecnologia<br />
(FCT-Portugal) for financial support through the Project Ref.<br />
PPCDT/AGR/56661/2004.<br />
References<br />
Ames, B. M. (1983). Dietary carcinogens and anticarcinogens: Oxygen radical and<br />
degenerative disease. Science, 221, 1256–1263.<br />
Ames, B. M., Shigenaga, M. K., & Hagen, T. M. (1993). Oxidants, antioxidants and the<br />
degenerative diseases of aging. Proceedings of the National Academy Sciences, 90,<br />
7915–7922.<br />
Barros, L., Baptista, P., Correia, D. M., Morais, J. S., & Ferreira, I. C. F. R. (2007). Effects<br />
of conservation treatment and cooking on the chemical composition and<br />
antioxidant activity of Portuguese wild edible mushrooms. Journal of<br />
Agricultural and <strong>Food</strong> <strong>Chemistry</strong>, 55, 4781–4788.<br />
Barros, L., Baptista, P., & Ferreira, I. C. F. R. (2007). Effect of Lactarius piperatus<br />
fruiting body maturity stage on antioxidant activity measured by several<br />
biochemical assays. <strong>Food</strong> and Chemical Toxicology, 45, 1731–1737.<br />
Barros, L., Calhelha, R. C., Vaz, J. A., Ferreira, I. C. F. R., Baptista, P., & Estevinho, L. M.<br />
(2007). Antimicrobial activity and bioactive compounds of Portuguese wild<br />
edible mushrooms. European <strong>Food</strong> Research and Technology, 225, 151–156.<br />
Barros, L., Ferreira, M.-J., Queirós, B., Ferreira, I. C. F. R., & Baptista, P. (2007). Total<br />
phenols, ascorbic acid, â-carotene and lycopene in Portuguese wild edible<br />
mushrooms and their antioxidant activities. <strong>Food</strong> <strong>Chemistry</strong>, 103, 314–419.<br />
Blasco, A. J., González, M. C., & Escarpa, A. (2004). Electrochemical approach for<br />
discriminating and measuring predominant flavonoids and phenolic acids using<br />
differential pulse voltammetry: Towards an electrochemical index of natural<br />
antioxidants. Analytical Chimica Acta, 511, 71–81.<br />
Blasco, A. J., Rogerio, M. C., González, M. C., & Escarpa, A. (2005). ‘‘Electrochemical<br />
Index” as a screening method to determine ‘‘total polyphenolics” in foods: A<br />
proposal. Analytical Chimica Acta, 539, 237–244.<br />
Block, G., Patterson, B., & Subar, A. (1992). Fruits, vegetables and cancer prevention:<br />
A review of the epidemiological evidence. Nutrition and Cancer – An<br />
International Journal, 18, 1–29.<br />
Branen, A. L. (1975). Toxicology and biochemistry of butylated hydroxy anisole and<br />
butylated hydroxy toluene. Journal of the American Oil Chemists Society, 52,<br />
59–63.<br />
Brett, C. M. A., & Brett, A. M. O. (1993). Electrochemistry – principles methods and<br />
applications. Oxford: Oxford University Press. p. 219.<br />
Cazzi, R., Ricardy, R., Aglitti, T., Gatta, V., Petricone, P., & De Salvia, R. (1997).<br />
Ascorbic acid and b-carotene as modulators of oxidative damage.<br />
Carcinogenesis, 18, 223–228.<br />
Cheung, L. M., Cheung, P. C. K., & Ooi, V. E. C. (2003). Antioxidant activity and total<br />
phenolics of edible mushroom extracts. <strong>Food</strong> <strong>Chemistry</strong>, 81, 249–255.<br />
Chevion, S., Roberts, M. A., & Chevion, M. (2000). The use of cyclic voltammetry for<br />
the evaluation of antioxidant capacity. Free Radical Biology and Medicine, 28,<br />
860–870.<br />
Cosio, M. S., Buratti, S., Mannino, S., & Benedetti, S. (2006). Use of an electrochemical<br />
method to evaluate the antioxidant activity of herb extracts from the Labiatae<br />
family. <strong>Food</strong> <strong>Chemistry</strong>, 97, 725–731.<br />
Courtecuisse, R., & Duhem, B. (1995). In Mushrooms and toadstools of Britain and<br />
Europe. London: HarperCollins Publishers.<br />
Decker, E. A. (1997). Phenolics: Prooxidants or antioxidants? Nutrition Reviews, 55,<br />
396–407.<br />
Elmastasa, M., Isildaka, O., Turkekulb, I., & Temura, N. (2007). Determination of<br />
antioxidant activity and antioxidant compounds in wild edible mushrooms.<br />
Journal of <strong>Food</strong> Composition and Analysis, 20, 337–345.<br />
Ferreira, I. C. F. R., Baptista, P., Vilas-Boas, M., & Barros, L. (2007). Free-radical<br />
scavenging capacity and reducing power of wild edible mushrooms from<br />
northeast Portugal. <strong>Food</strong> <strong>Chemistry</strong>, 100, 1511–1516.<br />
Gillman, M. W., Cupples, A., Gagnon, D., Posner, B. M., Ellison, R. C., Castelli, W. P.,<br />
et al. (1995). Protective effect of fruits and vegetables on development of stroke<br />
in men. Journal of the American Medical Association, 273, 1113–1117.<br />
Gunckel, S., Santander, P., Cordano, G., Ferreira, J., Munoz, S., Nunez-Vergara, L. J.,<br />
et al. (1998). Antioxidant activity of gallates: An electrochemical study in<br />
aqueous media. Chemico-Biological Interactions, 114, 45–59.<br />
Halliwell, B., & Gutteridge, J. M. C. (2003). Free radicals in biology and medicine.<br />
Oxford, UK: Oxford University Press.<br />
Kilmartin, P. A., Zou, H., & Waterhouse, A. L. (2001). A cyclic voltammetry method<br />
suitable for characterizing antioxidant properties of wine and wine phenolics.<br />
Journal of Agricultural and <strong>Food</strong> <strong>Chemistry</strong>, 49, 1957–1965.<br />
Korotkova, E. I., Karbainov, Y. A., & Shevchuk, A. V. (2002). Study of antioxidant<br />
properties by voltammetry. Journal of Electroanalytical <strong>Chemistry</strong>, 518, 56–60.<br />
Liu, R. H. (2003). Health benefits of fruits and vegetables are from additive and<br />
synergistic combination of phytochemicals. American Journal of Clinical<br />
Nutrition, 78, 517S–520S.<br />
Moser, M. (1983). In keys to Agaricus and Boleti (Polyporales, Boletales, Agaricales,<br />
Russulales). London: Roger Phillips.<br />
Niki, E., Shimaski, H., & Mino, M. (1994). Antioxidantism – free radical and biological<br />
defence. Tokyo: Gakkai Syuppan Center.<br />
Roedig-Penman, A., & Gordon, M. H. (1998). Antioxidant properties of myricetin and<br />
quercetin in oil and emulsions. Journal of the American Oil Chemists Society, 75,<br />
169–180.<br />
Valentão, P., Andrade, P. B., Rangel, J., Ribeiro, B., Silva, B. M., Baptista, P., et al.<br />
(2005). Effect of the conservation procedure on the contents of phenolic<br />
compounds and organic acids in Chanterelle (Cantharellus cibarius) mushroom.<br />
Journal of Agricultural and <strong>Food</strong> <strong>Chemistry</strong>, 53, 4925–4931.<br />
Valentão, P., Lopes, G., Valente, M., Barbosa, P., Andrade, P. B., Silva, B. M., et al.<br />
(2005). Quantification of nine organic acids in wild mushrooms. Journal of<br />
Agricultural and <strong>Food</strong> <strong>Chemistry</strong>, 53, 3626–3630.