Appendix 5.2-1 - People.stat.sfu.ca - Simon Fraser University
Appendix 5.2-1 - People.stat.sfu.ca - Simon Fraser University
Appendix 5.2-1 - People.stat.sfu.ca - Simon Fraser University
You also want an ePaper? Increase the reach of your titles
YUMPU automatically turns print PDFs into web optimized ePapers that Google loves.
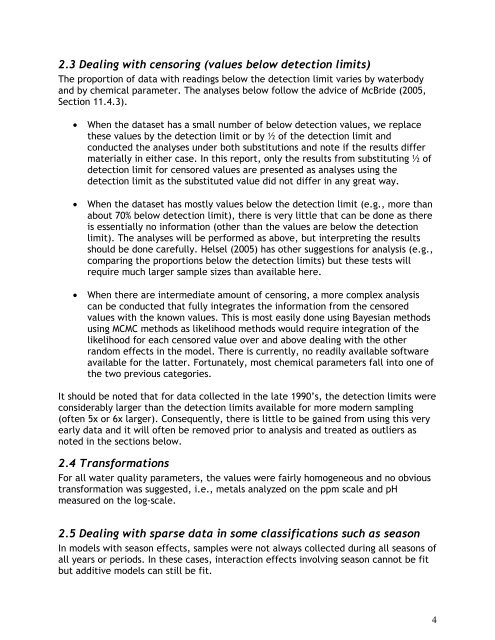
2.3 Dealing with censoring (values below detection limits)The proportion of data with readings below the detection limit varies by waterbodyand by chemi<strong>ca</strong>l parameter. The analyses below follow the advice of McBride (2005,Section 11.4.3).• When the dataset has a small number of below detection values, we replacethese values by the detection limit or by ½ of the detection limit andconducted the analyses under both substitutions and note if the results differmaterially in either <strong>ca</strong>se. In this report, only the results from substituting ½ ofdetection limit for censored values are presented as analyses using thedetection limit as the substituted value did not differ in any great way.• When the dataset has mostly values below the detection limit (e.g., more thanabout 70% below detection limit), there is very little that <strong>ca</strong>n be done as thereis essentially no information (other than the values are below the detectionlimit). The analyses will be performed as above, but interpreting the resultsshould be done <strong>ca</strong>refully. Helsel (2005) has other suggestions for analysis (e.g.,comparing the proportions below the detection limits) but these tests willrequire much larger sample sizes than available here.• When there are intermediate amount of censoring, a more complex analysis<strong>ca</strong>n be conducted that fully integrates the information from the censoredvalues with the known values. This is most easily done using Bayesian methodsusing MCMC methods as likelihood methods would require integration of thelikelihood for each censored value over and above dealing with the otherrandom effects in the model. There is currently, no readily available softwareavailable for the latter. Fortunately, most chemi<strong>ca</strong>l parameters fall into one ofthe two previous <strong>ca</strong>tegories.It should be noted that for data collected in the late 1990’s, the detection limits wereconsiderably larger than the detection limits available for more modern sampling(often 5x or 6x larger). Consequently, there is little to be gained from using this veryearly data and it will often be removed prior to analysis and treated as outliers asnoted in the sections below.2.4 TransformationsFor all water quality parameters, the values were fairly homogeneous and no obvioustransformation was suggested, i.e., metals analyzed on the ppm s<strong>ca</strong>le and pHmeasured on the log-s<strong>ca</strong>le.2.5 Dealing with sparse data in some classifi<strong>ca</strong>tions such as seasonIn models with season effects, samples were not always collected during all seasons ofall years or periods. In these <strong>ca</strong>ses, interaction effects involving season <strong>ca</strong>nnot be fitbut additive models <strong>ca</strong>n still be fit.4


