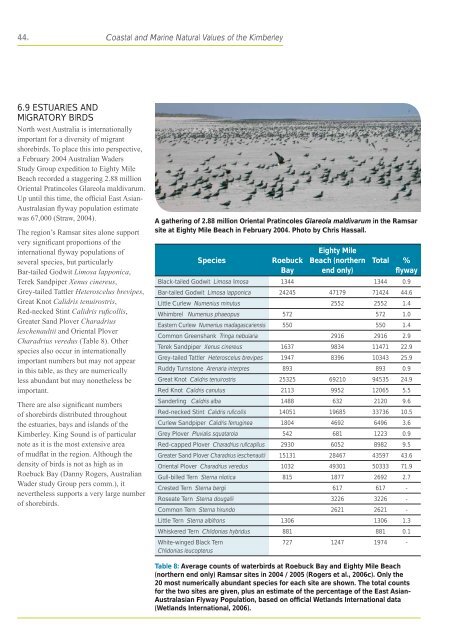
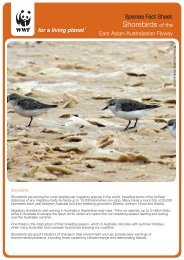
44. Coastal <strong>and</strong> Marine Natural Values <strong>of</strong> <strong>the</strong> Kimberley6.9 ESTUARIES ANDMIGRATORY BIRDSNorth west <strong>Australia</strong> is internationallyimportant for a diversity <strong>of</strong> migrantshorebirds. To place this into perspective,a February 2004 <strong>Australia</strong>n WadersStudy Group expedition to Eighty MileBeach recorded a staggering 2.88 millionOriental Pratincoles Glareola maldivarum.Up until this time, <strong>the</strong> <strong>of</strong>ficial East Asian-Australasian flyway population estimatewas 67,000 (Straw, 2004).The region’s Ramsar sites alone supportvery significant proportions <strong>of</strong> <strong>the</strong>international flyway populations <strong>of</strong>several species, but particularlyBar-tailed Godwit Limosa lapponica,Terek S<strong>and</strong>piper Xenus cinereus,Grey-tailed Tattler Heteroscelus brevipes,Great Knot Calidris tenuirostris,Red-necked Stint Calidris rufi collis,Greater S<strong>and</strong> Plover Charadriusleschenaultii <strong>and</strong> Oriental PloverCharadrius veredus (Table 8). O<strong>the</strong>rspecies also occur in internationallyimportant numbers but may not appearin this table, as <strong>the</strong>y are numericallyless abundant but may none<strong>the</strong>less beimportant.There are also significant numbers<strong>of</strong> shorebirds distributed throughout<strong>the</strong> estuaries, bays <strong>and</strong> isl<strong>and</strong>s <strong>of</strong> <strong>the</strong>Kimberley. King Sound is <strong>of</strong> particularnote as it is <strong>the</strong> most extensive area<strong>of</strong> mudflat in <strong>the</strong> region. Although <strong>the</strong>density <strong>of</strong> birds is not as high as inRoebuck Bay (Danny Rogers, <strong>Australia</strong>nWader study Group pers comm.), itnever<strong>the</strong>less supports a very large number<strong>of</strong> shorebirds.A ga<strong>the</strong>ring <strong>of</strong> 2.88 million Oriental Pratincoles Glareola maldivarum in <strong>the</strong> Ramsarsite at Eighty Mile Beach in February 2004. Photo by Chris Hassall.SpeciesRoebuckBayEighty MileBeach (nor<strong>the</strong>rnend only)Total %flywayBlack-tailed Godwit Limosa limosa 1344 1344 0.9Bar-tailed Godwit Limosa lapponica 24245 47179 71424 44.6Little Curlew Numenius minutus 2552 2552 1.4Whimbrel Numenius phaeopus 572 572 1.0Eastern Curlew Numenius madagascariensis 550 550 1.4Common Greenshank Tringa nebularia 2916 2916 2.9Terek S<strong>and</strong>piper Xenus cinereus 1637 9834 11471 22.9Grey-tailed Tattler Heteroscelus brevipes 1947 8396 10343 25.9Ruddy Turnstone Arenaria interpres 893 893 0.9Great Knot Calidris tenuirostris 25325 69210 94535 24.9Red Knot Calidris canutus 2113 9952 12065 5.5S<strong>and</strong>erling Calidris alba 1488 632 2120 9.6Red-necked Stint Calidris rufi collis 14051 19685 33736 10.5Curlew S<strong>and</strong>piper Calidris ferruginea 1804 4692 6496 3.6Grey Plover Pluvialis squatarola 542 681 1223 0.9Red-capped Plover Charadrius rufi capillus 2930 6052 8982 9.5Greater S<strong>and</strong> Plover Charadrius leschenaultii 15131 28467 43597 43.6Oriental Plover Charadrius veredus 1032 49301 50333 71.9Gull-billed Tern Sterna nilotica 815 1877 2692 2.7Crested Tern Sterna bergii 617 617 -Roseate Tern Sterna dougallii 3226 3226 -Common Tern Sterna hirundo 2621 2621 -Little Tern Sterna albifrons 1306 1306 1.3Whiskered Tern Chlidonias hybridus 881 881 0.1White-winged Black TernChlidonias leucopterus727 1247 1974 -Table 8: Average counts <strong>of</strong> waterbirds at Roebuck Bay <strong>and</strong> Eighty Mile Beach(nor<strong>the</strong>rn end only) Ramsar sites in 2004 / 2005 (Rogers et al., 2006c). Only <strong>the</strong>20 most numerically abundant species for each site are shown. The total countsfor <strong>the</strong> two sites are given, plus an estimate <strong>of</strong> <strong>the</strong> percentage <strong>of</strong> <strong>the</strong> East Asian-Australasian Flyway Population, based on <strong>of</strong>ficial Wetl<strong>and</strong>s International data(Wetl<strong>and</strong>s International, 2006).
Coastal <strong>and</strong> Marine Natural Values <strong>of</strong> <strong>the</strong> Kimberley45.Most <strong>of</strong> <strong>the</strong>se species are migrants thatmove twice a year to <strong>and</strong> from breedinglocations throughout Asia <strong>and</strong> as farnorth as Siberia. The dual availability<strong>of</strong> high quality estuarine feeding habitat<strong>and</strong> adjacent undisturbed roosts isessential to <strong>the</strong> viability <strong>of</strong> populations(Rogers et al., 2006a; Rogers et al.,2006b). Relatively small changes to <strong>the</strong>viability <strong>of</strong> ei<strong>the</strong>r habitat can translateinto shifts in <strong>the</strong> distribution <strong>of</strong> birds<strong>and</strong> an alteration <strong>of</strong> carrying capacity(Dolman & Su<strong>the</strong>rl<strong>and</strong>, 1995).Arctic breeding waders such as GreatKnot, which are a key feature <strong>of</strong> <strong>the</strong>Roebuck Bay Ramsar site, stage <strong>the</strong>irmigration to replenish fat reserves in<strong>the</strong> Yellow Sea before continuing <strong>the</strong>ir10,000 km flight to breed. In 2006,<strong>the</strong> completion <strong>of</strong> a sea wall acrossSaemangeum, at <strong>the</strong> mouth <strong>of</strong> <strong>the</strong>Mangyeung <strong>and</strong> Dongjin Estuaries inSouth Korea meant <strong>the</strong> immediate <strong>and</strong>catastrophic loss <strong>of</strong> <strong>the</strong> most importantstaging site in <strong>the</strong> Yellow Sea (Rogers &van de Kam, 2007). This loss has placedgreater dem<strong>and</strong> on <strong>Australia</strong> to conservenorth west <strong>Australia</strong>’s shorebird habitat,since substantial decline in <strong>the</strong> ability <strong>of</strong>birds to reach migration fitness wouldhave a far greater cumulative impact on<strong>the</strong>ir ability to maintain this fitness tobreed in <strong>the</strong> Arctic.This emphasises <strong>the</strong> need <strong>and</strong> purpose forinternational agreements, to avoid a greaterthan necessary burden on any particularnation. Never<strong>the</strong>less, <strong>the</strong> ongoing loss <strong>of</strong>staging areas in central Asia representsan existing condition <strong>and</strong> one that, due to<strong>Australia</strong>’s commitments under a range<strong>of</strong> migratory bird agreements, cannot beignored in managing <strong>the</strong> ecosystem <strong>of</strong>north west <strong>Australia</strong>.6.10 BREEDING ISLANDSBreeding seabirds <strong>and</strong> turtle rookeries arean exceptional component <strong>of</strong> <strong>the</strong> region’s<strong>coastal</strong> ecosystem, which is relativelyundisturbed. Isl<strong>and</strong>s, such as Adele, <strong>the</strong>Lacapedes, Booby Isl<strong>and</strong>, Low Rocks,Nor<strong>the</strong>ast <strong>and</strong> Northwest Twin Isl<strong>and</strong>s are<strong>of</strong> national or international significance.Seabirds are unable to breed unless <strong>the</strong>reis adequate access to feeding resources<strong>and</strong> many species have surprisinglylimited foraging ranges during criticaltimes <strong>of</strong> <strong>the</strong> year. Areas such as KingSound are likely to be critical foraginghabitat for Roseate Tern (George Swann,Kimberley Birdwatching pers. comm.),whilst tidal mixing zones with richecological productivity west <strong>of</strong> AdeleIsl<strong>and</strong> (section 5.3.3) are responsible for<strong>the</strong> viability <strong>of</strong> those seabird colonies.7. CONCLUSION6.11 RIVER MOUTHSAND CREEKSThe mouths <strong>of</strong> rivers <strong>and</strong> creeks provideimportant habitat for a range <strong>of</strong> speciesnot found elsewhere in <strong>the</strong> region. Theinfluence <strong>of</strong> <strong>the</strong> wet season is unknownbut at least one species, Little Tern,appears to depend on this as it is one<strong>of</strong> <strong>the</strong> few seabirds that breeds in midsummer. Geomorphological featuresassociated with sediment, such ass<strong>and</strong> banks, create <strong>the</strong> environment forseagrass to grow <strong>and</strong> provide habitatfor summer breeding birds such asLittle Tern. This species is widespreadthroughout <strong>the</strong> Kimberley but lesscommon in o<strong>the</strong>r parts <strong>of</strong> <strong>Australia</strong> <strong>and</strong> isexpected to associate with seagrass beds<strong>and</strong> shallow s<strong>and</strong>y areas.Both Nor<strong>the</strong>rn River Shark <strong>and</strong>Freshwater Sawfish are found in <strong>the</strong>seenvironments. The former specieshas not been seen in Queensl<strong>and</strong> for20 years <strong>and</strong> <strong>the</strong> importance <strong>of</strong> <strong>the</strong>Nor<strong>the</strong>rn Kimberley, which has <strong>the</strong>largest remaining populations <strong>of</strong> both,is put down to <strong>the</strong> relatively pristineenvironment (Thornburn & Morgan,2003; Thornburn et al., 2004).Biodiversity conservation is one <strong>of</strong> <strong>the</strong> pivotal principles <strong>of</strong> ecologicallysustainable development <strong>and</strong> is reflected through our laws <strong>and</strong> policies to protectspecies <strong>and</strong> <strong>the</strong>ir environment.International authorities under <strong>the</strong> Convention on Biological Diversity agree thatbiodiversity can only be managed from an ecological perspective. Provisionsfor management <strong>of</strong> <strong>the</strong> Commonwealth Marine Area <strong>and</strong> Ramsar sites, NationalOceans Policy, <strong>the</strong> Intergovernmental Agreement on <strong>the</strong> Environment <strong>and</strong>numerous Western <strong>Australia</strong> state policies, reflect <strong>Australia</strong>’s progressivecommitment to ecologically sustainable development.This report provides an overview <strong>of</strong> some <strong>of</strong> <strong>the</strong> key elements <strong>of</strong> <strong>the</strong> Kimberley<strong>coastal</strong> <strong>and</strong> <strong>marine</strong> ecosystem. Ultimately, it is hoped this will help responsibleauthorities, policy makers <strong>and</strong> <strong>the</strong> community identify potentially threateningprocesses <strong>and</strong> <strong>the</strong> detail <strong>and</strong> type <strong>of</strong> scientific knowledge <strong>marine</strong> ecologists can useto make a reasoned assessment <strong>of</strong> biodiversity value <strong>and</strong> impact significance.