3 swing trading examples, with charts - The Swing Trading Guide
3 swing trading examples, with charts - The Swing Trading Guide
3 swing trading examples, with charts - The Swing Trading Guide

You also want an ePaper? Increase the reach of your titles
YUMPU automatically turns print PDFs into web optimized ePapers that Google loves.
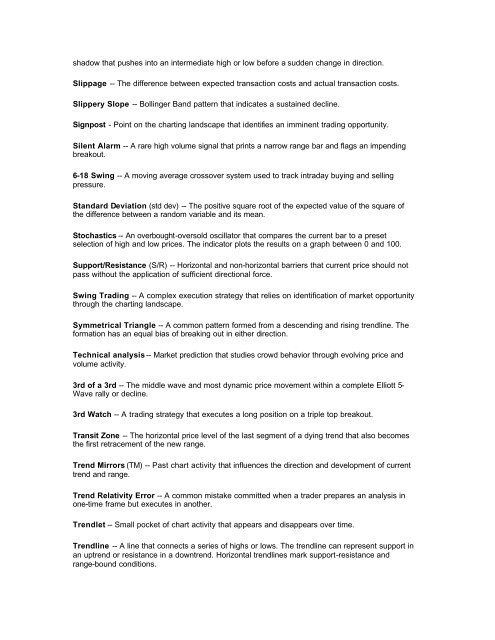
shadow that pushes into an intermediate high or low before a sudden change in direction.Slippage -- <strong>The</strong> difference between expected transaction costs and actual transaction costs.Slippery Slope -- Bollinger Band pattern that indicates a sustained decline.Signpost - Point on the charting landscape that identifies an imminent <strong>trading</strong> opportunity.Silent Alarm -- A rare high volume signal that prints a narrow range bar and flags an impendingbreakout.6-18 <strong>Swing</strong> -- A moving average crossover system used to track intraday buying and sellingpressure.Standard Deviation (std dev) -- <strong>The</strong> positive square root of the expected value of the square ofthe difference between a random variable and its mean.Stochastics -- An overbought-oversold oscillator that compares the current bar to a presetselection of high and low prices. <strong>The</strong> indicator plots the results on a graph between 0 and 100.Support/Resistance (S/R) -- Horizontal and non-horizontal barriers that current price should notpass <strong>with</strong>out the application of sufficient directional force.<strong>Swing</strong> <strong>Trading</strong> -- A complex execution strategy that relies on identification of market opportunitythrough the charting landscape.Symmetrical Triangle -- A common pattern formed from a descending and rising trendline. <strong>The</strong>formation has an equal bias of breaking out in either direction.Technical analysis -- Market prediction that studies crowd behavior through evolving price andvolume activity.3rd of a 3rd -- <strong>The</strong> middle wave and most dynamic price movement <strong>with</strong>in a complete Elliott 5-Wave rally or decline.3rd Watch -- A <strong>trading</strong> strategy that executes a long position on a triple top breakout.Transit Zone -- <strong>The</strong> horizontal price level of the last segment of a dying trend that also becomesthe first retracement of the new range.Trend Mirrors (TM) -- Past chart activity that influences the direction and development of currenttrend and range.Trend Relativity Error -- A common mistake committed when a trader prepares an analysis inone-time frame but executes in another.Trendlet -- Small pocket of chart activity that appears and disappears over time.Trendline -- A line that connects a series of highs or lows. <strong>The</strong> trendline can represent support inan uptrend or resistance in a downtrend. Horizontal trendlines mark support-resistance andrange-bound conditions.