3 swing trading examples, with charts - The Swing Trading Guide
3 swing trading examples, with charts - The Swing Trading Guide
3 swing trading examples, with charts - The Swing Trading Guide

You also want an ePaper? Increase the reach of your titles
YUMPU automatically turns print PDFs into web optimized ePapers that Google loves.
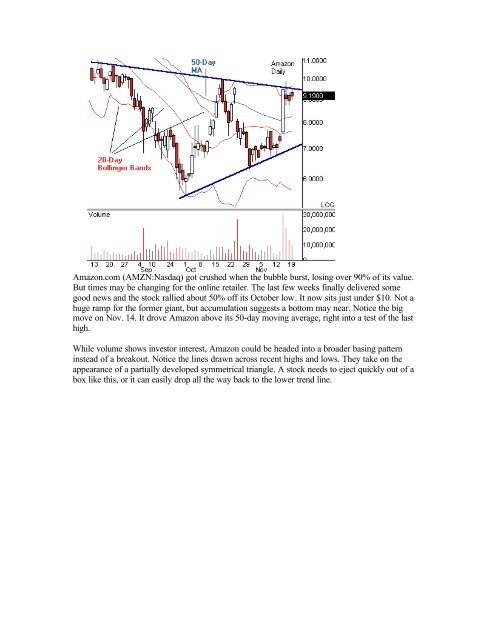
Amazon.com (AMZN:Nasdaq) got crushed when the bubble burst, losing over 90% of its value.But times may be changing for the online retailer. <strong>The</strong> last few weeks finally delivered somegood news and the stock rallied about 50% off its October low. It now sits just under $10. Not ahuge ramp for the former giant, but accumulation suggests a bottom may near. Notice the bigmove on Nov. 14. It drove Amazon above its 50-day moving average, right into a test of the lasthigh.While volume shows investor interest, Amazon could be headed into a broader basing patterninstead of a breakout. Notice the lines drawn across recent highs and lows. <strong>The</strong>y take on theappearance of a partially developed symmetrical triangle. A stock needs to eject quickly out of abox like this, or it can easily drop all the way back to the lower trend line.