Evolution of surface gravity waves over a submarine canyon
Evolution of surface gravity waves over a submarine canyon
Evolution of surface gravity waves over a submarine canyon

Create successful ePaper yourself
Turn your PDF publications into a flip-book with our unique Google optimized e-Paper software.
ClickHereforFullArticleJOURNAL OF GEOPHYSICAL RESEARCH, VOL. 112, C01002, doi:10.1029/2005JC003035, 2007<strong>Evolution</strong> <strong>of</strong> <strong>surface</strong> <strong>gravity</strong> <strong>waves</strong> <strong>over</strong> a <strong>submarine</strong><strong>canyon</strong>R. Magne, 1 K. A. Belibassakis, 2 T. H. C. Herbers, 3 Fabrice Ardhuin, 1 W. C. O’Reilly, 4and V. Rey 5Received 30 April 2005; revised 13 July 2006; accepted 5 September 2006; published 9 January 2007.[1] The effects <strong>of</strong> a <strong>submarine</strong> <strong>canyon</strong> on the propagation <strong>of</strong> ocean <strong>surface</strong> <strong>waves</strong>are examined with a three-dimensional coupled-mode model for wave propagation <strong>over</strong>steep topography. Whereas the classical geometrical optics approximation predicts anabrupt transition from complete transmission at small incidence angles to no transmissionat large angles, the full model predicts a more gradual transition with partial reflection/transmission that is sensitive to the <strong>canyon</strong> geometry and controlled by evanescent modesfor small incidence angles and relatively short <strong>waves</strong>. Model results for large incidenceangles are compared with data from directional wave buoys deployed around the rim and<strong>over</strong> Scripps Canyon, near San Diego, California, during the Nearshore CanyonExperiment (NCEX). Wave heights are observed to decay across the <strong>canyon</strong> by abouta factor 5 <strong>over</strong> a distance shorter than a wavelength. However, a spectral refractionmodel predicts an even larger reduction by about a factor 10, because low-frequencycomponents cannot cross the <strong>canyon</strong> in the geometrical optics approximation. Thecoupled-mode model yields accurate results <strong>over</strong> and behind the <strong>canyon</strong>. These resultsshow that although most <strong>of</strong> the wave energy is refractively trapped on the <strong>of</strong>fshore rim <strong>of</strong>the <strong>canyon</strong>, a small fraction <strong>of</strong> the wave energy ‘tunnels’ across the <strong>canyon</strong>.Simplifications <strong>of</strong> the model that reduce it to the standard and modified mild slopeequations also yield good results, confirming that evanescent modes and high-orderbottom slope effects are <strong>of</strong> minor importance for the energy transformation <strong>of</strong> <strong>waves</strong>propagating across depth contours at large oblique angles.Citation: Magne, R., K. A. Belibassakis, T. H. C. Herbers, F. Ardhuin, W. C. O’Reilly, and V. Rey (2007), <strong>Evolution</strong> <strong>of</strong> <strong>surface</strong><strong>gravity</strong> <strong>waves</strong> <strong>over</strong> a <strong>submarine</strong> <strong>canyon</strong>, J. Geophys. Res., 112, C01002, doi:10.1029/2005JC003035.1. Introduction[2] Waves are strongly influenced by the bathymetrywhen they reach shallow water areas. Munk and Traylor[1947] conducted a first quantitative study <strong>of</strong> the effects <strong>of</strong>bottom topography on wave energy transformation <strong>over</strong>Scripps and La Jolla Canyons, near San Diego, California.Wave refraction diagrams were constructed using a manualmethod, and compared to visual observations. Fairly goodagreement was found between predicted and observed waveheights. Other effects such as diffraction were found to beimportant elsewhere, for sharp bathymetric features (e.g.,harbor structures or coral reefs), prompting Berkh<strong>of</strong>f [1972]1 Centre Militaire d’Océanographie, Service Hydrographique etOcéanographique de la Marine, Brest, France.2 Department <strong>of</strong> Naval Architecture and Marine Engineering, NationalTechnical University <strong>of</strong> Athens, Athens, Greece.3 Department <strong>of</strong> Oceanography, Naval Postgraduate School, Monterey,California, USA.4 Integrative Oceanography Division, Scripps Institution <strong>of</strong> Oceanography,La Jolla, California, USA.5 Option Ingénierie Marine, Institut des Sciences de l’Ingénieur deToulon et du Var, La Valette du Var, France.Copyright 2007 by the American Geophysical Union.0148-0227/07/2005JC003035$09.00to introduce an equation that represents both refraction anddiffraction. Berkh<strong>of</strong>f’s equation is based on a verticalintegration <strong>of</strong> Laplace’s equation and is valid in the limit<strong>of</strong> small bottom slopes. It is widely known as the mild slopeequation (MSE). A parabolic approximation <strong>of</strong> this equationwas proposed by Radder [1979], and further refined byKirby [1986] and Dalrymple and Kirby [1988].[3] O’Reilly and Guza [1991, 1993] compared Kirby’s[1986] refraction-diffraction model to a spectral geometricaloptics refraction model based on the theory <strong>of</strong> Longuet-Higgins [1957]. The two models generally agreed in simulations<strong>of</strong> realistic swell propagation in the SouthernCalifornia Bight. However, both models assume a gentlysloping bottom, and their limitations in regions with steeptopography are not well understood. Booij [1983], showedthat the MSE is valid for bottom slopes as large as 1/3 fornormal wave incidence. To extend its application to steeperslopes, Massel [1993] [see also Chamberlain and Porter,1995] modified the MSE by including terms <strong>of</strong> second orderin the bottom slope, that were neglected by Berkh<strong>of</strong>f [1972].This modified mild slope equation (MMSE) includes termsproportional to the bottom curvature and the square <strong>of</strong> thebottom slope. Chandrasekera and Cheung [1997] observedthat the curvature terms significantly change the waveC010021<strong>of</strong>12
C01002MAGNE ET AL.: WAVES OVER SUBMARINE CANYONSC01002height behind a shoal, whereas the slope-squared terms havea weaker influence. Lee and Yoon [2004] noted that thehigher-order bottom slope terms change the wavelength,which in turn affects the refraction. In spite <strong>of</strong> theseimprovements, an important restriction <strong>of</strong> these equationsis that the vertical structure <strong>of</strong> the wave field is described bythe Airy solution <strong>of</strong> <strong>waves</strong> <strong>over</strong> a horizontal bottom. Hencethe MMSE cannot describe the wave field accurately <strong>over</strong>steep bottom topography. Thus Massel [1993] introduced anadditional infinite series <strong>of</strong> local modes (‘evanescentmodes’ or ‘decaying <strong>waves</strong>’), that allows a local adaptation<strong>of</strong> the wave field [see also Porter and Staziker, 1995], andconverges to the exact solution <strong>of</strong> Laplace’s equation,except at the bottom interface. Indeed, the vertical velocityat the bottom is still zero, and is discontinuous in the limit <strong>of</strong>an infinite number <strong>of</strong> modes. Recently, Athanassoulis andBelibassakis [1999] added a ‘sloping bottom mode’ to thelocal mode series expansion, which properly satisfies theNeuman bottom boundary condition. This approach wasfurther explored by Chandrasekera and Cheung, [2001] andKim and Bai, [2004]. Although the sloping-bottom modeyields only small corrections for the wave height, it significantlyimproves the accuracy <strong>of</strong> the velocity field close tothe bottom. More<strong>over</strong>, this mode enables a faster convergence<strong>of</strong> the series <strong>of</strong> evanescent modes, by making theconvergence mathematically uniform.[4] As these steep topography models are becomingavailable, one may wonder if this level <strong>of</strong> sophistication isnecessary to accurately describe the transformation <strong>of</strong> ocean<strong>waves</strong> <strong>over</strong> natural continental shelf topography. It isexpected that if such models are to be useful anywhere, itshould be around steep <strong>submarine</strong> <strong>canyon</strong>s. Surprisingly, ageometrical optics refraction model that assumes weakamplitude gradients on the scale <strong>of</strong> the wavelength, usuallycorresponding to gentle bottom slopes, was found to yieldaccurate predictions <strong>of</strong> swell transformation <strong>over</strong> Scripps<strong>canyon</strong> [Peak, 2004]. The practical limitations <strong>of</strong> mild slopeapproximations for natural seafloor topography are clearlynot well established.[5] The goal <strong>of</strong> the present paper is to understand thepropagation <strong>of</strong> <strong>waves</strong> <strong>over</strong> a <strong>submarine</strong> <strong>canyon</strong>, includingthe practical imitations <strong>of</strong> geometrical optics theory for theassociated large bottom slopes. Numerical models will beused to sort out the relative importance <strong>of</strong> refraction, anddiffraction effects. Observations <strong>of</strong> ocean swell transformation<strong>over</strong> Scripps and La Jolla Canyons, collected during theNearshore Canyon Experiment (NCEX), are compared withpredictions <strong>of</strong> the three-dimensional (3D) coupled-modemodel. This model is called NTUA5 because its presentimplementation will be limited to a total <strong>of</strong> 5 modes[Belibassakis et al., 2001]. This is the first verification <strong>of</strong>a NTUA-type model with field observations, as previousmodel validations were done with laboratory data. Thisapplication <strong>of</strong> NTUA5 to <strong>submarine</strong> <strong>canyon</strong>s is not straightforwardsince the model is based on the extension <strong>of</strong> the twodimensional(2D) model <strong>of</strong> [Athanassoulis and Belibassakis,1999], and requires special care in the position <strong>of</strong> the <strong>of</strong>fshoreboundary and the numerical damping <strong>of</strong> scattered <strong>waves</strong>along the boundary. Further details on these and s<strong>of</strong>twaredevelopments, and a comparison with results <strong>of</strong> the SWANmodel [Booij et al., 1999] for the same NCEX case are givenby Gerosthathis et al. [2005].[6] Here model results are compared with two earliermodels which assume a gently sloping bottom. These arethe parabolic refraction/diffraction model REF/DIF1 (V2.5)[Kirby, 1986], applied in a spectral sense, and a spectralrefraction model based on backward ray tracing [Dobson,1967; O’Reilly and Guza, 1993]. A brief description <strong>of</strong> thecoupled-mode model and the problems posed by its implementationin the NCEX area is given in section 2. Althoughour objective is the understanding <strong>of</strong> complex 3D bottomtopography effects in the NCEX observations, this requiressome prior analysis, performed in section 3, <strong>of</strong> reflectionand refraction patterns <strong>over</strong> idealized 2D <strong>canyon</strong>s. Resultsare presented for realistic transverse <strong>canyon</strong> pr<strong>of</strong>iles,including a comparison with the 2D analysis <strong>of</strong> infra<strong>gravity</strong>wave observations reported by Thomson et al. [2005].Comparisons <strong>of</strong> 3D models with field data are presentedin section 4 for representative swell events observed duringNCEX. Conclusions follow in section 5.2. Numerical Models[7] The fully elliptic 3D model developed by Belibassakiset al. [2001] is based on the 2D model <strong>of</strong> Athanassoulis andBelibassakis [1999]. These authors formulate the problem asa transmission problem in a finite subdomain <strong>of</strong> variabledepth h 2 (x) (uniform in the lateral y-direction), closed by theappropriate matching conditions at the <strong>of</strong>fshore and inshoreboundaries. The <strong>of</strong>fshore and inshore areas are considered asincidence and transmission regions respectively, with uniformbut different depths (h 1 , h 3 ), where complex wavepotential amplitudes 8 1 and 8 3 are represented by completenormal-mode series containing the propagating and evanescentmodes.[8] The wave potential 8 2 associated with h 2 (region 2), isgiven by the following local mode series expansion:8 2 ðx; zÞ ¼ 8 1 ðÞZ x 1 ðz; xÞþ8 0 ðÞZ x 0 ðz; xÞþ X1n¼18 n ðÞZ x n ðz; xÞ; ð1Þwhere 8 0 (x)Z 0 (z; x) is the propagating mode and 8 n (x)Z n (z; x)are the evanescent modes. The additional term8 1 (x)Z 1 (z; x) is the sloping-bottom mode, which permitsthe consistent satisfaction <strong>of</strong> the bottom boundary conditionon a sloping bottom. The modes allow for the localadaptation <strong>of</strong> the wave potential. The functions Z n (z; x)which represent the vertical structure <strong>of</strong> the n th mode aregiven byZ 0 ðz; xÞ ¼ cosh ½ k 0ðÞz x ð þ hx ðÞÞŠ; ð2Þcoshðk 0 ðÞhx xÞZ n ðz; xÞ ¼ cos ½ k nðÞz x ð þ hx ðÞÞŠ; n ¼ 1; 2; ...; ð3Þcosðk n ðÞhx xÞ" z 3 Z 1 ðz; xÞ ¼ hx ðÞ þ z # 2; ð4Þhx ðÞ hx ðÞ2<strong>of</strong>12
C01002MAGNE ET AL.: WAVES OVER SUBMARINE CANYONSC01002where k 0 and k n are the wavenumbers obtained from thedispersion relation (for propagating and evanescentmodes), evaluated for the local depth h = h(x):w 2 ¼ gk 0 tanh k 0 h ¼ gk n tan k n h; ð5Þwith w the angular frequency.[9] As discussed by Athanassoulis and Belibassakis[1999], alternative formulations <strong>of</strong> Z 1 exist, and the extrasloping-bottom mode controls only the rate <strong>of</strong> convergence<strong>of</strong> the expansion (1) to a solution that is indeed unique. Themodal amplitudes 8 n are obtained by a variational principle,equivalent to the combination <strong>of</strong> Laplace’s equation, thebottom and <strong>surface</strong> boundary conditions, and the matchingconditions at the side boundaries, leading to the coupledmodesystem,X 1n¼ 1a mn ðÞ8 x00 ðÞþb mnðÞ8 x0 n ðÞþc x mnðÞ8 x n ðÞ¼0; xn xfor ðm ¼ 1; 0; 1; ... Þ; ð6Þwhere a mn , b mn and c mn are defined in terms <strong>of</strong> the Z nfunctions, and the appropriate end-conditions for the modeamplitudes 8 n ; for further details, see Athanassoulis andBelibassakis [1999]. The sloping-bottom mode ensuresabsolute and uniform convergence <strong>of</strong> the modal series. Therate <strong>of</strong> decay for the modal function amplitude isproportional to (n 4 ). Here the number <strong>of</strong> evanescentmodes is truncated at n = 3, which ensures satisfactoryconvergence, even for bottom slopes exceeding 1.[10] This 2D solution is further extended to realistic 3Dbottom topographies by Belibassakis et al. [2001]. In 3D,the depth h 2 is decomposed into a background parallelcontour<strong>surface</strong> h i (x) and a scattering topography h d (x, y).The 3D solution is then obtained as the linear superposition<strong>of</strong> appropriate harmonic functions corresponding to thesetwo topographies. There is no limitation on the shape andamplitude <strong>of</strong> the bottom represented by h d (x, y) except thath d > 0, which can always be enforced by a proper choice <strong>of</strong>h i [Belibassakis et al., 2001]. The wave potential solution<strong>over</strong> the 2D topography (h i ) is g<strong>over</strong>ned by the equationsdescribed previously. The wave potential associated withthe scatterers (h d ) is obtained as the solution <strong>of</strong> a 3Dscattering problem. The decomposition <strong>of</strong> the topographyin h d and h i is not uniquely defined by the constraints that h iis invariant along y and h d > 0, and there is thus no simplephysical interpretation <strong>of</strong> the scattered field which correspondsto both reflection and refraction effects. The mainbenefit <strong>of</strong> this decomposition is that the scattered wave fieldpropagates out <strong>of</strong> the model domain along the entireboundary, which greatly simplifies the specification <strong>of</strong> thehorizontal boundary conditions.[11] In practice we choseh i ðÞ¼min x fhx; ð yÞ for y 2 ½y min ; y max Šg: ð7ÞFurther, the bathymetry h i + h d is modified by including atransition region for y < y min and y > y max in which h d goesto zero at the model boundary, so that no scattering sourcesare on the boundary and <strong>waves</strong> actually propagate out <strong>of</strong> thedomain. This modification <strong>of</strong> the bathymetry does notchange the propagation <strong>of</strong> the incoming <strong>waves</strong>, providedthat the <strong>of</strong>fshore boundary is in uniform water depth, as inthe cases described by Belibassakis et al. [2001], or in deepenough water so that a uniform water depth can beprescribed without having an effect on the <strong>waves</strong>. Solutionsare obtained by solving a coupled-mode system, similarto equation (5), but extended to two horizontal dimensions(x, y), and coupled with the boundary conditions ensuringoutgoing radiation. The spatial grid for the scattered field isextended with a damping layer all around the boundary[Belibassakis et al., 2001].[12] Both 2D and 3D implementations <strong>of</strong> this NTUA5model are used here to investigate wave propagation <strong>over</strong> a<strong>submarine</strong> <strong>canyon</strong>. If we neglect the sloping-bottom modeand the evanescent modes, and retain in the local-modeseries only the propagating mode 8 0 (x, y), this model(NTUA5) exactly reduces to MMSE [e.g., Chandrasekeraand Cheung, 1997],r 2 8 0 ðx; yÞþ r CC gCC gr8 0 ðx; yÞhþ k0 2 þ f 1r 2 h þ f 2 ðrhÞ 2i8 0 ðx; yÞ ¼ 0; ð8Þwhere f 1 = f 1 (x, y) and f 2 = f 2 (x, y) are respectively functionsdependent on the bottom curvature and slope-squared terms.From equation (7), the MSE is obtained by furtherneglecting the curvature and slope-squared terms.[13] In the following sections, these two formulations(MSE and MMSE) will be compared to the full 5-modemodel to examine the importance <strong>of</strong> steep bottom slopeeffects, which are fully accounted for in this model. TheMSE and MMSE solutions are obtained by exactly the samescattering method described above with the same computercode in which the high-order bottom slope terms and/orevanescent modes are turned <strong>of</strong>f. For 3D calculations, ouruse <strong>of</strong> a regular grid sets important constraints on the modelimplementation owing to the requirements to have the<strong>of</strong>fshore boundary in deep water and sufficient resolutionto resolve the wavelength <strong>of</strong> <strong>waves</strong> in the shallowest parts<strong>of</strong> the model domain. These constraints put practicallimits on the domain size for a given wave period andrange <strong>of</strong> water depths. Here a minimum <strong>of</strong> 7 points perwavelength in 10 m depth was enforced, in a domain thatextends 4–6 km <strong>of</strong>fshore. Such a large domain with a highresolution leads to memory intensive inversion <strong>of</strong> largesparse matrices. However, the NTUA, MSE and MMSEmodels are linear, and thus the propagation <strong>of</strong> the different<strong>of</strong>fshore wave components can be performed separately,sequentially or in parallel.[14] Before considering the full complexity <strong>of</strong> the 3DScripps-La Jolla Canyon system, we first examine thebehavior <strong>of</strong> these models in the case <strong>of</strong> monochromatic<strong>waves</strong> propagating <strong>over</strong> 2D idealized <strong>canyon</strong> pr<strong>of</strong>iles(transverse sections <strong>of</strong> the actual <strong>canyon</strong>s). We considerboth the relatively wide La Jolla Canyon where infra<strong>gravity</strong>wave reflection was reported recently [Thomson et al.,2005], and the narrow Scripps Canyon, that was the focus<strong>of</strong> the NCEX swell propagation study.3. Idealized 2D Canyon Pr<strong>of</strong>iles3.1. Transverse Section <strong>of</strong> La Jolla Canyon[15] We investigate monochromatic <strong>waves</strong> propagating atnormal incidence <strong>over</strong> a transverse section <strong>of</strong> the La Jolla3<strong>of</strong>12
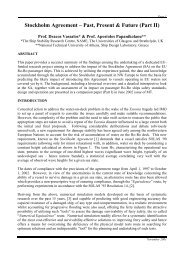
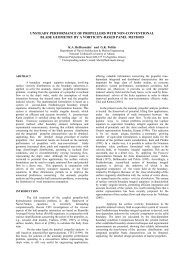
C01002MAGNE ET AL.: WAVES OVER SUBMARINE CANYONSC01002Figure 1. Bathymetry around La Jolla and Scripps<strong>canyon</strong>s, and definition <strong>of</strong> transverse sections for idealizedcalculations.Canyon (Figures 1 and 2), which is relatively deep (120 m)and wide (350 m). Oblique incidence will not be consideredfor this <strong>canyon</strong> because the results are similar to thoseobtained for Scripps Canyon (discussed below). Reflectioncoefficients R for the wave amplitude are computed usingthe MSE, the MMSE, and the full coupled-mode modelNTUA5. R is easily obtained using the natural decompositionprovided by the scattering method, and is defined as theratio between the scattered wave potential amplitude, upwave<strong>of</strong> the topography, and the amplitude <strong>of</strong> the imposedpropagating wave. In addition, a stepwise bottom approximationmodel developed by Rey [1992], based on thematching <strong>of</strong> integral quantities at the boundaries <strong>of</strong> adjacentsteps, is used to evaluate R [see Takano, 1960; Miles, 1967;Kirby and Dalrymple, 1983]. This model is known toconverge to the exact value <strong>of</strong> R, and will be used as abenchmark for this study. The <strong>canyon</strong> pr<strong>of</strong>ile is resolvedFigure 2.Water depth across the La Jolla <strong>canyon</strong> section.Figure 3. Amplitude reflection coefficient R for <strong>waves</strong>propagating at normal incidence <strong>over</strong> the La Jolla <strong>canyon</strong>section (Figure 2) using several numerical models, andobserved infra<strong>gravity</strong> reflections for near-normal incidenceangles [Thomson et al., 2005].with 70 steps which was found to be sufficient to obtain aconverging result. The predicted values <strong>of</strong> R as a function <strong>of</strong>wave frequency f (Figure 3), are characterized by maximaand minima, which are similar to the rectangular stepresponse shown by Mei and Black [1969], Kirby andDalrymple [1983], and Rey et al. [1992]. The spacingbetween the minima or maxima is defined by the width <strong>of</strong>the step or trench, which imposes resonance conditions,leading to constructive or destructive interferences. Both theMSE and MMSE models are found to generally <strong>over</strong>estimatethe reflection at high frequencies, whereas the NTUA5model is in good agreement with the benchmark solution.The sloping-bottom mode included in NTUA5 has a negligibleimpact on the wave reflection in this and other casesdiscussed below. The only other difference between theNTUA5 and the MMSE models is the addition <strong>of</strong> theevanescent modes which, through their effect on the nearwave field solution modify significantly the far field,including the <strong>over</strong>all reflection and transmission <strong>over</strong> the<strong>canyon</strong>.[16] Thomson et al. [2005] investigated the transmission<strong>of</strong> infra-<strong>gravity</strong> <strong>waves</strong> with frequencies in the range 0.006–0.05 Hz across this same <strong>canyon</strong>. On the basis <strong>of</strong> pressureand velocity time series at two points located approximatelyat the ends <strong>of</strong> the La Jolla section these authors estimatedenergy reflection coefficients as a function <strong>of</strong> frequency. Ina case <strong>of</strong> near-normal incidence they observed a minimum<strong>of</strong> wave reflection at about 0.04 Hz, generally consistentwith the present results (Figure 3). Thomson et al. [2005]further found a good fit <strong>of</strong> their observations to thetheoretical reflection across a rectangular trench as givenby Kirby and Dalrymple [1983] in the limit <strong>of</strong> long <strong>waves</strong>,and neglecting evanescent modes. This approximation isappropriate for the long infra<strong>gravity</strong> band for which theeffects <strong>of</strong> evanescent modes are relatively weak. Theobservations <strong>of</strong> Thomson et al. [2005] also agree well with4<strong>of</strong>12
C01002MAGNE ET AL.: WAVES OVER SUBMARINE CANYONSC01002Figure 4.Water depth across the Scripps <strong>canyon</strong> section.the various models applied here to the actual <strong>canyon</strong> pr<strong>of</strong>ile(Figure 3). At higher swell frequencies (f > 0.05 Hz), theMSE, MMSE and NTUA model results diverge for normalincidence (Figure 3). However, contrary to the beachgeneratedinfra<strong>gravity</strong> <strong>waves</strong>, swell arrives from the openocean and thus always reaches this <strong>canyon</strong> with a largeoblique angle, for which the differences between thesemodels are small (not shown).3.2. Transverse Section <strong>of</strong> Scripps Canyon3.2.1. Normal Incidence[17] The north branch <strong>of</strong> the <strong>canyon</strong> system, ScrippsCanyon, provides a very different effect due to a largerdepth (145 m) and a smaller width (250 m). Scripps Canyonis also markedly asymmetric with different depths on eitherside. A representative section <strong>of</strong> this <strong>canyon</strong> is chosen here(Figure 4). The bottom slope locally exceeds 3; that is, thebottom makes an angle up to 70° with the vertical. Reflectioncoefficient predictions for <strong>waves</strong> propagating atnormal incidence <strong>over</strong> the <strong>canyon</strong> section are shown inFigure 5. R decreases with increasing frequency without thepronounced side lobe pattern predicted for the La JollaCanyon section. Again, the NTUA5 results are in excellentagreement with the exact solution. The MSE dramaticallyunderestimates R at low frequencies, and <strong>over</strong>estimates R athigh frequencies. However, the MMSE is in fairly goodagreement with the benchmark solution in this case, suggestingthat the higher order bottom slope terms are importantfor the steep Scripps Canyon pr<strong>of</strong>ile reflection, whilethe evanescent modes play only a minor role.3.2.2. Oblique Incidence[18] The swell observed near Scripps Canyon generallyarrives at a large oblique angle at the <strong>of</strong>fshore <strong>canyon</strong> rim.To examine the influence <strong>of</strong> the incidence angle q i , arepresentative swell frequency f = 0.067 Hz was selected,and the reflection coefficient was evaluated as a function <strong>of</strong>q i . The amplitude reflection coefficient R is very weak whenq i is small, and as q i increases, R jumps to near-totalreflection within a narrow band <strong>of</strong> direction around 35°(Figure 6). Indeed, for a wave train propagating through amedium with phase speed gradient in one dimensiononly, geometrical optics predicts that beyond a threshold(Brewster) angle q B , all the wave energy is trapped, and noenergy goes through the <strong>canyon</strong>. This sharp transition doesFigure 5. Reflection coefficient for the Scripps Canyonsection as a function <strong>of</strong> frequency predicted by variousmodels. (a) Normal incidence q i =0°; (b)q i =45°. Allmodels collapse on the same curve in Figure 5b.Figure 6. Reflection coefficient for <strong>waves</strong> <strong>of</strong> period T =16 s propagating <strong>over</strong> the Scripps Canyon section as afunction <strong>of</strong> the wave incidence angle q i (0 corresponds to<strong>waves</strong> traveling perpendicular to the <strong>canyon</strong> axis).5<strong>of</strong>12
C01002MAGNE ET AL.: WAVES OVER SUBMARINE CANYONSC01002not depend on the magnitude <strong>of</strong> the gradient which mayeven be infinite. For a shelf depth H 1 and maximum <strong>canyon</strong>depth H max , this threshold angle is given byq B ¼ arcsinC 1C max; ð9Þwhere C 1 and C max are the phase speeds for a givenfrequency corresponding to the depths H 1 and H max . Thusq B increases with increasing frequency as the phase speeddifference diminishes at high frequencies. For ScrippsCanyon, H 1 = 24 m, and H max = 145 m. At f = 0.067 Hz thisgives q B =38°. As a result, for q i < q B , no reflection ispredicted by refraction theory (dashed line), and all thewave energy is transmitted through the <strong>canyon</strong>. Thisthreshold value separates distinct reflection and refraction(trapping) phenomena, respectively occurring for q i < q Band q i > q B .[19] The elliptic models that account for diffraction predicta smoother transition. For q i < q B , weak reflection ispredicted. For q i > q B , a fraction <strong>of</strong> the energy is stilltransmitted through the <strong>canyon</strong>. This transmission <strong>of</strong> waveenergy across a deep region where sin q i /C 1 exceeds 1/C max ,violates the geometrical optics approximation. This transmissionis similar to the tunneling <strong>of</strong> quantum particlesthrough a barrier <strong>of</strong> potential in the case where the barrierthickness is <strong>of</strong> the order <strong>of</strong> the wavelength or less [Thomsonet al., 2005]. The wave field near the turning point <strong>of</strong> waverays in the <strong>canyon</strong> decays exponentially in space on thescale <strong>of</strong> the wavelength [e.g., Chao and Pierson, 1972], andthat decaying wave excites a propagating wave on the otherside <strong>of</strong> the <strong>canyon</strong>. This coupling <strong>of</strong> both <strong>canyon</strong> sidesgenerally decreases as the <strong>canyon</strong> width or the incidenceangle increase [Kirby and Dalrymple, 1983; Thomson etal., 2005]. The significant differences between MSEand MMSE at small angles q i < q B are less pronouncedfor q i > q B .[20] These two regimes are illustrated by the evolution <strong>of</strong>the wave potential amplitude <strong>over</strong> the Scripps <strong>canyon</strong> section.In Figure 7, results <strong>of</strong> various elliptic models (MSE,MMSE and NTUA5) are compared with a parabolic approximation<strong>of</strong> the MSE (the REF/DIF1 model <strong>of</strong> Dalrympleand Kirby [1988]). It should be noted that the model gridorientation is chosen with the main axis along the incidentwave propagation direction, in order to minimize largeangle errors in the parabolic approximation. In that configuration,the parabolic approximation (REF/DIF1_a)does not predict any reflection, but gives an indication<strong>of</strong> the expected shoaling <strong>of</strong> the incident <strong>waves</strong> across the<strong>canyon</strong>. For q i =30° < q B , weak reflection (about 10%) ispredicted by the MMSE and NTUA5 (Figure 7a). MSEconsiderably <strong>over</strong>estimates the reflection, and thus underestimatesthe transmitted energy down-wave <strong>of</strong> the <strong>canyon</strong>section. A partial standing wave pattern is predicted upwave<strong>of</strong> the <strong>canyon</strong> as a result <strong>of</strong> the interference <strong>of</strong>incident and reflected <strong>waves</strong>. The largest amplitudes, about20% larger than the incident wave amplitude, occur in thefirst antinode near the <strong>canyon</strong> wall.[21] For a larger wave incidence angle (e.g., 45° > q B ), analmost complete standing wave pattern is predicted by theelliptic models up-wave <strong>of</strong> the <strong>canyon</strong>, with an exponentialtail that extends across the <strong>canyon</strong> to a weak transmittedFigure 7. Wave amplitude <strong>over</strong> the Scripps Canyonsection, for T = 16 s and different incident angles (a) q i =30°, (b)q i =45°, and (c) q i =70°. The <strong>canyon</strong> depth pr<strong>of</strong>ileis indicated with a thin dashed line. The MMSE result isindistinguishable from that <strong>of</strong> NTUA5 in all plots, and allmodels except for REF/DIF1 give the same results inFigures 7b and 7c.component (see also Figure 5b for the reflection coefficientpattern). Finally, transmission is extremely weak for q i =70°(Figure 7c). A good estimate <strong>of</strong> the reflection coefficientcan also be obtained with the parabolic model REF/DIF1_bby choosing the x-axis to be aligned with the <strong>canyon</strong> trench(Figures 7b and 7c, thick dashed lines).4. West Swell Over Scripps Canyon[22] The models used in the previous section (MSE,MMSE, NTUA5, REF/DIF1, refraction) are now applied6<strong>of</strong>12
C01002MAGNE ET AL.: WAVES OVER SUBMARINE CANYONSC01002Figure 12. Amplitude transfer functions at (a) site 37 and (b) site 34, defined as the ratio <strong>of</strong> the localand <strong>of</strong>fshore wave amplitude modulus and computed with NTUA 5.150 m, that is less than the 216 m wavelength at the peakfrequency (at the shallowest <strong>of</strong> the two sites). Such a patternis generally consistent with refraction theory as illustratedby forward ray-tracing in Figure 9. Whereas rays crossingthe shelf north <strong>of</strong> the <strong>canyon</strong> show the expected gradualbending toward the shore, rays that reach the <strong>canyon</strong>northern wall are trapped on the shelf, and reach the shorein a focusing region north <strong>of</strong> the <strong>canyon</strong> (Black’s beach).From that <strong>of</strong>fshore direction, and an <strong>of</strong>fshore ray spacing <strong>of</strong>15 m, no rays are predicted to cross the <strong>canyon</strong>, so that thesouth side <strong>of</strong> the <strong>canyon</strong> is effectively sheltered from 16 sWesterly swells, in agreement with the observed extremelylow wave heights (Figure 11) [see also Peak, 2004]. Theamplitude transfer functions (M(f, q) 1/2 ) are not <strong>over</strong>lysensitive to the wave frequency and direction, as illustratedin Figures 12a and 12b with NTUA5 predictions at sites 34at the head <strong>of</strong> the <strong>canyon</strong>, and 37 behind the <strong>canyon</strong>.[29] Up-wave <strong>of</strong> the <strong>canyon</strong> (instruments 33, 34, 35), allmodels are found to be in fairly good agreement with theobservations. However, REF/DIF1 underestimates the waveheight at site 34. At this site, wave energy is stronglyfocused by refraction, with rays turning by more that 90°(Figure 9). The parabolic approximation does not allowsuch a large variation in wave direction. Over and downwave<strong>of</strong> the <strong>canyon</strong> (instruments 32, 36, 37), the waveheights predicted by MSE, MMSE and NTUA5 agreereasonably well with the observations, whereas REF/DIF1slightly <strong>over</strong>estimates the wave height. For f
C01002MAGNE ET AL.: WAVES OVER SUBMARINE CANYONSC01002Figure 14. Directional wave spectrum at Torrey PinesOuter Buoy at 12:00 UTC on 12 December 2003.Figure 13. Comparison <strong>of</strong> predicted and observedfrequency spectra at (a) site 35 and (b) site 37 for the30 November 2003 swell event.<strong>canyon</strong> is reduced by diffraction, which is not taken intoaccount in this refraction model, resulting in an underprediction<strong>of</strong> the wave height at the sheltered sites 32, 36,and 37.[30] The sea state at that time also include an importantcontribution from higher frequencies (Figure 13). Significantwave heights computed <strong>over</strong> a wider frequency range(0.05 < f < 0.2 Hz), by adding the refraction model results tothe low-frequency results <strong>of</strong> other models, vary little betweenthe models, now dominated by short wave energy.However, wave heights are still markedly different betweenthe buoys. It thus appears that refraction plays an importantrole for frequencies up to 0.14 Hz (see the difference in<strong>of</strong>fshore and local spectra on Figure 13), while diffractioneffects are significant, in that area, only up to 0.07 Hz.Further confirmation <strong>of</strong> the trapping <strong>of</strong> low-frequency<strong>waves</strong> is provided by another case observed on 12 December2003 (Figure 14), which we analyze with the same method.The observed spectra are averaged from 12:00 UTC to15:00 UTC.The observed spectrum has three peaks with aperiod <strong>of</strong> 20, 12.5 and 9 s, a mean direction <strong>of</strong> 270, 270and 285 degrees respectively and a significant wave height<strong>of</strong> 1.9 m. The model hindcasts are compared with observationsin Figure 15. Significant wave heights H s werecomputed from the measured and predicted wave spectra ateach instrument location, including only the commonlymodeled frequency range (f 1 = 0.05 Hz, f 2 = 0.08 Hz).On that day the wind speed did not exceed 7 m s 1 ,asmeasured by the CDIP Torrey Pines Glider port anemometer,but reached 13.5 m, blowing from the North West, atNDBC buoy 46086. Such a wind is capable <strong>of</strong> generating alocal wave field with frequencies down to 0.095 Hz forfully-developed wave conditions.[31] As in the previous case, a large variation in waveheight was observed across the Canyon (Figure 15). Again,that variation remains limited to a factor 10 difference forany wave frequency (compare Figures 16a and 16b),whereas the geometrical optics approximation predictsmuch larger gradients. We note a general agreement <strong>of</strong> theFigure 15. Comparison <strong>of</strong> predicted and observed significantwave height (12 s < T < 22 s) for the 12 December2003 swell event. Instrument locations are shown in Figure 9.10 <strong>of</strong> 12
C01002MAGNE ET AL.: WAVES OVER SUBMARINE CANYONSC01002the <strong>canyon</strong>, these propagation models are not reliable forf > 0.095 Hz.[32] In the two events, most <strong>of</strong> the wave evolution isaccounted for by refraction. However, diffraction is includedin the models on the basis <strong>of</strong> the MSE and its extensions,and this effect allows for a tunneling <strong>of</strong> wave energy acrossthe <strong>canyon</strong>. In these models, wave heights across the<strong>canyon</strong> are thus larger, in better agreement with observedwave heights and wave spectra at the sheltered sites 32, 36and 37 (Figures 11, 13, and 15).[33] The differences between NTUA5, MSE and MMSEmodel predictions are very small and thus only NTUA5results are shown in Figure 13. It may appear surprising thatthe wave height behind the <strong>canyon</strong> is still 20% <strong>of</strong> the<strong>of</strong>fshore wave height whereas the 2D simulations withcomparable incidence angles yield wave heights much lessthan 5%. However, the Scripps Canyon is neither infinitelylong nor uniform along its axis. The three-dimensionaltopography apparently reduces the blocking effect <strong>of</strong> longperiod swells that was found <strong>over</strong> two-dimensional <strong>canyon</strong>s.Figure 16. Comparison <strong>of</strong> predicted and observed frequencyspectra at (a) site 35 and (b) site 37 for the 12December 2003 swell event.predicted wave height by the models, with an underestimation<strong>of</strong> the refraction model for sites located down-wave <strong>of</strong>the Canyon. The predicted frequency spectra are representedon Figures 16a and 16b at sites 35 and 37. At site35, located up-wave <strong>of</strong> the Canyon wall, NTUA5 and REF/DIF1 models are in a good agreement with the measurementfor the low-frequency peak (0.05 Hz), but underestimate the0.08 Hz peak. The refraction model <strong>over</strong>estimates the lowfrequencypeak, but is in good agreement with the 0.08 Hzpeak. At site 37, located down-wave <strong>of</strong> the Canyon,NTUA5 and REF/DIF1 predict a strongly attenuated lowfrequencypeak, as is observed, whereas the refractionmodel predicts no energy transmission across the <strong>canyon</strong>.Below a cut-<strong>of</strong>f frequency <strong>of</strong> about 0.065 Hz, the <strong>canyon</strong>acts as a complete barrier in the geometrical optics approximation.The energy in the second peak at 0.08 Hz is onlyreduced by a factor 4 across the <strong>canyon</strong>, an effect welldescribed by all models, and thus attributable to refraction.All models generally agree with the observations for 0.07
C01002MAGNE ET AL.: WAVES OVER SUBMARINE CANYONSC01002amplitude, and induces a leakage <strong>of</strong> wave energy in areasforbidden by geometrical optics.[36] Observations were also compared with a parabolicrefraction-diffraction model that is known to be inaccuratefor large oblique wave directions relative to the numericalgrid, and is shown here to <strong>over</strong>estimate the amplitude <strong>of</strong><strong>waves</strong> transmitted across the <strong>canyon</strong> and underestimate theamplitude <strong>of</strong> <strong>waves</strong> focused at the head <strong>of</strong> the <strong>canyon</strong>.Finally, depending on the bottom pr<strong>of</strong>ile and incidenceangle, higher-order bottom slope and curvature terms(incorporated in modified mild slope equations andNTUA5), as well as evanescent and sloping-bottom modes(included in NTUA5) can be important for an accuraterepresentation <strong>of</strong> wave propagation <strong>over</strong> a <strong>canyon</strong> at smallincidence angles. For large incidence angles, that are morecommon for natural <strong>canyon</strong>s across the shelf break, thestandard mild slope equation (MSE) gives an accuraterepresentation <strong>of</strong> the variations in <strong>surface</strong> elevation spectrathat is similar to that <strong>of</strong> the full NTUA5 model. Yet, furtheranalysis <strong>of</strong> NCEX bottom velocity and pressure measurementsmay show that the MSE or other mild slope modelsmay not accurately represent near bottom wave properties,as also discussed by Athanassoulis et al. [2003].[37] Acknowledgments. The authors acknowledge the Office <strong>of</strong>Naval Research (Coastal Geosciences Program) and the National ScienceFoundation (Physical Oceanography Program) for their financial support <strong>of</strong>the Nearshore Canyon Experiment. Steve Elgar provided bathymetry data,Julie Thomas and the staff <strong>of</strong> the Scripps Institution <strong>of</strong> Oceanographydeployed the wave buoys, and Paul Jessen, Scott Peak, and Mark Orzechassisted with the data processing. Analysis results <strong>of</strong> the infra<strong>gravity</strong> wavereflections across La Jolla Canyon were kindly provided by Jim Thomson.R. Magne acknowledges NPS and LSEET for acting as hosts <strong>over</strong> a longperiod. The authors also acknowledge anonymous referees for their usefulcomments and suggestions.ReferencesArdhuin, F., T. H. C. Herbers, and W. C. O’Reilly (2001), A hybrid Eulerian-Lagrangian model for spectral wave evolution with application to bottomfriction on the continental shelf, J. Phys. Oceanogr., 31, 1498–1516.Ardhuin, F., T. H. C. Herbers, W. C. O’Reilly, and P. F. Jessen (2003), Swelltransformation across the continental shelf. part II: Validation <strong>of</strong> a spectralenergy balance equation, J. Phys. Oceanogr., 33, 1940–1953.Athanassoulis, G. A., and K. A. Belibassakis (1999), A consistent coupledmodetheory for the propagation <strong>of</strong> small amplitude water <strong>waves</strong> <strong>over</strong>variable bathymetry regions, J. Fluid Mech., 389, 275–301.Athanassoulis, G. A., K. A. Belibassakis, and Y. G. Georgiou (2003),Transformation <strong>of</strong> the point spectrum <strong>over</strong> variable bathymetry regions,in Proceedings <strong>of</strong> the 15th International Polar and Offshore EngineeringConference, Honolulu, Hawaii, vol. 3, edited by J. S. Chung et al.,pp. 58–65, ISOPE Publ., Honolulu, Hawaii.Belibassakis, K. A., G. A. Athanassoulis, and T. P. Gerostathis (2001), Acoupled-mode model for the refraction-diffraction <strong>of</strong> linear <strong>waves</strong> <strong>over</strong>steep three-dimensional bathymetry, Appl. Ocean Res., 23, 319–336.Berkh<strong>of</strong>f, J. C. W. (1972), Computation <strong>of</strong> combined refraction-diffraction,in Proceedings <strong>of</strong> the 13th International Conference on Coastal Engineering,pp. 796–814, Am. Soc. <strong>of</strong> Civ. Eng., New York.Booij, N. (1983), A note on the accuracy <strong>of</strong> the mild-slope equation, CoastalEng., 7, 191–203.Booij, N., R. C. Ris, and L. H. Holthuijsen (1999), A third-generationwave model for coastal regions: 1. Model description and validation,J. Geophys. Res., 104, 7649–7666.Chamberlain, P. G., and D. Porter (1995), The modified mild slope equation,J. Fluid Mech., 291, 393–407.Chandrasekera, C. N., and K. F. Cheung (1997), Extended linear refractiondiffractionmodel, J. Waterw. Port Coastal Ocean Eng., 123, 280–286.Chandrasekera, C. N., and K. F. Cheung (2001), Linear refraction-diffractionmodel for steep bathymetry, J. Waterw. Port Coastal Ocean Eng.,127, 161–170.Chao, Y.-Y., and W. J. Pierson (1972), Experimental studies <strong>of</strong> the refraction<strong>of</strong> uniform wave trains and transient wave groups near a straightcaustic, J. Geophys. Res., 77, 4545–4553.Dalrymple, R. A., and J. T. Kirby (1988), Models for very wide-angle water<strong>waves</strong> and wave diffraction, J. Fluid Mech., 192, 33–50.Dobson, R. S. (1967), Some applications <strong>of</strong> a digital computer to hydraulicengineering problems, Tech. Rep. 80, Dep. <strong>of</strong> Civ. Eng., Stanford Univ.,Calif.Gerosthathis, T., K. A. Belibassakis, and G. Athanassoulis (2005), Coupledmode,phase-resolving model for the transformation <strong>of</strong> wave spectrum<strong>over</strong> steep 3D topography: A parallel-architecture implementation, paperpresented at OMAE 2005 24th International Conference on OffshoreMechanics and Arctic Engineering, Am. Soc. <strong>of</strong> Mech. Eng., Halkidiki,Greece.Kim, J. W., and K. J. Bai (2004), A new complementary mild slope equation,J. Fluid Mech., 511, 25–40.Kirby, J. T. (1986), Higher-order approximations in the parabolic equationmethod for water <strong>waves</strong>, J. Geophys. Res., 91, 933–952.Kirby, J. T., and R. A. Dalrymple (1983), Propagation <strong>of</strong> obliquely incidentwater <strong>waves</strong> <strong>over</strong> a trench, J. Fluid Mech., 133, 47–63.Lee, C., and S. B. Yoon (2004), Effect <strong>of</strong> higher-order bottom variationterms on the refraction <strong>of</strong> water <strong>waves</strong> in the extended mild slope equation,Ocean Eng., 31, 865–882.Longuet-Higgins, M. S. (1957), On the transformation <strong>of</strong> a continuousspectrum by refraction, Proc. Cambridge Philos. Soc., 53, 226–229.Lygre, A., and H. E. Krogstad (1986), Maximum entropy estimation <strong>of</strong> thedirectional distribution in ocean wave spectra, J. Phys. Oceanogr., 16,2052–2060.Massel, S. R. (1993), Extended refraction-diffraction equation for <strong>surface</strong><strong>waves</strong>, Coastal Eng., 19, 97–126.Mei, C. C. (1989), Applied Dynamics <strong>of</strong> Ocean Surface Waves, 2nd ed., 740pp., World Sci., Hackensack, N. J.Mei, C. C., and J. L. Black (1969), Scattering <strong>of</strong> <strong>surface</strong> <strong>waves</strong> by rectangularobstacles in water <strong>of</strong> finite depth, J. Fluid Mech., 38, 499–515.Miles, J. W. (1967), Surface wave scattering matrix for a shelf, J. FluidMech., 28, 755–767.Munk, W. H., and M. A. Traylor (1947), Refraction <strong>of</strong> ocean <strong>waves</strong>: Aprocess linking underwater topography to beach erosion, J. Geol., 55, 1–26.O’Reilly, W. C., and R. T. Guza (1991), Comparison <strong>of</strong> spectral refractionand refraction-diffraction wave models, J. Waterw. Port Coastal OceanEng., 117, 199–215.O’Reilly, W. C., and R. T. Guza (1993), A comparison <strong>of</strong> two spectral wavemodels in the Southern California Bight, Coastal Eng., 19, 263–282.Peak, S. D. (2004), Wave refraction <strong>over</strong> complex nearshore bathymetry,M.S. thesis, Naval Postgrad. School, Monterey, Calif.Porter, D., and D. J. Staziker (1995), Extensions <strong>of</strong> the mild-slope equation,J. Fluid Mech., 300, 367–382.Radder, A. C. (1979), On the parabolic equation method for water wavepropagation, J. Fluid Mech., 95, 159–176.Rey, V. (1992), Propagation and local behaviour <strong>of</strong> normally incident <strong>gravity</strong><strong>waves</strong> <strong>over</strong> varying topography, Eur. J. Mech. B Fluids, 11, 213–232.Rey, V., M. Belzons, and E. Guazzelli (1992), Propagation <strong>of</strong> <strong>surface</strong> <strong>gravity</strong><strong>waves</strong> <strong>over</strong> a rectangular submerged bar, J. Fluid Mech., 235, 453–479.Takano, K. (1960), Effets d’un obstacle parallélépipédique sur la propagationde la houle, La houille blanche, 15, 247–267.Thomson, J., S. Elgar, and T. H. C. Herbers (2005), Reflection and tunneling<strong>of</strong> ocean <strong>waves</strong> observed at a <strong>submarine</strong> <strong>canyon</strong>, Geophys. Res. Lett.,32, L10602, doi:10.1029/2005GL022834.F. Ardhuin and R. Magne, Centre Militaire d’Océanographie, ServiceHydrographique et Océanographique de la Marine, 29609 Brest, France.(ardhuin@shom.fr; rudy.magne@shom.fr)K. A. Belibassakis, Department <strong>of</strong> Naval Architecture and MarineEngineering, National Technical University <strong>of</strong> Athens, PO Box 64033Zografos, 15710 Athens, Greece. (kbel@fluid.mech.ntua.gr)T. H. C. Herbers, Department <strong>of</strong> Oceanography, Naval PostgraduateSchool, Monterey, CA 93943, USA. (thherber@nps.edu)W. C. O’Reilly, Integrative Oceanography Division, Scripps Institution <strong>of</strong>Oceanography, La Jolla, CA 92093, USA.V. Rey, Option Ingénierie Marine, Institut des Sciences de l’Ingénieur deToulon et du Var, Avenue Georges Pompidou, BP 56, F-83162 La Valettedu Var, France. (rey@univ-tln.fr)12 <strong>of</strong> 12