
You also want an ePaper? Increase the reach of your titles
YUMPU automatically turns print PDFs into web optimized ePapers that Google loves.
Driven
y the Power of PartnershipNJVC’s commitment to the Intelligence Community, Departmentof Defense, and the geospatial intelligence community at-large isunwavering. As one of the top 20 IT contractors in DoD and thelargest information technology provider to the NSG community,NJVC is deeply engaged with the global GEOINT mission. Our servicesolutions are optimized to advance the GEOINT tradecraft. We areproud of our history of leadership to this community and the criticalmission that we support.Driven by Your Mission www.njvc.com
SOCET GXP ® SOFTWARE.TMEXPERIENCE THE POWER OF EXTREME ANALYSIS.Experience the power of real-time imageanalysis, automated geospatial production,mapping, and 3-D visualization — all in asingle application. SOCET GXP®enablesinteroperability and collaboration amongusers and decision-makers at all levels, andits intuitive, customizable interface providesdirect access to shared databases andextended capabilities. Image and geospatialanalysis — together for the first time in onepowerful tool. This is just one of the waysBAE Systems delivers real advantage.www.baesystems.com/gxp
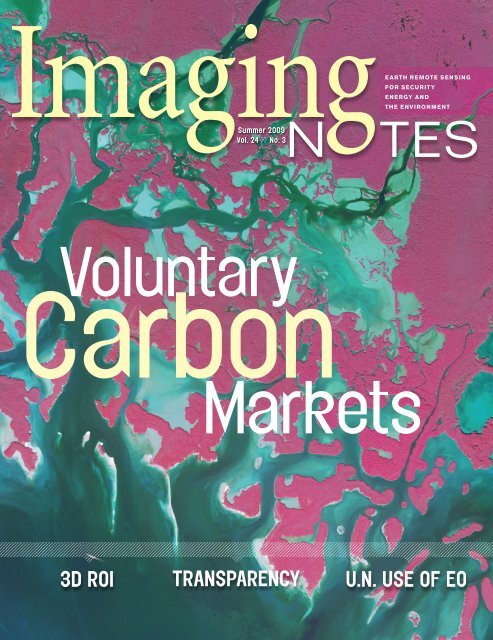
Summer 2009contents26> > columns9101416Publisher’s LetterLBx Journal Launches!By Myrna James YooSecure WorldFoundation ForumCapacity Buildingand the U.N.By Ray Williamson, PhD, EditorNext-Gen MappingThe Effect ofTransparencyon BusinessBy Natasha Légerand Craig BachmannEarth ScopeThermal InfraredApplicationsBy Tim Foresman, PhD> > features182026GeoWeb101 WorkshopConferencein VancouverVoluntary CarbonMarketsManagement ofKyoto-ComplianceBy Anna Burzykowska, ESAWater ModelingMapping & ManagementBy Rod Franklin, Reporter2221955812962545210912 26113636 511821011 849 2512 322632759 31111730 EducationCertification andLicensureBy Karen Nozik, Reporter35X, Y and Z3D Ties to ROIBy Rod Franklin, Reporter26145310261227264310Non-U.S. / CAN: 1554203035imaging notes // summer 2009 // www.imagingnotes.com5
South Floridafrom the Aircover imageSummer 2009 / Vol. 24 / No. 3Our Mission<strong>Imaging</strong> <strong>Notes</strong> is the premier publication for commercial, government and academicremote sensing professionals around the world. It provides objective exclusive in-depthreporting that demonstrates how remote sensing technologies and spatial informationilluminate the urgent interrelated issues of the environment, energy and security.<strong>Imaging</strong> <strong>Notes</strong> has a partnershipwith Secure World Foundation(www.secureworldfoundation.org).<strong>Imaging</strong> <strong>Notes</strong> is affiliated with theAlliance for Earth Observations, aprogram of The Institute for GlobalEnvironmental Strategies(www.strategies.org).This color infra-redorthoimage of the Royal Palm Hammockquadrangle is located a few miles west of theEverglades National Park, in Collier County on theGulf coast of Florida. The image was collected ata 1-meter pixel resolution in December 2004,using a Leica ADS40 airborne digital imagingsensor, as part of the statewide mapping programfor Florida covering approximately 54,000 squaremiles. This image is provided courtesy of theSouth Florida Water Management District and theUSGS. It was acquired and processed by FugroEarthData.This program was sponsored by an allianceof the state’s water management districtsand the USGS. At the time, it was one of thenation’s first large-scale acquisition efforts thattook advantage of the ADS40 sensor’s abilityto generate both natural color and false colorrenditions simultaneously. To accommodate thefull range of data products requested, a total16,800 individual map tiles were produced. Atotal of more than 3 terabytes of image data weredelivered to the USGS and the five water managementdistricts.The water modeling article on page 26includes this project.Publisher/Managing editorMyrna James Yoomyrna@imagingnotes.comEditorRay A. Williamson, PhDray@imagingnotes.comCopy EditorBette MillesonAdvertising DirectorColleen GormleyCreative DirectorJürgen MantzkeEnfineitz LLCjurgen@enfineitz.comwww.enfineitz.comDeputy Art DirectorAndrew SternardEditorial ContributionsEditorial Advisory BoardMark E. Brender, GeoEyeNancy ColletonInstitute for GlobalEnvironmental StrategiesTimothy W. Foresman, PhDInternational Centre for RemoteSensing EducationWilliam B. Gail, PhDMicrosoft Virtual EarthAnne Hale MiglareseBooz Allen HamiltonKevin Pomfret, Esq.Cantor Arkema, P.C.<strong>Imaging</strong> <strong>Notes</strong> welcomes contributions for feature articles. We publish articles on the remotesensing industry, including applications, technology, and business. Please see Contributor’sGuidelines on www.imagingnotes.com, and email proposals to editor@imagingnotes.com.SubscriptionsTo subscribe or renew, please go to www.imagingnotes.com, and click on ‘subscribe.’If you are a current subscriber, renew by locating your accountnumber on your address label to enter the database and update your subscription.If you cannot go online, you may write to the address below.<strong>Imaging</strong> <strong>Notes</strong> (ISSN 0896-7091) Copyright © 2009Blueline Publishing LLCP.O. Box 11569, Denver, CO 80211303-477-5272All rights reserved. No material may be reproduced or transmitted in any form or by any meanswithout written permission from the publisher. While every precaution is taken to ensureaccuracy, the publisher and the Alliance for Earth Observations cannot accept responsibilityfor the accuracy of information or for any opinions or views presented in <strong>Imaging</strong> <strong>Notes</strong>.Although trademark and copyright symbols are not used in this publication, they are honored.<strong>Imaging</strong> <strong>Notes</strong> is printed on 20% recycled (10% post-consumer waste) paper.All inks used contain a percentage of soy base. Our printer meets orexceeds all federal Resource Conservation Recovery Act (RCRA) Standards.6imaging notes // summer 2009 // www.imagingnotes.com
Maximize the Value of Your ImageryQuickly get imagery to people who need it with the ArcGIS ®Server Image extension.“When we tested ArcGIS ServerImage extension, we found designers,technicians, and digitizers were all verypleased with the processingtime. It was twice as fast, insome cases even faster,than previous systems.”The ArcGIS ® Server Image extension helps organizations managelarge catalogs of rasters and imagery to make imagery available tomore people in less time. Dynamic mosaicking and on-the-fly imageprocessing allow users to quickly serve multiple imagery productsfrom one set of source imagery, reducing data redundancy andstorage requirements.Cindi SalasGIS ManagerCenterPoint EnergyFor more information, visit www.esri.com/imageor call 1-888-373-1353.For ESRI locations worldwide, visitwww.esri.com/distributors.Copyright © 2008 ESRI. All rights reserved. The ESRI globe logo, ESRI, ArcGIS, ESRI—The GIS Company, www.esri.com, and @esri.com are trademarks, registered trademarks, or service marks of ESRI in theUnited States, the European Community, or certain other jurisdictions. Other companies and products mentioned herein may be trademarks or registered trademarks of their respective trademark owners.
Dear Remote Sensing Professionals,The <strong>Imaging</strong> <strong>Notes</strong> team is thrilled to provide you with a complimentary copyof our launch issue of our spin-off publication, LBx Journal: Location in the Language ofBusiness. Enjoy this copy, and pass it along to someone who is the ideal reader: Businessleaders who are exploring the untapped business potential of location intelligence,and geospatial professionals who are seeking that new business customer.LBx is a multi-media resource aboutlocation intelligence for the businessuser. We launched in print at Where 2.0(an O’Reilly Conference on all thingsdigital mapping) and online at the ESRIUser Conference! Our website is richand interactive, with many new opportunitiesto share your business needs andwants, from posting marketing materialsand white papers to actually connectingwith customers via our LBx Network andVirtual RFP process. Subscribe and joinour community at www.lbxjournal.com.In this issue of <strong>Imaging</strong> <strong>Notes</strong>, ourNext-Gen Mapping column asks questionsabout transparency and its effecton business. This article will also beinteresting to the LBx Journal reader, withits commercial applications.Meanwhile, <strong>Imaging</strong> <strong>Notes</strong> is stillcommitted to the geospatial and remotesensing professionals. We will continue toprovide all original content for each issue—afeat that most major newspapers cannotperform these days. We do not reprint anymaterial from any other source; every storyis written for <strong>Imaging</strong> <strong>Notes</strong> exclusively.Two of those original articles in thisissue come from the perspective of theUnited Nations. One is about voluntarycarbon markets versus those that are Kyotocompliant,by Anna Burzykowska of theYGT European Space Agency. The other isthe Secure World Foundation Forum, whereeditor Ray Williamson shares that variousU.N. Committees use Earth observations inmore ways than you might expect.LBx Journal Launches!Rod Franklin’s report on justifying aninvestment in 3D from an ROI perspectiveis intriguing. We also provide anupdate on water modeling and mapping,an increasingly important issue as lessfresh water is available globally. Finally,Karen Nozik does an in-depth report oneducation, reporting that universities areworking hard to keep up with changingtechnologies, and that the workforceneeds people who can think spatially, andwho can really understand what can bedone with all that data!Join us at GeoWeb in Vancouver,and at the Symposium on Digital Earth inBeijing. With so many geospatial technologiesand applications moving to theWeb, from cloud computing to the SensorWeb, to SaaS (software as a service)Location in the Language of BusinessPublisher’s LetterRenew <strong>Imaging</strong><strong>Notes</strong> now! It isstill free of charge;do not lose yoursubscription. If youdo not renew annually, youwill not get the magazine.making it less expensive, both gatheringspromise serious intellectual stimulationand high-level contacts.Please renew <strong>Imaging</strong> <strong>Notes</strong> now.Take two minutes, go to www.imagingnotes.com/subscribe,and have youraddress label ready to get into yourexisting record. This is still free of charge;do not lose your subscription. If you donot renew annually, you will not get themagazine. Tell your colleagues!LBx Journal is a separate paidsubscription at www.lbxjournal.com,which includes membership to theinteractive website, as well as print.As always, thanks for reading.—Myrna James Yoopublisher@imagingnotes.comimaging notes // summer 2009 // www.imagingnotes.com9
Remote Sensing CapacityBuilding and the United Nationssecure world foundation forumThis June, I spent nearly two weeks at the meeting ofthe United Nations Committee on the Peaceful Uses of Outer Space(COPUOS), which meets in Vienna, Austria annually. In that meeting and the associatedScientific and Technical (S&T) Subcommittee and Legal Subcommittee meetingsheld earlier in February and March, respectively, delegates from 69 States met to shareinformation, work out cooperative programs, and study legal problems that arise in theexploration and use of outer space.In 1967, COPUOS, which was set up by the U.N. General Assembly 50 years ago,worked out the international treaty that provides the legal underpinnings of all spaceactivity, the Treaty on Principles Governing the Activities of States in the Explorationand Use of Outer Space, Including the Moon and Other Celestial Bodies, otherwiseknown as the Outer Space Treaty (OST). This is the treaty that makes remote sensingof Earth’s environment and human activity on the planet truly useful.The first two articles of the treaty contain the following key statements:º º Article I: Outer space, including the moon and other celestial bodies, shall befree for exploration and use by all States without discrimination of any kind, on abasis of equality and in accordance with international law, and there shall be freeaccess to all areas of celestial bodies.º º Article II: Outer space, including the moon and other celestial bodies, is notsubject to national appropriation by claim of sovereignty, by means of use oroccupation, or by any other means.Ray A. Williamson, PhD, is editor of<strong>Imaging</strong> <strong>Notes</strong> and Executive Director of theSecure World Foundation, an organizationdevoted to the promotion of cooperativeapproaches to space security (http://www.SecureWorldFoundation.org).Although States still cannot agree onprecisely where air space ends and outerspace begins, all are nevertheless boundby the treaty, which entered into force at thetime of its inception in 1967, and no Statecan successfully claim jurisdiction over partsof orbits that pass over its territory. Thisprovision helped keep the peace during thedepths of the Cold War by allowing U.S.and Soviet satellites to pass unhinderedover each other’s territories, providingverification of the number and placement ofballistic missiles in each country. This sameprovision, of course, makes possible theoperation of the many different types of Earthobserving satellites that countries and privatecompanies operate today.This year, during both the S&TSubcommittee meeting in February andthe plenary meeting in June, I was struckespecially by the frequent mention ofEarth observations and the benefits theyprovide. According to statements offeredat these meetings, many member Statesmake enormous use of Earth observationsdata to support different aspectsof human and environmental securityneeds. Others, however, spend more timefocused on the need to build capacity foremploying the data effectively.What might surprise many readersis the fact that the United Nations itselfemploys the data gathered by differentcountries to support public needs, fromtracking the spread of vector-bornedisease to responding to natural disasters.According to the United Nations, about24 U.N. entities make routine use of spaceapplications, mostly employing informationderived from Earth observations data.Investigating these uses in detail takesone into a dizzying array of acronyms, allbeginning with the letters U.N.U.N. High Commissionfor Refugees (UNHCR)The United Nations’ broad use ofEarth observations follows from the broadscope of the United Nations’ mandate,which covers most human and environmentalneeds, with a special emphasis onthe needs of citizens within developingStates. For example, this year the officesof the UNHCR began a pilot project onthe use of aerial and satellite imagery forstudying human migration, which is mostoften seen in internal displacements suchas has taken place recently in Pakistanas serious fighting began between thePakistan Army and the Taliban insurgentsin the Swat Valley of Pakistan.The UNHCR study will comparecurrent and past satellite images, mapping10imaging notes // summer 2009 // www.imagingnotes.com
Publisher’s LetterU.N. Food and AgriculturalOrganization (FAO)In addition to these efforts, theU.N. Food and Agricultural Organization(FAO) makes extensive useof NOAA’s National Polar-orbitingOperational Environmental Satellite(NPOES) imagery to warn farmersin Sub-Saharan Africa of impendingdrought or rainy seasons.SSFigure 1U.N. building in Vienna, Austria. Photo credit:Agnieszka Lukaszczyk.changes in land use and determiningpatterns of natural resource extraction. Theorganization will also map refugee campsin order to facilitate delivery of humanitarianaid to the inhabitants. Mass populationdislocations can exact a considerable tollon the environment. Such studies can beenormously useful in helping UNHCR todevelop appropriate methodologies forfinding appropriate sites for refugee camps,in addition to aiding the delivery of food,water, and services to refugees.Refugees in urban settings posea particular challenge to aid agenciesbecause of the density of habitation.UNHCR has used satellite imagery to helpmap refugee populations in the sprawlingcities of Cairo, Damascus and Nairobi.U.N. Operational SatelliteApplications Programme (UNOSAT)Another element of the United Nations isthe U.N. Institute for Training and Research(UNITAR) Operational Satellite ApplicationsProgramme (UNOSAT). Since its inception,UNOSAT has developed more than 900operational maps and associated analysesto assist human security and humanitarianassistance. UNITAR provides applicationstraining related to peacekeeping and preventivediplomacy and also supports training forlocal authorities in disaster prevention andvulnerability reduction.Major Need ofCapacity BuildingIn making effective use of Earthobservations data, developing countriesface the severe difficulties of alack of training in the effective useof satellite data and of appropriatecomputer hardware to operate thenecessary analytical software—inother words, they need training incapacity building. Hence, in the past1two decades, the United Nationshas created or assisted in the developmentof a number of U.N.-affiliatedorganizations to provide training. Forexample, the U.N. Office of Outer SpaceAffairs (UNOOSA), which also serves asthe secretariat for COPUOS, holds a seriesof training seminars and conferences eachyear in developing countries.Finally, the United Nations wasinstrumental in setting up training centersfor space science and applications inAfrica, Asia, and Latin America. Theseaffiliated training centers offer a varietyof courses in order to strengthen thespace capabilities of their regions. Africahosts two regional education centers,the African Regional Center for SpaceScience and Technology Education, onein French in Rabat, Morocco, and one inEnglish in Lagos, Nigeria. Between them,imaging notes // summer 2009 // www.imagingnotes.com11
TTFigure 2A COPUOS session meeting at the U.N. beingled by current Chairman of the Committee,Ambassador Ciro Arévalo of Colombia. Photocredit: Ray Williamson.secure world foundation forum2these two centers serve respectivelythe Francophone north and the largelyEnglish-speaking south of Africa.The single Asian Center for SpaceScience and Technology Education inAsia and the Pacific is located in thecampus of the Indian Institute of RemoteSensing, Dehradun. In Latin America, theRegional Centre for Space Science andTechnology Education in Latin Americaand the Caribbean boasts two locations:one in Puebla, Mexico, on the campusof the National Institute of Astrophysics,Optics and Electronics, and another inSanta Maria, Rio Grande do Sul, Brazil,in the facilities of the National Institutefor Space Research. All of these centersprovide, among other courses, significanttraining opportunities in the processingand interpretation of Earth observationsdata, centered on the regions they serve.The organizations that I havehighlighted provide only a partial viewof the extensive use of satellite Earthobservations data and information that theUnited Nations as a whole applies to itswork on behalf of the developing world.Nevertheless, this list illustrates just howembedded these capabilities are in theU.N. system. It also illustrates just howfar we have come since NASA launchedits first electro-optical satellite, Landsat-1(originally called Earth ResourcesTechnology Satellite, or ERTS) in 1972.Although at the time some U.N. officialscould see the promise of the technologyfor development and for managing Earth’sresources, I suspect that few imaginedthat Earth observations technologieswould evolve into these U.N. workhorses.Nevertheless, there is still a deep need tobuild the capacity for making effective useof the data, and the United Nations hastaken that need to heart.For further information please consultthe many reports that can be foundat: www.oosa.unvienna.org/oosa/en/COPUOS/copuos.html.12imaging notes // summer 2009 // www.imagingnotes.com
Save the Date for GEOINT 2009!GEOINT Returns to San Antoniofor the Sixth Annual Symposium!CONFIRMED KEYNOTE SPEAKERSThe Honorable Dennis C. BlairDirector of National IntelligenceGEOINT 2009 promises to bring together anexciting line-up of speakers building on thedialogue from the past five years’ highly acclaimedevents. Attendees will have the unique opportunityto hear advice from leading experts, share bestpractices and uncover the latest developmentsfrom government, military and industry leadersthrough an exhibit hall of morethan 100,000 square feet.Registration& HousingOpens July 15!The Honorable James R. Clapper Jr.Under Secretary of Defense for Intelligence,Office of the Secretary of DefenseVice Adm. Robert B. Murrett, U.S. NavyDirector, National Geospatial-Intelligence AgencyLt. Gen. David A. Deptula, U.S. Air ForceDeputy Chief of Staff for Intelligence,Surveillance and ReconnaissanceWhere Our National Security Begins…www.geoint2009.com
The Age of TransparencyThe Effect on BusinessNext-gen MappingA transparent world is a frictionless world of information.In this world, almost any piece of information can be connected instantaneouslyand made visible to the public by various people, ranging from those who are simplycurious and bored to those who have a clear mission. Satellite imagery and globaltransparency relative to government accountability and international security have beendiscussed for years, including the role of satellite imagery in news reporting.In addition, satellite imagery in the context of competitive intelligence for businesseshas been raised by the Society of Competitive Intelligence Professionals on occasionin the past but has not garnered much attention recently. Our editor Ray Williamsonand others have talked about imagery activists since the advent of commercial satelliteimagery. Google Earth and other virtual globes have democratized the use of satelliteimagery to extend its use to multiple groups, from kids looking for the closest Starbucksand tracking their friends to activist groups exposing corporate misconduct andenvironmental degradation. Satellite imagery continues to be viewed as the ultimatereconnaissance tool, because it is unrestricted (for the most part) by jurisdiction andnational boundaries.Transparency is a relative term:ººººººººIt can mean availability of information, meaning that a company or governmentagency has invested in acquiring a piece of information, for example, the toxicelements in drinking water.It can mean accessibility, meaning that a company or individual can purchaseinformation available from another source, or a taxpayer can request informationin the government domain through a Freedom of Information Act request.It can mean visibility, meaning that the information is widely distributed and easilyunderstandable, for example through a news broadcast, or interactive map availableon Google Earth. A map of data points can convey more visual informationthan a 20-page detailed report.It can mean the ability to take action, meaning to file a petition, engage in aprotest, or compile a viral Internet campaign.What tools enable all four of these elements? The ubiquitous availability of satelliteimagery, combined with radical cartography, social networks and multimedia platformsis creating a new source of open intelligence that is not managed by the originalcreators of the data.Open Source IntelligenceTraditionally, “intelligence gathering” has been the domain of the military, intelligenceagencies, and private investigators. The intelligence community has coined the term opensource intelligence (OSINT) to mean a form of intelligence collection management thatinvolves finding, selecting, and acquiringinformation from publicly available sourcesand analyzing it to produce actionableintelligence. Military, government andprivate investigators were once responsiblefor “intelligence.” It is now in thehands of anyone with the ability to do amashup. Radical Cartography, renovatedcartography, neogeography, outlawcartography, corporate cartography,political cartography, and so on, can bemore than disruptive—they can be used topersuade, enlighten, or expose practicesthat used to be managed behind corporatecommunication firewalls.There are no shortages of examples ofthe use of imagery and mashup to advanceenvironmental and sustainability initiatives.But what about the advance of business?Businesses are just beginning to explore thepower of location intelligence for improvedperformance and decision making. Butwhat has not been discussed is the impactof unmanaged transparency of informationon operations, management, marketing,financials and regulatory compliance.Transparency in BusinessWhat if a mashup of publicly availablemarket data, economic data, transportationroutes and imagery provides moreinsight on the health of a company thanthe diligently managed 10Ks, 10Qs, 8Ksand financial analyst reports producedCraig Bachmann & Natasha LÉgerare partners in ITF Advisors, LLC, anindependent consulting firm with a focuson next-generation strategy and ontranslating the increasingly complex newmedia business environment’s impacton business models, markets and users.Natasha is also editor of the new spin-offpublication, LBx Journal.14imaging notes // summer 2009 // www.imagingnotes.com
y armies of accountants, lawyers, andfinancial analysts? The financial scandalsof the early 2000s, such as Enron,Worldcom and Healthsouth, and today’sfinancial crisis demonstrate that thosecarefully produced reports designed toensure transparency(at least by theThe ubiquitous availability of satelliteimagery, combined with radicalcartography, social networks andmultimedia platforms is creating anew source of open intelligencethat is not managed by the originalcreators of the data.Securities Act of 1934) and an efficientfinancial market could not be trusted. Willnew corporate positions emerge, such asthe now famililar “Twitter correspondent”and “blogmaster,” for companies torespond to unmanaged transparency?Traditional maps have been storytellersof moments in history. Today’s interactivemaps are no longer mere snapshots, andtomorrow’s maps, which will encompassrealtime data feeds from an extensiveSensorWeb, will be realtime auditsof corporate, government and humanactivity. Can marketing and communicationsbudgets compete with this realtimestorytelling?What should be thecorporate response tomaterial generated by“Radical Cartography”and its ilk? Two of theunplanned offshootsof ubiquitous satelliteimagery and web availabilityare decentralizedactivism and opensource intelligence,supported by imagery. Anyone can nowbe their own journalist, private investigator,intelligence analyst, and mediaplatform. With imagery freely availableand accessible, and when bundled withmulti-platform media, companies have areal issue to address. Despite the securitiesregulations, the financial marketshave never been transparent. In fact, profitoften times results from “mystery.” Whathappens in a transparent world?“The Age of Transparency” is stillunfolding, but clearly imagery and GIShave been enlisted as tools to presentpoints of view faster, better, and cheaperthan ever before. Don’t be surprised atthe mashup as an increasingly powerfulcorporate and government monitoringtool. We anticipate a variety of corporateresponses to yet another digital mediaonslaught (for example peer-to-peer filesharing, blogs, YouTube). This transparencyoffers an opportunity for companiesto leverage this new age of transparency,and to respond more maturely than themusic industry did to Napster. (For thoseof you who may not recall, Napster wasthe peer-to-peer file sharing program thatled to illegal transferring of music files.The music industry’s response was tosue mostly teenagers and students. Afterclose to five years of this litigious strategy,the music industry decided in December2008 to stop such lawsuits.)imaging notes // summer 2009 // www.imagingnotes.com15
Thermal Infrared Applicationsfor Hot MarketsEarth ScopeGreen jobs are just kicking off in thisnation, with Vice President Joe Biden holding the standard asthe most visible of the administration spokespersons. Van Jones, thegreen collar guru, has been recruited into the White House,demonstrating further support for this societal transition to all thingsgreen and sustainable. The ship of state is large, however, and evenwith the stimulus, our national agenda is turning ever so slowlytowards energy conservation and greener lifestyles. More money hasbeen spent on ads by the energy companies touting their greencredentials than has actually be spent on green investments, but thesentiment is there in the marketing/PR departments and that in itselfis a harbinger for change.Perhaps a revisit to the classic I Ching text offering metaphoricalguidance through life’s seasons of change is appropriatefor us now. Energy issues are reaching all Americans, as tracked 1XXFigure 1Airborne Thermal IR of homes, depicting energy loss differences with 25-cm ground resolution at1000-meter altitude (courtesy of Jenoptik).XXFigure 2Hand-held thermal IR sensor image depicting energy loss areas, especially glazing surfaces inhomes (image courtesy of FLIR Systems, Inc.).XXFigure 3Hand-held thermal IR sensor for energy audits and building inspections (image courtesy of FLIRSystems, Inc.).2by media headlines. As of this writing,Congress is wrestling with the AmericanClean Energy and Security Act of 2009,which addresses a litany of issues fromcreation of a ‘cap-and-trade’ system toelectric and hybrid cars to energy efficiencyin homes and buildings. The fossilfuel companies are lobbying a tug-of-warwith environmental and consumer groups,Tim Foresman is president of theInternational Center for Remote SensingEducation and can be reached atforesman@earthparty.org.with consensus that coal will come out awinner for the foreseeable future. Energyefficiency, however, is being codifiedfor building ordinances and is addingmomentum to current programs by statesand municipalities to measure and monitorthe carbon footprints of their jurisdictions.Carbon calculators are becomingmandated throughout country and were ahot topic at the National League of Cities(NLC) “Green Cities” conference heldin Portland, Oregon, in April 2009. TheInternational Council for Local EnvironmentalInitiatives (ICLEI, www.iclei.org),with over 500 city members, is leadingthe parade of carbon calculators andgarnering the market share by forging tieswith NLC and the U.S. Green BuildingCouncil. In my state of Maryland, thegovernor has established a special taskforce to perform energy audits for all statebuildings, with the goal of quantifyingthe state energy efficiency. Governmentmanagers throughout the nation arebecoming occupied by the new trendsfor carbon accountability and are eagerlyrepositioning priorities to address thedeluge of weatherization funds stimulatedfrom our nation’s Capitol. All of theseactions and policies should be viewed16imaging notes // summer 2009 // www.imagingnotes.com
as good news for the remote sensingcommunity, due to the intrinsic need toapply technology into this fray.Thermal infrared (IR) remote sensingtechnology represents both low hangingfruit and a potential market stimulatorfor <strong>Imaging</strong> <strong>Notes</strong> readership. It is stillearly in the game, with many elements oflegal instruments still remaining to makethis topic interesting, but clearly, thermalIR holds great promise and utility in theenergy conservation arena. First, we canthink of applying thermal IR data collectionover-flights for whole communitiesor cities as a precursor to establishinga baseline for the energy efficiency ofhomes and buildings.It would seem logical that, if states,counties, and cities are going to expendmillions of dollars for calculating carbon, abaseline quantification would be prudent.(Note: Current carbon calculators arespreadsheet-based approximationslacking any scientific calibration.) Largeamounts of money will be distributedbased on targeting goals for energyreduction, and baselines are requisite tothis process. Thermal IR has been welldemonstrated for its capacity to quantifytemperature differences (one degreeKelvin) for surface objects (Figure 1).Delineating the relative differencesfor energy loss in buildings and homesis straightforward and can be overlainfor georeference with municipal GISdatabases. County and city administratorscan work with utility providers to link theenergy loss data with customer billingsto create a robust energy conservationprofile for their jurisdictions. While privacyissues may be raised, the only winnerswill likely be plaintiffs’ lawyers, due to theforensic history in remote sensing.The boost in small and large firmshawking their services is evidence thatenergy audits of homes are increasing. Ona house-to-house basis, hand-held thermalIR offers a great way to assess energy heatlosses in a building (Figures 2 and 3). Handheldthermal IR sensors provide answers tothe hidden clues regarding glazing losses,insulation gaps, empty wall cavities, andseam or joint leaks. This information is criticalfor the weatherization retrofit constructionwork that can most effectively address remediationof heat loss and thereby lower thebuilding owner’s utility bill. Because there isa direct link between professionally executedweatherization and lowering of energy bills(estimates range from $500 to $1000per year for the average home along themid-Atlantic region), the impetus to marketthermal IR to a larger but disaggregatedcustomer base should be improving.Is our industry paying attention to theenergy conservation trend? At the March2009 ASPRS meeting in Baltimore, asurvey of the industry demonstrated onlyanecdotal evidence of interest in thermalIR sensors. No company represented thereoffered the services to the commercialmarket. Thermal IR sensors have held fastto the market needs of the Department ofDefense and have not ventured out to theenergy security of our nation. Perhaps, withthe advent of the American Clean Energyand Security Act of 2009, the remotesensing industry will shift gears and makeforays into the rapidly expanding marketfor home and community energy auditsand into the longer term requirements formonitoring our nation’s buildings for everincreasingenergy efficiencies. We mightstart by introducing our technologicalprowess to the leading architectural andengineering firms and mayor’s offices.3imaging notes // summer 2009 // www.imagingnotes.com17
GeoWeb101WorkshopA Digital Nervous System for the PlanetThe GeoWeb 2009 Conference inVancouver offers a new GeoWeb101 workshopby these visionaries. Following aretheir definitions of the GeoWeb:The Geospatial Web is not just a bunch of mash-ups or even the hundreds ofSDI's that have been successfully deployed. The Geospatial Web is about thecomplete integration and use of location at all levels of the Internet and the Web.This integration will often be invisible to the user. But at the end of the day, theubiquitous permeation of location into the infrastructure of the Internet and theWeb is being built on standards.—Dr. Carl Reed, CTO, Open Geospatial ConsortiumThe GeoWeb is more than virtual globes. Today, and for the near term, it is the setof local systems sometimes called Spatial Data Infrastructures (SDIs) that provideaccess to information for decision making and support collaboration among organizations.In the future, the GeoWeb will represent the integration of all businessprocesses that relate to the world around us. It will serve as the foundation fordecision making in government, in industry and in our private lives. It will presentus, in a multitude of ways, the state of the world.—Ron Lake, CEO, Galdos SystemsThe GeoWeb is an interconnectedness of information and services that extendsthe connectedness we already experience on the Web with a set of applicationsand protocols to exploit information at an unprecedented level.—Michael P. Gerleck, Director of Engineering, LizardTechThree different perspectives from leadingvisionaries on the definition of the GeoWeb all bring one common foundationconcept—the GeoWeb is the platform for the aggregation and integration forgeospatial information and services related to life on the planet. Ron Lake has alsoreferred to the GeoWeb as the “digital nervous system” for the planet. With risingdata input levels, including real-time information from sensors around the world,this appears to be an apt image of the role of the GeoWeb.Now that we have some views of what the GeoWeb means, what about its history,what are the important components, and why does it matter? These questions willbe discussed in a new workshop atthe GeoWeb2009 conference titledGeoWeb101. The three quoted visionariesabove will teach the workshop.Here’s a brief overview of what you canexpect in the workshop.Evolution of the GeoWeb:The GeoWeb’s evolution has trackedthat of the Web, moving from Web 1.0 to2.0, and 3.0. However, the GeoWeb hasnot been awarded such clear distinctions.Instead, the evolution of the GeoWeb hasbeen described as essentially moving fromthe ability to form simple queries, such as“show me the location of a restaurant ona map,” to complex temporal modelingscenarios such as “show me the effects ofweather on rice production over the lastyear, or over the next ten years.”What is meant by geo?Traditionally, geo has been narrowlydefined to mean GIS data, imagery, GPSdata—grids, points, lines and polygons.However, any measurement thatpertains to the physical world shouldfall under the term of geodata. Real-timetraffic feeds, weather data, sensor feedsfrom buildings and utilities, businessintelligence data about performance ofcompanies, economic and demographicdata, are all examples of data that reflectday-to-day activities in the world, andthat have not been traditionally definedas geographic data.What are the most importantaspects of the GeoWeb from atechnology perspective?ººData discovery and discovery ofdynamic services is still a challenge.For example, Google hasa web crawler that works well forstatic content. But what aboutdynamic services? For instance,find archives of imagery of18imaging notes // summer 2009 // www.imagingnotes.com
ººSeattle between 2000 and 2005.There could be multiple ownersof that data; therefore, find me allthe possible organizations thatcan serve me this data. Then findme a service that will aggregatethe data from these sourcesand provide me with the highestquality images. How is thatsolved? Standards!Regarding geographicdata, Google Earth provides abaseline of imagery, but wheredoes that data come from? Howautomatically does it get toGoogle Earth? When a municipalityadds a new road, is therea means for that to be automaticallyreflected in the base dataof Google Maps or MicrosoftVirtual Earth (now Bing)?Interoperability is required todeliver seamless services andcontent to the user so that theuser doesn’t need to worry aboutmultiple formats. For example,find the best imagery of Seattleand find floodplain data, and thendisplay a map of the areas at riskfor 100-year floods. If NGA hasthe best aerial imagery and FEMAhas the best floodplain database,and both are in well-known andstandardized formats, then itis much easier to implementthe service combining the twodatasets and furthermore the userdoesn’t even haveto be aware of theGeospatial becomesa value multiplier from abusiness and publicpolicy perspective.Maturing of the GeoWeb will require the developmentof an information infrastructure that integratesbusiness processes, and that is driven from a businessrequirements perspective.ººdifferent underlying formats at all.How is this solved? Standards!Even where organizationsuse the same data formats andvendor technology, informationsharing is not trivial. Eachorganization looks at the worlddifferently and hence usesdifferent schemas (data models).Standards and the infrastructurebased on these standards mustenable data to be shared in spiteof such model differences.Business process integrationof geospatial content is critical.Many GeoWeb technologies aresolutions looking for problems tosolve and many national mappingprograms focus on the aggregationof data that is not particularlyuseful to solving specific businessand public policy problems.Maturing of the GeoWeb willrequire the development of aninformation infrastructure thatintegrates business processes,and that is driven from a businessrequirements perspective.Therefore understandingthe lifecycle and workflow ofdata in the enterprise context iscritical. For example, the buildingpermitting process requires adeveloper to submit plans forthe building for the purpose ofgetting approval. Those plans arecurrently not integrated with lawenforcement, urban planning, andutility providers, for example forthe purposes of crime analysisand city design. How can theseproblems be solved? Standards!Standards in the above examplesinclude not just interface or encoding standardsbut also institutional agreements,process standards, and rights of use.Why does the GeoWeb matter?The GeoWeb allows extraction of adeeper level of information and knowledgethan ever before. As a result, geospatialbecomes a value multiplier from a businessand public policy perspective. Theability to gain unprecedented insight intothe day-to-day activities we conduct, frombusiness to government, and from emergencyresponse, to social interactions, totravel will raise the level of information foreveryone and create a platform for innovationof new products and services.Although taking advantage ofthe GeoWeb does not require formalgeospatial training or expertise,understanding the technology challengesand the history, social, business,and government issues is criticalto its continued growth and maturity.The GeoWeb 101 workshop is a mustfor those new to the GeoWeb geospatialexperience, as well as for thosewho are technically geo-savvy butlooking to better understand the business,governmental, and policy issuesinvolved in expanding the GeoWeb. Foreverything you ever wanted to knowabout the GeoWeb—from its history,definition, and business issues to applications,architecture, and standards—don’t miss the GeoWeb 101 workshopon Monday, July 27, 2009.imaging notes // summer 2009 // www.imagingnotes.com19
1VoluntaryCarbonMarketsfrom SpaceThe Practical Managementof Kyoto-complianceWithin the glossary of terms, bodies and workinggroups associated with the United Nations FrameworkConvention on Climate Change (UNFCCC)negotiations is a well-known reference to satelliteEarth Observations. The UNFCCC SubsidiaryBody for Scientific and Technological Advice(SBSTA) annually endorses the goal of cooperationin “systematic observation” of the climate system20imaging notes // summer 2009 // www.imagingnotes.com
to identify causes and effects of globalchange. The Global Climate ObservingSystem (GCOS) secretariat of the WorldMeteorological Organization (WMO)and other specialized agencies andorganizations participating in WMO’sClimate Agenda are in charge ofon-going research and implementationof “Essential Climate Variables” neededfor climate monitoring and prediction,many taken from Earth observations.The role of Earth Observations in theprocess is no less important to practicalmanagement of statutory and emergingvoluntary “carbon markets.” This isbecause effective mapping and monitoringof carbon stored in land-basedecosystems is key to any mechanismthat compensates countries for reducingtheir greenhouse gas (GHG) emissionsthrough land use and forestry.The UNFCCC negotiation blockcalled LULUCF (land use, land usechange and forestry), which treatsforests and other types of vegetationas global carbon stocks, provides fora wide array of activities that couldmitigate carbon emissions. Because theinternational finance sector has establishedcertified carbon emissions reductionsas a traded commodity, thoseactivities can also generate carboncredits to be further exchanged in theinternational carbon market.As much as one quarter of the CO 2mitigation potential may lie in afforestationand reforestation, preventingdeforestation and forest degradation,cropland management, grazing landmanagement, revegetation, grasslandsand agroforestry. Therefore, it is widelyexpected that future arrangements onclimate change will maximize the roleof LULUCF in the climate agenda byproviding “large, stable, predictableand long-term financial flows” to thecarbon market stakeholders; hence, a“large, stable, predictable and longterm”marketplace for geo-referenceddata is also forthcoming.The necessity to use the remotesensing techniques and other geospatialtools to help shape carbon marketshas been clearly reflected within theframework of the UNFCCC process.The International Panel on ClimateChange (IPCC) Guidelines for Agriculture,Forestry and Other Land Uses(AFOLU) of 2003 is the most importantand widely recognized material developedto assist in the implementationof carbon sequestration and carbonconservation projects. The specificmethodologies based on those guidelinesare developed under the UNFCCCmechanism compliant to Kyoto Protocolthrough the Clean Development Mechanism(CDM) and Joint Implementation(JI)), and within the voluntarycarbon markets outside Kyoto Protocol,especially through the strategy usuallyreferred to as “Reducing Emissionsfrom Deforestation and Forests Degradation”or REDD.Despite developing dedicated instruments,procedures and methods, thevolume of transactions in this area isrelatively small. The parties to the KyotoProtocol limited their certified CO 2emissionsreductions to projects pertainingto afforestation and reforestation (A/R)only, thus excluding carbon sequestrationin soils, non-forest biomass andagricultural land use, or carbon conservationthrough avoided deforestation.Moreover, the Kyoto-compliance carbonmarket for LULUCF is marginal—underthe Protocol it does not exceed 1% of thetotal carbon credits traded within themarket.The change for the LULUCF negotiationblock is, however, forthcoming,and it is expected from three directions.First, a variety of the land-based carboncredits are welcomed in the voluntarycarbon market. Second, the learningby-doingexperience from design, monitoringand verification of the forestryCDM/JI projects is growing. Third,innovative carbon financing can reallymake a difference to the least-developedcountries in achieving their abatementpotential, especially if it will help themreform the CDM/JI system.The Role of theVoluntary Carbon MarketThe international finance sector hasestablished certified carbon emissionsreductions—carbon credits—as internationallytraded commodities. As such,carbon transactions take place in the“Kyoto-compliance” and “voluntary”carbon markets. Currently most of theLULUCF-related credits are outside theKyoto Protocol, mostly because landuse and forestry are barred from theEU Emissions Trading System. Therefore,the credits and offsets from theLULUCF projects are traded primarilyin the voluntary market, which initiallyemerged as an idea for “corporate andsocial responsibility” for climate changemitigation actions, but slowly turned intoan alternative to Kyoto regulations.The voluntary carbon market representsonly 2.9% of the total volume of thecarbon market and 0.6% of its value ($700million USD in 2008); however, despite therelatively small volume, the array of activitiesproducing carbon credits is quite extensive.The emissions reductions based on theavoided deforestation and forests degradation(REDD) has been, for example, firmlyestablished there. Soil carbon sequestrationhas been included in the biggest U.S.-basedinternational voluntary emission tradingsystem, the Chicago Climate ExchangeWWFigure 1This radar Envisat acquisition highlightsIndonesia’s Kalimantan region in the southernpart of tropical Borneo in Southeast Asia.Borneo, the world’s third largest island, wasonce covered in dense rainforests. However,in the 1980-1990s, these forests were clearedfor their timber at an alarming rate. Soon after,the global demand for palm oil increased andwhat was left of Borneo’s forests started beingcleared for palm plantations (visible as squaregreen patches). This image was acquired onApril 23, 2009, by Envisat’s Advanced SyntheticAperture Radar (ASAR) instrument. Credit: ESAEnvisat www.esa.int.Anna Burzykowska, LL.M.YGT European Space AgencyWashington D.C.www.esa.intimaging notes // summer 2009 // www.imagingnotes.com21
(CCX), and the California Action Reserve—the regional carbon offset market in theWestern United States—comprises projecttypes from agriculture to forestry. In 2004,as much as one-third of the voluntarymarket transactions were in the land-basedsector, mainly within forestry. The volumeof transactions fell in 2007 and 2008 to16% and 11% respectively, but the marketgrew in size (it doubled in 2008) and theamount of certified emissions reductions,as well as the number of registered projects,has increased.This trend will be further reinforcedafter the land use carbon credits areaccepted under the future U.S. emissionstrading scheme, the cap-and-tradesystem. The American Clean Energyand Security Act (formerly called theWaxman-Markey proposal) passed in theU.S. House of Representatives on June26, 2009 and pending Senate's approval,calls for carbon offsets from afforestation,reforestation and other biological sequestration,including emissions reductionsfrom forestry conservation in developingcountries. As a result, it is likely that thosevoluntary markets will eventually pave theway to carbon sequestration/conservationin soils and forests as a part of the internationalcarbon market in the post-Kyotoregime to be negotiated in Copenhagen.2Building up the voluntary carbonmarket capacity has other importantadvantages. The Kyoto system is veryconservative in terms of LULUCF. Itregards, for example, the REDD strategyas yet insufficiently developed to becomeextensively financed by market mechanisms.There are good reasons for thisskepticism: the land-based CO 2mitigation(sequestration) strategy has to deal withthe problem of leakage (or displacementof emissions to another location to avoidregulation) and non-permanence of emissionsreductions, as well as with fears of“flooding the market with cheap carboncredits,” which would distract attentionfrom regulating fossil fuel and otherheavy industry sectors. Therefore, manyLULUCF activities are simply not eligiblefor CDM financing under Kyoto. There isalso little incentive to do the cumbersomeresearch and preparations that are requiredfor Kyoto-compliant CDM projects, whichare generally regarded as expensive, toocomplicated and highly rigorous.Voluntary market transactions, onthe other hand, are much more inclusivewhen it comes to the types of supportedactivities, as well as much more flexiblewith regard to project design and implementation(although the carbon creditsmay be sometimes of a lesser value,depending on the type of activity). Thereforethe voluntary carbon market grewnot only as a place where the majorityof interest in land-based carbon creditsaccumulated, but it consequently is alsoexpected to contribute to the reductionof the complexity of the CDM methods.More so, the voluntary market has consequentlybecome the best space for testingnew products, services and methodologiesin project design, monitoring and verification.The CCX, for example, has recentlyapproved its first forestry carbon offsetplan using innovative remote sensingmonitoring techniques: aerial LIDAR andCIR remote sensing imagery. In effect, ifthe market potential of LULUCF is goingto be shaped by an increasing confidencein emissions reductions (largely achievedby new science, technology and innovativeremote sensing applications), theseare the voluntary markets that will yieldimportant results for the inclusion orexclusion of new methodologies andprotocols for LULUCF projects implementation.The most recent 2009 assessmentof the CDM, the World Bank’s annualreport on state and trends of carbonmarkets, has explicitly mentioned thatthe know-how from the U.S. voluntarydomestic emission reduction schemes—especially under the California ClimateAction Reserve (C-CAR) or the VoluntaryCarbon Standard (VCS)—is seen asa guideline for addressing the problems ofthe permanence of emissions reductionsin soils and biomass, and of simplifyingthe methodology for Kyoto-compliancetransactions in the forestry sector.Learning-by-doing ExperienceThe most recent UNFCCC SBSTAmeeting in Bonn, June 1-12, 2009, notedthat the experience from real-life forestryprojects is paramount for the REDDstrategy to be included as an outcome of2009 UNFCCC talks in Copenhagen.Significant progress in using remotesensing methods has been possible thanksto the lessons learned from the REDDprojects run by, among others, the WorldBank BioCarbon Fund, GOFC-GOLD,Tropical Forest Group and national forestresearch organizations, to name a few. TheWorld Bank’s BioCarbon Fund (BCF), forinstance, submitted to SBSTA a review ofthe methodology developed for the projectin Madagascar dedicated to estimatingand monitoring GHG emissions frommosaic deforestation. The Institute ofApplied Ecology in its report to UNFCCCindicated improvements in using Earthobservation technologies in forestryprojects implemented in Peru, Congo,Madagascar, Indonesia, and Papua, NewGuinea, but pointed to poor historical datafor many tropical countries (of which Indiaand Brazil are prominent exceptions) andto problems with time series consistencybetween the data from different satellitesand sensors over time.22imaging notes // summer 2009 // www.imagingnotes.com
The lessons learned within the Kyotomarket, on the other hand, are at leasttwofold. The CDM/JI projects assessmentby the UNDP (U.N. DevelopmentProgramme) revealed that the costs offorestry projects monitoring and verificationcan be very high, in some cases upto 25% of project cost. This is becausethe accuracy levels are very high and theapproach toward potential deficiencies indata is conservative.In terms of CDM/JI projects planning,by August 2008 over 90% of the approvedafforestation/reforestation projects werebased on the historical land use data forestimation of land eligibility and the emissionsreduction baseline. As a result, theGlobal Environment Facility (GEF) – thefinancial mechanism of the UNFCCCgoverned by the World Bank – indicatedthe need for wider accessibility of scientificresearch and GIS for the CDM/JIdecisions planning.The 2008 release of the historicalLandsat imagery has been a majorbreakthrough in addressing those needs;nevertheless the basic information onland categorization for potential carbonstocks is still lacking in developing countries,especially in Africa, because theevidence of historical land use is often notavailable to them or is difficult to obtain,especially over tropical regions with aheavy cloud cover. It is expected thatonly the upcoming FAO Forest ResourceAssessment (FRA 2010) will provide thefirst consistent global time-series of satellitedata using imagery from MODIS (at250-m resolution) and Landsat satellitesfrom 1975, 1990, 2000 and 2005.Innovative Carbon MarketsFinancing in Developing andLeast-developed CountriesThe UNFCCC has repeatedly raisedthe concern that between one-half andone-third of carbon abatement spendingbetween 2000 and 2050 must occur indeveloping countries, but the immaturityof their carbon markets—the poor supplyof offset credits under the CDM—posesa problem in achieving their mitigation3WWFigure 2Satellite image showing deforestation in Northwest Brazil (Rondonia) is an example of a multi-temporalproduct extract based on the combination of two ERS acquisitions (April 1996) showing radar backscatter(green) and radar backscatter changes over time (blue) over a region of active deforestation. Deforestationpatterns are clearly visible from the structure and texture of the backscatter image layer in the Southeastportion of the image extract. This product extract has been designed and processed by Gamma RemoteSensing (CH). Credit: ESA/Gamma Remote Sensing.SSFigure 3One of Russia’s largest reservoirs, the Tsimlyansk, is highlighted in this Envisat image acquired on September27, 2008, over southern Russia. The reservoir is located at the great bend of the Don River near the town ofTsimlyansk in the province of Rostov. Many agricultural crops can be seen growing along the river, includingwheat, rice, cotton, alfalfa, grapes and other fruits and vegetables. The darker brown areas around thereservoir indicate where crops have already been harvested. Earth observation satellites are used inagricultural monitoring for mapping and classifying land use, crop type, crop health, change detection,irrigated landscape mapping and crop area mapping. Credit: ESA.potential. To overcome that difficulty,in 2007 the World Bank and its CarbonFinance Unit (CFU) introduced innovativefinancing mechanisms, which in theshort term are aimed to buffer the lowconfidence in carbon transactions withthose countries, help them to overcomebarriers for CDM project developmentand implementation, and enable transferof technologies and know-how.The vehicles for those transactions arecarbon funds managed by the World Bank,such as Prototype Carbon Fund, NetherlandsJI and Netherlands CDM Facilities,Community Development Carbon Fund,BioCarbon Fund, Italian Carbon Fund,Spanish Carbon Fund, Danish CarbonFund, the Umbrella Carbon Facility,Carbon Fund for Europe, the ForestCarbon Partnership Facility, and theimaging notes // summer 2009 // www.imagingnotes.com23
Carbon Partnership Facility (CPF).The CFU uses resources from thosefunds to set up projects within the CDM/JI framework, which would not normallybe eligible for loans or commercial lendingdue to high transaction risks. Then theWorld Bank purchases carbon credits onbehalf of the fund contributor, becominga source of carbon market revenues indeveloping countries.The most recent 2009 assessment ofthe CDM has explicitly mentioned thatthe know-how from the U.S. voluntarydomestic emission reduction schemesis seen as a guideline for addressingthe problems of the permanenceof emissions reductions in soilsand biomass, and of simplifying themethodology for Kyoto-compliancetransactions in the forestry sector.The Bank’s Carbon Finance Unitalso has a role in capacity building. TheForest Carbon Partnership Facility, forexample, dedicated $185 million USD toestablish “readiness mechanism” for threepurposes: reference scenarios for avoidingdeforestation in 37 developing countries;national monitoring, reporting and verificationsystems for emissions and emissionreductions; and national REDD strategy.The CFU, in addition to that, also“systematically observes the CDM regulatoryprocess and contributes to bottom-uprulemaking for CDM by interpreting regulatorydecisions, providing input, and developingnew methodologies, thus bridgingthe gap between general guidelines andmethodologies with their application toreal-world projects.” The openness of theCFU to new methodologies can generate asignificant potential for the GIS communityand facilitate a number of practical contributionsof the remote sensing technologyto the UNFCCC process, especially if itdelivers novel but universal results to tweakthe nuts and bolts of the Kyoto system.New Science – New Opening forCarbon MarketsThere is a growing dedication onbehalf of space agencies around the worldto introduce new science and technologyand new global-scale research projectsdedicated to land use and forestry, whichwill eventually allow more transactionsin carbon markets with higher certaintyof emissions reduction. The new remotesensing products and applications areforthcoming specifically to tackle theneed for global, regional, and project-wisecarbon accounting identified through theLULUCF negotiation block.For example, in 2008 ESA released itsGlobCover application, which providesthe first global land cover map for 2004-2006 updated bi-monthly and based onENVISAT MERIS data with 300-meterresolution. Currently developed forestryprojects such as ESA/JRC TREES3, FAOFRA 2010 or NASA Landsat PathfinderHumid Tropical Deforestation Project willbe a novel and highly anticipated source ofdata on global emissions from deforestation,but no sooner than in 2010.In terms of new sensors being developed,after 2013 the high-resolutionhyperspectral, SAR and LIDAR satelliteswill open new chapters for remotesensing carbon accounting from space(due to NASA-planned decadal surveymissions (DESDynI, HyspIRI and LIST),and a candidate ESA Earth ExplorerMission (BIOMASS) dedicated to takingglobal measurements of forest and landbiomass). In terms of using the existingSAR imagery for land use and forestryapplications, which is still uncommon, theESA Climate Change Initiative of 2008proposed research towards measurementof forest biomass by a combinationof SAR and LIDAR measurements fromERS, ENVISAT, RADARSAT and JERSsatellites, with the aim of reaching continentalor even global scale forestry maps.See Figures 1-3.The results of this study will be important,because these kinds of data have notyet been available with global coverage,and because there is little experience withusing radar imagery for forest monitoringas an alternative observation method. Ifthe mass market for forestry and landbiomass applications indeed emerges, itwill be the result of enhanced confidencein and improvements of optical satelliteobservations: multiplication and internationalizationof satellite missions, lowerprice for high resolution imagery, andautomatization of observations.Yet before these new developmentswill deliver data, the current mitigationcommitment will be provided by theexisting systems such as Landsat (U.S.),CBRES (China-Brazil), TerraASTER(US-Japan), IRS (India), SPOT (France),DMC (Algeria-China-Nigeria-Turkey-UK), ERS, ENVISAT (ESA), mostlybecause the same methods for referencescenarios, monitoring and verificationhave to be used within one creditingperiod. New sensors will open the possibilityfor establishing new baselines andcontribute with new monitoring and verificationmethods when the Kyoto secondcommitment period, from 2013 onwards,will be well advanced.NoteThe author was a member of the TaskForce to Poland’s Special Envoy/ClimateAmbassador for the 2008 UNFCCC COP14 inPoznan, Poland. The views expressed hereshould not be attributed to any of thoseorganizations.Key sourcesWorld Bank: State and Trends of CarbonMarkets 2009; Forest Carbon PartnershipsFacility Brochure; Forests Sourcebook2008. UNDP: Key issues on land use,land use change and forestry (LULUCF)with an emphasis on developing countryperspectives. The Forests Dialogue’sInitiative: Beyond REDD. The Role ofForests in Climate Change. GOFC-GOLD: ASourcebook of Methods and Procedures forMonitoring, Measuring and Reporting. FAO:FAO Global Forest Resources Assessment(FRA 2010), Remote Sensing Survey.Institute of Applied Ecology: ReducingEmissions from Deforestation of DevelopingCountries in a Post 2012 Climate Regime - aQuantitative Analysis.24imaging notes // summer 2009 // www.imagingnotes.com
Everything is Connected tm9GeoWeb conferences focus exclusively on geographic information systems, theInternet, and the economic potential associated with their convergence. GeoWeb2009 will continue the tradition of focusing on the reciprocal impact of the Web andGeographic Information as well as the ever-increasing need for collaboration in lightof global economic and environmental concerns. GeoWeb 2009 is for everyone!Representatives from both public and private organizations are invited to meet,discuss and learn about today’s most innovative geospatial technologies. Be sure tosave the date and join us this coming summer as we explore and unlock the future ofthe GeoWeb!Register Online Today!www.geoweb.orgJuly . 27-31, 2009 Morris J. Wosk Centre Vancouver, BC Canada
WaterModelingMapping and ManagementThe modeling of natural andmanmade water systemsencompasses one of the moreestablished uses of remotely-sensedimagery and applied GIS. But whereexactly does this sector stand asof mid-2009? How far has it come?On a foundational level, water mapping practitionerscontinue to make product choices that refine the boundariesof engagement for modeling environments, softwareinterfaces and standards. Without question, the industryhas achieved a certain level of maturity: Showcase projectsfeature geodatabase technology that, more thanever, help monitor the dynamic conditions of potableand non-potable water systems all over the world.At the project level, each effort tends to becharacterized by its own set of wild cards.Sometimes specific technical challenges standat issue. In other cases, time factors aretightly woven into project objectives.But perhaps the most universal setof variables is encompassed bythe myriad ways in whichgeographic and legacy dataare mingled—juggledmight be a betterword—to producevisual solutionsthat are useful inthe guidance ofhuman decisions.2
The Journal of the American WaterResources Association observed a fewyears ago that a rich variety of technicalapproaches to water modeling, driven inlarge part by competitive jockeying, hascome to disaggregate the art. “Currently,”it reported in a state-of-the-industrypaper, “disparities in spatial scales, dataaccessibility, modeling software preferences,and computer resources availabilityprevent application of a universalinterfacing approach.”Experts might agree that this fragmentedstatus applies still. The industry,nevertheless, continues to put on newfaces. Consolidation has changed upthe vendor roster. With its purchase ofHaestad Methods Water Solutions in2004, and piqued by a national surveythat it commissioned in 2007, Pennsylvania-basedBentley Systems has boldlystaked its claim as the king of the watermodeling hill.Rod FranklinReporterDenver, Colo.Surveys answered by more than 800industry professionals indicate that thecompany’s software leads in categorieslike distributions systems modeling,transient analysis, wastewater conveyance,storm water networks, and hydraulicscalculation tools. In detention pondmodeling, IntelliSolve Inc., a Clevelandcompany, emerged as the top innovator.Practitioners chose the U.S. Army Corpsof Engineers as the preferred developer offloodplain management solutions. Newsolutions like Intermap’s NEXTMapUSA product may change that, with itshigh-resolution 3D digital elevation andterrain models.As a fully integrated concept inwater systems engineering, however,GIS appears to have hills yet to climb.Survey respondents said that its statusas a framework for an idealized workingenvironment plays third fiddle to theirgeneral desire for systemic interoperabilitywith existing industry standards(EPANET, the storm water managementmodel and LandXML, for example), andsecond fiddle to CAD systems. Watermodeling engineers indicated theirpreference for tools such as AutoCADand Bentley’s MicroStation over solutionslike MapInfo and ArcGIS, thoughMicroStation users can integrate datainto ArcGIS. See Figure 1 on page 28.The directions water mapping hasfollowed as an applied science seem tobe limited by fewer bounds. Each year,ESRI’s Special Achievement in GISAwards (SAG) acknowledge local andregional water modeling campaigns allover the planet. Ceremonies in recentyears have focused on projects in theU.S., Italy, Sweden, Norway, CostaRica, Jamaica, Brazil, Uruguay, Peru,China, Sri Lanka and the Philippines.The company gave awards to sevenwater or wastewater projects in 2008,six in 2007, four in 2006, and six in2005. These did not include SAG citationsfor water modeling efforts thatmay have been part of comprehensiveprojects initiated within the utilities,pipeline, forestry, government, engineering,environmental managementand ESRI Conservation Programsectors.City of Akron Public UtilitiesBureau CentralizationOne of the standout projects from lastyear’s SAG was orchestrated by the Cityof Akron Public Utilities Bureau (APUB).This organization was in the midst of adecade-long records conversion processfor its water and wastewater departmentswhen the decision was made to install acentralized system to manage work andinventory for all assets above and belowthe ground. For nearly 100 years, APUBkept its records by means of hand draftingonto cloth paper and mylar. Now, a geodatabasesynchronized with its new exteriorrecords application helps reduce inefficienciesin water system data access.Southern Nevada Water AuthorityRebates for XeriscapingA star of the 2007 SAG ceremony wasthe Southern Nevada Water Authority(SNWA) Water Smart Landscape program,which offers rebates to Nevada residentsand businesses that convert their waterdependantturf coverage to xeriscapedesign. Using six-inch airborne imageryprovided by Digital Mapping Inc., SNWAhas been able to identify grassy areas andpotential program applicants. The solutionemploys ArcGIS from ESRI, ERDASImagine, and Feature Analyst from OverwatchSystems.Managing WaterResources in FloridaGiven Florida’s richly tattooed waterprofile—it includes the Everglades andIntra-coastal Waterway, water supplycanals, lakes, bays, estuaries and ports—managing water resources in the state isa complex issue, requiring accurate andup-to-date geospatial information. Aboutfive years ago, with existing data scarce orobsolete, mapping experts within the statewere challenged to geographically isolateissues related to zoning, rights of way,engineering method, storm control, waterquality, and the interests of wetlands andwildlife habitat versus those of sugarcane,sugar beet and citrus growers.In order to fulfill their need for accurateand up-to-date geospatial informationof their respective jurisdictions, thefive water management districts in Floridateamed up with the USGS to collect highresolution digital airborne imagery ofthe entire state in 2004. The orthoimagemapping was completed by MarylandbasedFugro EarthData (formerlyEarthData International). It was one ofthe nation’s first large-scale acquisitionefforts taking advantage of the LeicaADS40 sensor’s ability to generate bothnatural color and false color renditionssimultaneously. See Figures 2-3.For the South Florida Water ManagementDistrict alone, a total 16,800 individualmap tiles were produced in bothimaging notes // summer 2009 // www.imagingnotes.com27
natural color and color-infrared rendition,and a total of more than 3 terabytesof image data was delivered. This datasetallowed the district to extract valuableinformation.The state is currently involved ina statewide project to map the topographyalong the coastline using airborneLiDAR. The goal of this ambitiousproject is to allow state and local authoritiesto model the effects of sea-level rise oncoastal communities. Fugro Earthdata isalso involved in this project along with anumber of other mapping companies.Mapping Oyster BedsAnother project was initiated by theSouth Carolina Department of NaturalResources (DNR) for the purpose ofidentifying intertidal oyster beds. Duringlow tide, the natural reefs that harborthis seafood delicacy tend to lie exposedabove the state’s coastal ocean water line.In 2003, the DNR and National Oceanicand Atmospheric Administration’sCoastal Services Center determined thatsub-meter spatial detail would be necessaryto map adequately a targeted 1,500square miles of reefs. Specialists alsodecided to use a combination of spectraland spatial data in distinguishing liveoyster clusters from muddy, shell-coveredreef substrate materials.To achieve these goals, GeoVantageInc. (Swampscott, Mass.) built 22 lightweight,high-resolution multispectralcameras that it dispatched in up to 10planes per flight session. The acquireddata helped commercial interests efficientlycollect and sell more than $1million of oysters annually.Categories of Water ModelingTo those who follow the multi-jointedstate of the water mapping art, 2003 mayseem like an epoch ago. The fact is, somewater models develop over a period ofyears into data-centric Godzillas. BentleySystems features one project on its Websitethat shows how certain products are sometimesnecessary to simplify these modularepics of data aggregation. Asset managementstaff in Toronto deployed Water-GEM’s Skelebrator module to automate theskeletonization of the city’s water systemmodel without losing hydraulic equivalenceinformation and network connectivity.From a GIS and data perspective, ithelps to think of water research in categoricalterms. Disciplines can be dividedinto the very broad areas of watershedcharacterization and management, floodplainmanagement and forecasting, waterquality, and permitting.º º Watershed management: Thisººmultidisciplinary category includesterrain modeling, stream flowstatistics and debris flow probability.The latter refers to flows ofrock, earth, and other water-saturateddebris that develop when theground is rapidly soaked duringheavy rainfall or snowmelt conditions.They can strike with little orno warning at avalanche speeds.Floodplain management:<strong>Imaging</strong> and modeling projectssupport a combination of correctiveand preventive exercises.Some may require the integrationof data from a variety of sources,including zoning, subdivision, orbuilding requirements, as well28imaging notes // summer 2009 // www.imagingnotes.com1
as those required by specialpurpose floodplain ordinances.º º Water quality: This work involvesthe constituent analysis ofgroundwater and the characterizationof groundwater rechargeareas and surface water. Becausethe relationship between surfacewater and groundwater is usuallysymbiotic, cross-contaminationis an issue, and GIS becomes auseful ally in the calculation ofchemical mass load impacts andof migrations between surfaceand subsurface waters. GIS alsocan be helpful in the monitoringof water quality changes withinspecific zones, such as rivers orbays.º º Permitting: Geographic informationplays a key role in the determinationof which businesses oractivities are granted water rightsor access to land in and aroundwatersheds. Modeling with GISfacilitates permitting tasks in theareas of water quality monitoring,hazardous materials tracking,underground tank managementand well log data management.It also applies in-site analysis,rights-of-way permitting andwater flow analysis.These applications have gotten topbilling in some regions. The Pacific NorthwestRegional Collaboratory (PNRC, a2004 project of the U.S. Department ofAgriculture) supported mapping exercisesin the above areas throughout Idaho,Washington and Oregon. Its water resourceforecasting projects sought to provideoperational tools that could be used toimprove estimates of streamflow in snowdominatedregions. Riparian analyses havefocused on vegetated areas situated closeenough to streams to influence the stream’sconditions, or to be influenced by the presenceof a stream. PNRC campaigns alsohave delved into near-shore habitat restorationstudies that are candidates for assistanceby remote sensing technologies.Other GIS projects have tackled watersystems analysis in areas that are anythingbut pastoral. The previously-mentionedEarthData has experience here. Its contributionin 1997 to a Con Edison energyloss inventory for Manhattan stands asone of the company’s technical coupsin urban water modeling. In a nutshell,EarthData achieved its goal of identifyinga two percent reduction in total energyloss from steam fitting leaks within thecity’s heating system by using airbornethermal surveys, video, and existingnatural color aerial photography.International ProjectsUsing spatial data to map all that is wethas gained global momentum. In the Pugliaregion of Southern Italy, GIS applicationsnow display networked workstation datafor drinking water in real time. In Venice,complex mathematical models are beingprocessed by MicroStation operators tokeep the city from sinking into the lagoonupon which it was built 1,200 years ago.Bentley also has completed water resourceshowcase projects in Istanbul, Turkey andin southern Australia.A few years ago, Australia was a mishmashof unrealized GIS market potential.Intergraph Corporation (Huntsville,Ala.) was reporting its intent to use G/Technology as a means of streamliningoperations at Melbourne’s 1.3-millioncustomer South East Water corporation.Around the same time, Tensing USA ofRockville, Maryland released news ofits mobility solutions GIS contract withSydney Water Corporation—the continent’slargest water supplier and treatmentcompany.Consultants observed at the time thatthe sharing of spatial datasets betweenjurisdictions in Australia is not an assumedfact of life, at least in comparison withconditions in the United States. They alsonoted that imaging and GIS companies hadbegun to approach the Australian marketmore aggressively as talks advanced ona comprehensive national water policy.Those policy negotiations continue.Some have said that the metropolitan3WWFigure 1The WaterGEMS integration with ArcGIS allowsusers to analyze their network directly insideArcGIS and to overlay model results in ArcGISfor presentation. Image courtesy of BentleySystems, Inc.SSFigures 2-3These orthoimages are of the Royal PalmHammock quadrangle, which is located afew miles west of the Everglades NationalPark, in Collier County on the Gulf coast ofFlorida. The images were collected at a 1-mpixel resolution on December 3, 2004, using aLeica ADS40 airborne digital imaging sensor,as part of the statewide mapping program forFlorida covering approximately 54,000 squaremiles. Images courtesy of the South FloridaWater Management District and the USGS, andacquired and processed by Fugro EarthData.regions of coastal Australia represent aGIS market that is at least as strong as thatof North America. So there are new placesthat imaging and remote sensing can takethose who devote themselves to watershedanalysis, floodplain assessment, and stormwater or sewage systems engineering. Evenif water modeling has been around as longas GIS itself, there are yet miles to go.imaging notes // summer 2009 // www.imagingnotes.com29
RemoteSensing andGIS Education21228Universities Work to Keep Pacewith the Information RevolutionThe study of location may be as old asthe woods, but today, the way locationis studied, and why it is studied, arechanging drastically. To meet the challenges and to benefit from the tremendousopportunities of an information-based global economy, it pays to be both educatedbroadly and skilled technically. More and more, the information-based globaleconomy is becoming a geospatial information-based economy. Aerial and satelliteimagery and computerized geographic information systems (GIS) are revolutionizingthe conduct of business, science, education and government. Consequently,people who can think spatially—where things are, in relation to other things—arein great demand.According to the U.S. Bureau of Labor Statistics (BLS), the number of workerswith the title “geographer” or “mapmaker” is small; there were fewer than 11,000mapmakers and geographers in the United States in 2006. However, the BLSexpects overall employment of surveyors, cartographers, photogrammetrists, andmapping technicians to increase by 21 percent from 2006 to 2016, a pace muchfaster than average for all occupations. See http://www.bls.gov/OCO/.5591226Need for Interdisciplinary EducationWhile this statistic is impressive, it hardly captures the interdisciplinary natureof an information-based global economy, nor industry's true demand for technicallysavvy employees who can think on their feet. In fact, the need may be greaterthan BLS's number suggests.By Karen NozikEco-writerBoulder, Colo.www.eco-writer.comXXFigure 1Penn State offers three online programs of study in the area of geospatial technology. Thismap shows the locations of alumni from all three programs: the Certificate Program in GIS (1235graduates), the Geospatial Intelligence Certificate Program (6 graduates) and the Master of GISprogram (53).30imaging notes // summer 2009 // www.imagingnotes.com
1029491062552111112362658361122611711 849 2512 332759 314531012262726431054imaging notes // summer 2009 // www.imagingnotes.com31
The current education method islike learning how to run a calculatorwithout ever understanding math.Jason San Souci, President and CEO ofAFE Advisor, a GIS education company,agrees that demand for trained workersis out-pacing supply. Mr. San Souci, whois also the President and COO of NCDCTechnical Services and active in numerousprofessional and scientific organizations,including the GIS Certification Institute(GISCI), URISA GISCorps, and AmericanSociety of Photogrammetry and RemoteSensing (ASPRS), said: “Undoubtedly weare making great progress, but there isstill a big disconnect between GIS educationand GIS application.”Victoria Provenza, CEO of the Colorado-basedgeospatial solutions companyProSpatial, concurs. Provenza says thequestion of whether educational institutionsare adequately preparing studentsfor future jobs is timely now that theindustry is growing up beyond its first20-30 years. “Ten years ago, it was allabout certification programs and whethersomeone had a grasp of technology. Butthe power of GIS is being able to ask a bigquestion, and then proving it using GIStechnology. We can have all the data inthe world. We still need humans to askthe right questions.”Provenza plans to hire 20-40employees over the next year, dependingon what her clients' contracts call for,and she is looking for employees with anability to solve problems contextually,temporally, and spatially. “GIS is simplya decision tool—and the ability to collectdata is ubiquitous. There is less needfor “geo-techs” now, and more need fortheorists,” she said.Restating a theme heard over andover again, Mike Beltz, CEO of GCSResearch, an internationally-recognizedaward-winning leader in advancedgeospatial information technology solutionsin Missoula, Montana said, “Thereis definitely a need for industry to get moreinvolved with educational curriculum.Students are being taught how to run softwareprograms. Anybody can learn howto generate data. The need is for employeeswho can generate accurate data sets.”The current educational method is likelearning how to run a calculator withoutever understanding math.Calls for more critical thinking skillsin GIS educational curricula are musicto the ears of Doug Flewelling, Directorof the Master of Science in GIS at theUniversity of Redlands, California. Hesays that five years ago, it was all aboutthe software. Technology has beenchanging so rapidly that it's been difficultfor university faculty to keep up tospeed. “They would have to go back andlearn new commercial software everythree years,” Flewelling said. The smallliberal arts university situated in the sametown as ESRI emphasizes the interdisciplinarynature of emerging occupations.That emphasis is one of the reasons thatthe university does not offer on-linelearning for its certificate program. “Notmany on-line courses can get the nuancesof spatial information the way living,learning proximity can. If industry islooking for critical thinking skills, thenwe are well-positioned to offer the whyand the how of posing questions andsolving problems.”Sue Kalweit, an expert in GIS andeducation for Booz Allen Hamilton,says that universities are in the businessof educating students to go downone of two tracks: either to get a job,or to do research. It's a challenge foruniversities to stay current in such atechnologically driven industry, andto understand what students need tolearn in order to obtain or improveskills and competencies for the future.Kalweit has a saying that sums it up:“It's the data, stupid!” For clarity, sheadds, “The great news is: there's a tonof data. The bad news is: there's a tonof data. Too few people really understandquality, accuracy, relevancy, andcurrency.”Certification and LicensureKalweit states that there is room forpeople of all technical backgrounds in thefield. When considering GIS pedigrees,it helps to step back and delineate fourcategories: 1) professional certification; 2)professional licensure; 3) academic certification;and 4) accreditation of institutions.There is a distinction between certificationand licensure. ASPRS' websitedescribes its certification this way:...ASPRS certification is officialrecognition by one’s colleagues andpeers that an individual has demonstratedprofessional integrity andcompetence in their field. As such, theASPRS voluntary certification programis considered "specialty certification."It is not a substitute for licensure as, forexample, a Land Surveyor or ProfessionalEngineer. Licensure is a legalact on the part of states to protect thepublic health, safety and welfare. It is aprocedure by which various state andlocal governments require the licensingof certain professions, practices, trades,etc., under formal statutes and ordinancesto protect the well-being of itscitizens. Licensure may be required byyour local state, county, etc., whether ornot you secure certification.Professional accreditation programsare also entirely voluntary. The GISCIdescribes its program this way:The GIS Certification Institute(GISCI) is a tax-exempt not-for-profitorganization that provides the geographicinformation systems community with acomplete certification program. GISCIoffers participants, from the first earlyyears on the job until retirement, apositive method of developing valuefor professionals and employers in theGIS profession. A GISP is a certifiedGeographic Information SystemsProfessional who has met the minimumstandards for ethical conduct and professionalpractice as established by the GISCertification Institute (GISCI).According to Karen Schuckman,past-president of ASPRS (and CP, PLS,MGIS, in the Department of Geography,32imaging notes // summer 2009 // www.imagingnotes.com
John A. Dutton e-Education Institute,College of Earth and Mineral Sciences atThe Pennsylvania State University), in thelast 10-15 years, during which licensingacts have been put into effect, some of thesubdivisions within the industry requirea professional license to conduct business.About 8-10 states actively enforcelicensing acts that include photogrammetryand some GIS activities. Mostprofessional licensure programs require afour-year degree.Academic certificates are those offeredat four-year academic institutions. GIS isoften treated not as a minor, per se, butas a corollary to other majors such asAnthropology. For instance, Penn Stateoffers on-line learning for its GeospatialEducation Portfolio through its PennState World Campus. Students have threePost-Baccalaureate programs to choosefrom: Certificate ofGIS; Certificate ofPeople who can think spatiallywherethings are, in relation to otherthings-are in great demand.Geospatial Intelligence; and Master ofGIS. The Certificate in GIS helps currentand aspiring practitioners to becomeknowledgeable and skillful users ofgeospatial data and technologies.The Certificate in Geospatial Intelligencehelps current and aspiring analyststo combine spatial thinking, informationliteracy, and geospatial technology skillswith knowledge of cultural and politicalgeography and a commitment to ethicalpractice. The Master of GIS is designedfor experienced practitioners who aspireto leadership in the geographic informationsystems profession. Figure 1 showswhere graduates are now.Finally, accreditation programs arein place when one organization, such asthe USGIF Academy, accredits anotherinstitution. In this effort, the USGIFAcademy appears to be zipping alongas fast as the technology itself. Formedin 2004 by the United States GeospatialIntelligence Foundation to meet thedemand for skilled GIS professionals, theAcademy was created to support lifelonglearning and professional developmentin the skills and competencies associatedwith Geospatial Intelligence.Through relationships and programswith educational institutions, theAcademy is working to develop at collegesand universities the USGIF accreditedprograms that lead to the awarding ofthe Geospatial Intelligence Certificate.Ultimately, the Academy aims to ensurethe GEOINT tradecraft’s continuance asa critical part of our country’s homelandand national security.Partnership: Education, Industry,and GovernmentSecurity has emerged as one directionthe field is going. “We have hadstudents in Egypt, S. Korea, Afghanistan,Bagdad—obviously people stationed inthe military,” saysSchuckman,whoadds that Penn Statedefinitely worked tocreate its GeospatialIntelligence Certificatewith the USGIF and a specific segment ofthe industry in mind. Penn State is in theprocess of developing an on-line programin Homeland Security to be rolled outin 2010. “More people are starting tobe impacted by the technology at thepersonal level—Google Earth imagery iseverywhere. People are starting to get anawareness of how individuals can becomeempowered to create virtual communitiesand locate things in time and space.This forever changes the way we solveproblems. It offers a revolutionary way ofsolving a problem,” she says.Indeed it is challenging for universitiesto try to keep pace with the informationrevolution, particularly in new areas suchas spatial statistics where there aren't verymany people who understand the topic,let alone who can teach it. The term refersto a variety of techniques, many still intheir early development, using differentanalytic approaches and applied in fieldsas diverse as astronomy and engineering.As it stands, spatial statistics currentlyis taught by only a very small group ofexperts within the (USGIF) Academy.Diana Sinton, who teaches GIS toundergraduate students and faculty atthe University of Redlands, suggests thatgaps exist in the way GIS is taught—andlearned—especially with regards to howexperts appreciate how non-expertsunderstand how software representsand models features and characteristicsof the natural and social world. Thisgap complicates the idea of mastering aGIS education because it questions morefundamental standards of geographiceducation today.“We are just beginning to understandhow non-experts extract meaning frommaps and images and to design cartographictechniques that can represent theuncertainty of spatial data,” says Sinton.“Think of a city map that represents buildingsalong a street grid. Then think of thedata set that represents the vast amount ofinformation about the buildings, and whateach XY coordinate represents on themap. One puts a whole lot of thought intodesigning the information that then getsreduced down to being a point on a map.”The emergence of Google Earth maybe complicating the necessary understandingof critical thinking regardingspatial information. Google Earthallows one to compare images, but itcannot do anything with those images,nor does it provide an ability to do realanalysis on the images.To be sure, technology is creating newcareer opportunities related to economics,health, climate, urban planning, nationaldefense, natural disasters, and homelandsecurity, to name a few. All of these fieldsare becoming highly interdisciplinary,offering unique ways of looking at theworld and solving problems. Goingforward, it is clear that universities mustbe sure that they see the forest for thetrees, and that industry must work handin hand with governments and educationalsystems in order to prepare presentand future skilled employees.imaging notes // summer 2009 // www.imagingnotes.com33
February 28 - March 3, 2010
X, Y & Z:TTFigure 1This model from an InteliSum project inManitou Springs, Colorado was created toverify how a new road design would affectthe existing buildings on the street.True 3DRod FranklinReporterDenver, Colo.and Ties to ROIThere’s a good chance you haven’t metZ. He’s easy to miss. In any room, Ztends to hang back. But George Bauerwants to introduce him to as manypeople as possible. Though Z’s visualizationskills may sound like fantasy, there is nomagic in his depth coordinate—only practical,useable data.As vice president of marketing for the Irvine,California company INOVx Solutions Inc., Bauerspends his days working the logistics of laserscanning and software configuration contractsfor companies that want to give 3D form to theirexisting physical plants–a trick Z’s depth coordinateshelp bring to the computer screen. Bauer’scustomers are the first-generation adopters of
2high-definition 3D virtualization, andthey’re using the technology to trimmaintenance routines, manage assets,heighten their awareness of surroundingdanger, and catalyze knowledge transferamong the employee rank and file.Players in the energy, chemical,food, construction and drug manufacturingsectors are crunching ledgernumbers that make Z’s presence lookmore and more like a worthy investment.As the oft-excluded member inthe full trio of X (width), Y (height)and Z (depth) coordinates that mustbe present in any algorithm to synthesizevisual space three dimensionally, Zcan be integrated into an oil refinery’sexisting information systems at pricesranging from $400,000 to $500,000for a single processing unit to severalmillion for an entire plant, Bauer says.Once Z is there, 2D pictures of cokingunits or heat exchangers morph intoalternate cartoon realities. Z lives whereverthe front of something turns graduallyinto the back of it–an essence thatmakes possible the study of componentsthat previously remained hidden withincomplex mechanical environments. Thiscapability is a benefit that can turn thecognitive intellect squarely on its ear. Infact, the overall result of Z’s impact onindustry promises to be a game-changingparadigm for those professional servicecategories in which visual acuity rankshigh. Of these, engineering is probablythe most natural beneficiary.A central question for the potential3D client is whether the technology canpull the weight of its own initial investment,and then some. If the answer isyes, a state transportation departmentmight be interested in hiring avendor like InteliSum Solutions Inc.,another Irvine firm, which specializesin LiDAR-scanned 3D modelingprimarily for highway contractors,plant operators, building managersand architects. Or, if the projected ROIlooks solid for a utility, earthmine Inc.of Berkeley, California, might get thecall to scan miles and miles of servicearea with its fleet of truck-mountedpanoramic stereo cameras.Promising returns on scanninginvestments have been easiest to justifyin capital-intensive industries. Theirphysical plants stand as the icons ofearly adopter 3D success stories. INOVxhas completed hundreds of scanningand software consultation projects,and counts among its clients giants likeShell Oil, Procter & Gamble, Dow, BP,Chevron and the U.S. Navy. Its literaturecites the following ROI figures:ººººººººmore than $1 million in corrosionmonitoring savings for ShellCanada;productivity increases of 25to 30 percent for thicknessmonitoring location inspectionteams working at a joint venturerefinery in Venezuela;a shorter engineering scheduleand 50 percent reduction inreworks, due to improveddesign accuracy and efficiency,at a ConocoPhillips refinerythat required new piping in acongested area;an estimated $10 million benefitin fire damage repairs at anotherplant after workers were ableto complete the job two weeksfaster than originally anticipated.Engineers assigned to the twistingmazes of pipe and pump that INOVxmodels for these organizations use asolution called RealityLINx to stoketheir talents to a level that is at onceboth analytic and intuitive. The software36imaging notes // summer 2009 // www.imagingnotes.com
ties 3D visuals into existing enterprisemanagement databases, operations andmaintenance software, CAD, and documentmanagement systems. This mergerhelps an employee combine his dataintensivereview of a factory subsystemwith the more visceral act of seeing it, andat all possible angles–a technical mashupof the human analytic process.The ability to “walk” through a plantfrom a workstation desktop, aided byvisual procedures embedded in 3D models,can result in leaner inspection and maintenanceroutines. INOVxquotes studies showingthat the combined effectThe overall result of Z’s impact on industrypromises to be a game-changing paradigm forthose professional service categories in whichvisual acuity ranks high.of such benefits can greatly reduce theeffort mechanics spend on maintenanceplanning and, in the process, can hikesubcontractor wrench time from 30 to 55percent. More time on the wrench leadsto quicker turnarounds. Fast turnaroundstranslate into increased plant availability,which leads to higher profits.Building a business case for 3D versus thetraditional 2D drawing and CAD approachactually begins on a basic level. Engineersat most plants should be able to list the topten mechanical systems that are the mostlogical candidates for 3D modeling. Thesecomponents would benefit from scanningfor the simple reason that an open view oftheir back side is something that employeeswould like to see on a frequent basis.When scoping out a plant for isolationpoints and clearance metrics,obstructed vision has always been aparamount issue. “It comes up a lot,”Bauer says. “In this case you can go tothe model query and say, ‘show me thenext available valve upstream.’”Utility substations stand as anothercategory that can fare well in this newworking dimension. According to a 2005paper by a Bentley Systems Inc. engineer,strong potential exists for cost improvementsin areas like substation site selection,design alternative evaluation, design automation,virtual walk-throughs, commissioning,communication with neighbors,operations, and maintenance. Without Z,these cost benefits are but a pipe dream.Figuring a leveraged ROI in support ofvirtualization has also been a fairly clearcutchore for architects and transportationexperts. InteliSum Inc. directs much of itsattention toward these markets. Its LiDARscanning services are based on the photomechanicalproperties of the InteliCamera,which is designed to capture informationin a way that allows for the comminglingof XYZ coordinateswith RGB colorvalues and GIS datainside individualpixels that have beenrendered “intelligent.”This comminglingproduces 3D pictures that double asthree-tiered datasets. See Figure 1.Shana Lindsey, director of research andbridge operations for the Utah Departmentof Transportation, has lauded InteliSum’sapproach as an effective alternative totraditional surveying. When her departmenthired the firm to model a bridge badlyin need of replacement, workers were ableto build the structure miles from its targetlocation, transport it and then install ina single weekend. Lindsey quoted a costsavings on the order of 75 to 90 percent,much of it owing to the higher accuracyof 3D over 2D drawings and consequentelimination of return trips to the field.The accuracy of 3D LiDAR has madeoil and gas customers as integral a partof InteliSum’s client base as they are forINOVx. According to InteliSum mediaand marketing specialist Kirk Edwards,CAD wasn’t enough for firms in Brazilthat contract to work for Petrobras, thenationalized oil company. Modeling withLiDAR to produce LD3 files and Intelipixelsthat can be poured seamlessly intoCAD systems has helped them reduce themargin of error inherent to the 2D drawingapproach. See Figure 2.WWFigure 2This is a screenshot of the actual instant 3Dmodel for a U.S. pumphouse that needed ascrubber replacement. By using the Instant3D Model, the engineer at InteliSum was ableto verify that the new scrubber would fit andconnect correctly in the existing environmentAny ROI analysis engaged to weighthe 3D option should account for bothshort-term and long-term cost efficiencies.Frank Algarin, InteliSum’s vice presidentof sales, says the initial expense forLiDAR scanning doesn’t seem so dear tothose clients who have seen how the Inteli-Camera can produce millions of referencepoints in the span of a day, as opposed tothe 200 or 300 points recorded per shiftin more traditional transit surveying.According to Algarin, LiDAR’s swiftermodality costs about $75,000 for ten daysof scanning–a fraction of the estimated$120,000 a company might spend for 30days of conventional surveying, followedby three weeks of post-processing. Thisamount of scanning is sufficient to cover100,000 square feet of a building or threeto four stories of a 500-square meter oilplatform. InteliSum’s fee also pays forpost-processing and a CAD deliverable.However, the more permanent ROI iswhere virtualization makes its real play.“When you’re looking back at ROI, itreally gets back to more information andbetter information when you’re conceivingyour design,” Algarin explained. “Then itstarts to escalate geometrically after that,as far as the savings. Because once youcollect your 3D drawings, they’re done.”INOVx has quantified this impact overa one year period. Its subject of study was a100,000-barrel-per-day refinery. Based onan annual cost of $100,000 per employeeand a conservative guess of 12.5 percentimproved productivity for each group of 60operations and engineering staff members,the ROI equation yielded an estimated$750,000 in yearly cost savings.Somewhere down the road, a companymay trick out its 3D datasets to model“what-if” scenario planning and find itselfdrawing additional returns in the process.Bringing a company’s procedural cultureimaging notes // summer 2009 // www.imagingnotes.com37
4to this point, naturally, will require thedevotion of some front-end time in theinterest of saving more later. “This is adisruptive technology,” says Bauer. “Youneed to re-engineer your work processesand work in a different manner.”Benefits may compound, once staffmembers have learned the software. Virtualizationcan help a training professionaltranscend intellectual biases that for yearshave compelled him to declare that adultlearning theory sits already at its theoreticapogee and isn’t going anywhere new soon.Or experienced workers may use the modelsinformally to convey knowledge in waysthat are happily symbiotic with the bent oftheir younger colleagues, who have grownup in a world that barks its endorsement of3the newest and glossiest technologies.Another type of ROI analysis considersthe value-added product factor. EarthmineInc. has focused on the nascentmarket for large-area 3D mapping, usingits panoramic stereo cameras to scanhundreds of miles daily at normal drivingWWFigure 3earthmine’s mobile stereo panoramiccollection system drives and scans hundredsof miles a day.TTFigure 4An application built on earthmine’s FlashViewer API that provides mapping andmeasurement tools shows the ferry building inSan Francisco with an inset satellite map.speeds for clients in government, utilitiesand online mapping. See Figures 3-4.Because the firm offers an end-to-endsolution for collecting, processing anddelivering point cloud data, its licensingfees take into account the multiple ways acustomer can use the information.On earthmine’s side of the transaction,ownership of the data remains intact andcontinues to draw revenue each time a newcustomer licenses it. “We want to build alarge data library of street information thatcan be shared amongst many stakeholders,”explains John Ristevski, one of the company’sfounders. “We’re definitely going forthe platform play.” On the customer side,data purchased from the platform for asingular purpose will cost less than databeing redeployed to many markets. Withearthmine’s application program interfaces(APIs), partners can produce a wide rangeof end user applications capable of pullingreturns in their own right.“If they’re creating derivative productsfrom our content, it’s priced at one tier,”Ristevski said. “If they are using it more asan interface, like in a local search Website,it is priced at another tier.”To varying degrees, the door is openingfor some new 3D modeling markets.Some of the most promising of these liein the realms of telecommunications, taxappraisal, public safety and emergencyresponse. InteliSum has been devotingmore time lately to building informationmodeling–that algorithmic hallucinationwhere architects turn cartoon corners anddescend cartoon staircases that aren’t yetbuilt–and reports a five-to-one ROI for itsmost recent project.From an investment perspective, otherapplications of 3D visualization may be alittle iffy. Because quick response planningtries to foresee the intangible, the technologycould find itself positioned as heroin one modeled disaster scenario, but a falseand costly prophet in another. For insurancecompanies, there’s the question of who–underwriter or beneficiary–ultimately paysfor the rendering process, and whether theincreased transparency it provides shouldinspire a trend toward lower premiums orbe used to clobber customers with highercosts. Finally, spokesmen for both InteliSumand INOVx say that the real estate sector,at least for now, views 3D modeling moreas a nice-to-have than an essential.Tired soldiers of the business wars willneed to be convinced that 3D visualizationshould not be consigned to the throwawaystatus of mere eye candy. What will becomemore evident to them over the next fewyears is the continuing cascade of superchargedpixels into our working world.To some, it does look a bit like fantasy.But those with down-to-earth experiencein visualization should be able to reassurethe would-be 3D customer that WaltDisney has left this particular room.Z told them so.38imaging notes // summer 2009 // www.imagingnotes.com
It’s not just a picture.It’s a pool of data.We capture and deliver the most image data. From Abu Dhabi or any location, look toGeoEye’s comprehensive imagery products and services for everything you need to receiveaccurate, timely and accessible location intelligence. Plus, our trusted imagery experts unlockeven more data with services like feature extraction and image classification. For the mostcomplete, most actionable image intelligence possible, choose GeoEye.Image intelligence. Delivered intelligently.www.geoeye.com/svc© 2009 GeoEye. All Rights Reserved.
Location in the Language of BusinessDiscover thedifference inperspectiveJoin LBx, a new resource forconnecting geospatial professionalswith business leaders3$79 95per yearmembership andsubscriptionwww.lbxjournal.com