download PDF - Imaging Notes
download PDF - Imaging Notes
download PDF - Imaging Notes
- No tags were found...

You also want an ePaper? Increase the reach of your titles
YUMPU automatically turns print PDFs into web optimized ePapers that Google loves.
Summer 2006Vol. 21 No. 2E x c l u s i v eThe UrgentNeed toMonitorthe Earth© 2 0 0 4 S p a c e I m a g i n g w w w . i m a g i n g n o t e s . c o mAssessmentsfor HurricaneSeasons p r i n g 2 0 0 4
S u m m e r 2 0 0 6 w w w . i m a g i n g n o t e s . c o m
See this image and the restof the world at GeoEye.You want to monitor 6,000 wind turbines from aremote location?With GeoEye, you can.GeoEye has the largest archive of commercial satelliteimagery in the world. And each day our constellationof satellites collects another 300,000 square kilometersof map-accurate high-resolution imagery.Turning imagery into results.See the world.www.geoeye.comw w w . i m a g i n g n o t e s . c o m>IKONOS | 1 meter resolutionS u m m e r 2 0 0 6
contents vol.21 no.2summer2006columns78101438Publisher’s LetterMonitoring the Earth: A New UrgencyPolicy WatchGlobal Transparency:The Times They Are A-Changin’Earth ScopeUdo’s World: Remote Sensing’s TransgenerationalResponsibilityNext-Gen MappingData without Borders: The Future of I/RSHindsight Guest EditorialIt Is the Best of Times, It Is the Worst of TimesBy Ron Eguchi, ImageCat, Inc.Exclusive Microsoft Story18 20w w w . i m a g i n g n o t e s . c o m32features1618202632LiDAR Technology atYour FingertipsIntroducing LiDARXCHANGE.comInfluencing Public OpinionAdvocating for Satellite Imagery in the Big CityBuilding a Virtual EarthHow the Vexcel Acquisition Contributesto Microsoft’s VisionHurricane Damage DataCollectionA Detailed Account from a First ResponderHurricane SeasonSensing Mother Nature’s Changing Moodss u m m e r 2 0 0 6
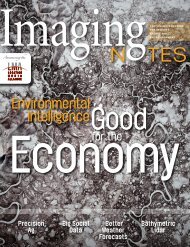
cover imageSummer 2006 / Vol. 21 / No. 2EditorRay A. Williamson, PhDray@imagingnotes.comPublisher/ M a n aging editorMyrna James Yoomy rna@imagingnotes.comCopy EditorBette MillesonA rt DirectorJürgen MantzkeEnfineit z LLCjurgen@enfineit z.comw w w.enfineit z.comColumnistsRay A. Williamson, PhDTimothy W. Foresman, PhDNatasha LégerCraig BachmannEditori a l Contributions<strong>Imaging</strong> <strong>Notes</strong> welcomes contributionsfor feature articles. We publish articleson the remote sensing industry, includingapplications, technology, and business.Please see Contributor’s Guidelines onwww.imagingnotes.com, and email proposalsto editor@imagingnotes.com.San Francisco, Calif.The city of San Francisco is on the cover of <strong>Imaging</strong> <strong>Notes</strong> because this cityis one that Microsoft has featured in its preview of Virtual Earth. In our exclusive cover storystarting on page 20, Microsoft tells the inside story on how Vexcel Corporation contributesto the plan and vision for Virtual Earth. This satellite image is accessible to Microsoft aspart of an agreement to incorporate GeoEye’s satellite imagery into Virtual Earth.In the center-left of the image is the city center. On the upper-right of the image isthe San Francisco-Oakland Bay Bridge (known locally as the Bay Bridge), which travelsnortheast over the San Francisco Bay as I-80. The bridge connects the cities of SanFrancisco and Oakland. It opened on Nov. 12, 1936, six months before the Golden GateBridge, the city’s other famous bridge going north into Marin County.This image of the city of San Francisco was taken on Aug. 28, 2004. It is an IKONOSimage, courtesy of GeoEye. This image had been rotated for optimal viewing.SubscriptionsTo subscribe, please go towww.imagingnotes.com, and click on‘subscribe.’ If you are a current subscriberand you need to update your address,please locate your account number onyour address label to enter the databaseand update your subscription.<strong>Imaging</strong> <strong>Notes</strong> (ISSN 0896-7091)Copy right © 2006Blueline Publishing LLCP.O. Box 11569Denver, Colo. 80211303-47 7-5272Although trademark and copyright symbols are notused in this publication, they are honored.<strong>Imaging</strong> <strong>Notes</strong> is printed on 20% recycled(10% post-consumer waste) paper. All inks usedcontain a percentage of soy base. Ourprinter meets or exceeds all federal ResourceConservation Recovery Act (RCRA)Standards. s u m m e r 2 0 0 6 w w w . i m a g i n g n o t e s . c o m
policy watchThe Times TheyAre A-Changin’Global TransparencyIn case you had not noticed, the worldof remote sensing information delivery ischanging rapidly. Once largely the provinceof experts trained in the arcane skillsof processing and analyzing imagery, nowremote sensing technology allows theaverage computer user to go online withGoogle Earth and search the world forimages of far away places with strangesounding names. Or, that same computeruser can search out an overhead image ofhis or her own home and neighborhood.As Google’s software and extensiveimagery database demonstrate, broadbasedtransparency, just a concept in the1960s and 1970s when only the UnitedStates and the Soviet Union operatedhigh resolution (but secret) satellites,is now a firm reality. This new globaltransparency, the ability to look in onneighboring countries and distant lands,is rapidly changing our perception of theworld by opening a view of regions onceoff-limits to inquiring eyes.According to some governments,that ability is just the problem. Officials incountries as politically diverse as SouthKorea, India, Australia, and the Netherlandshave complained to the media and to theU.S. government that Google Earth harmstheir national security by opening to publicscrutiny their secure national facilities, suchas air and missile bases. These countriesworry that someone, sometime, will use thatinformation to harm their security interests(see Figure 1).In many ways, the complaints of thesegovernments are much too late; the catwas already out of the bag nearly twodecades ago when the French launchedthe first of a series of SPOT satellites intoorbit and formed the quasi-private firmSPOT Image to market 10-m resolutiondata. First Russia and then the UnitedStates and Israel followed a few yearslater with commitments to sell even higherresolution data. Today, most people in theworld with sufficient cash or credit canjust order up the image they want, eitherfrom an American or a French firm.The growth in availability of sharp overheadimagery will not stop with these fewcountries. More than a dozen countriesnow operate digital optical remote sensingsystems, a number that willlikely more than double withinSee related story,‘Security Risks ofPublic Access toGeospatial Data’from the Fall 2005issue (Vol. 20,No. 3) at www.imagingnotes.com.the next decade. Althoughmost of these systemsnow collect only moderateresolution imagery, the trendtoward a proliferation of highresolution systems capable ofdelivering imagery quickly andefficiently is clearly evident.Further, engineers havemade significant progressin developing high resolution syntheticaperture radar (SAR) systems capable ofimaging through dark of night and clouds.Soon Canada will be marketing 3-meterdata from RADARSAT-2, and Germany,Italy and other nations are pursuingsimilar technology.Thus, the reality is that imagerytransparency is growing, not diminishing,despite complaints from some countriesabout the ready availability of some information.The dual-use nature of satelliteremote sensing means that countries willalways have concerns about its use. Likeother powerful technologies, the marriageof remotely sensed data with geographicinformation systems and advancedcomputing capabilities contains threateningas well as constructive elements.In fact, although the United States hasled the advance to ever higher resolutionand faster data delivery, its willingnessto foster greater global transparency isa relatively recent occurrence and onlyhappened after the collapse of the SovietUnion. Before then, the United Stateswould not allow the operation of civilsystems with resolutions better than 10meters. But diminished perceived threatsand the trends of technology developmentallowed new thinking that beganto see advantages in allowing greatertransparency by promoting growth in anascent U.S. remote sensing industry.The U.S. military, which was accustomedto greater protection from overhead satellites,has had to adapt to the new realitiesof transparency.Certainly, the same countries thatcomplain about Google’s ease of usewould think differently about the use ofthe same type of imagery torespond to a natural disaster.For example, satellite datawere used extensively in theimmediate aftermath of theAsian tsunami of December2004 and Hurricanes Katrinaand Rita in 2005. In the lattercases, only a few days afterthe hurricanes passed over,users could call up imageson Google Earth to inspectthe damage the storms had caused andto direct rescue efforts. Later, similarimagery delivered directly to customersby the imagery companies was used toassist recovery efforts.During the Cold War, the Soviet Unionand the United States used their secretremote sensing systems to keep a watchfuleye on each other. Such systems werecritical in helping to maintain stabilityand to avoid nuclear holocaust. Today, s u m m e r 2 0 0 6 w w w . i m a g i n g n o t e s . c o m
Figure 1 India’s Trombay-Bhabha Atomic ResearchCenter. IKONOS image courtesy of GeoEye.non-governmental organizations (NGOs)have used the imagery to cast light on thedevelopment of concentration camps inNorth Korea (see <strong>Imaging</strong> <strong>Notes</strong>, Summer2005, Vol. 20, No. 2), and on China’slimited nuclear capability (see <strong>Imaging</strong><strong>Notes</strong>, Winter 2006, Vol. 21, No. 1).Publishing such information openly allowsan independent view of developmentsand contributes to wider understanding ofactivities in other nations.Google Earth appears threateningto some because it is so easy to useand gives ordinary people the ability toview distant parts of the world. Yet, asw w w . i m a g i n g n o t e s . c o mcurrently used, Google Earth is primarilya display mechanism for imagery data. Aclose look at its capabilities reveals thatthe data are often too old to reveal recentactivities, with the exception of disasterresponse like that following HurricaneKatrina. Any person intent on harm wouldseek to obtain much more current data.Despite the complaints about theincreased transparency made possible byinformation technology and high resolutioncommercial satellite data, global transparencyis being more widely accepted, inlarge part because of the many uses of thetechnology to support and sustain society.In the future, look for even sharper imagery,faster delivery to the customer, and newways to display and use the informationsatellite systems provide.Ray A. Williamson is research professorof space policy and international affairsin the Space Policy Institute of The GeorgeWashington University (Washington, D.C.)and co-editor, with John C. Baker and KevinO’Connell, of Commercial ObservationSatellites: At the Leading Edge of GlobalTransparency (Rand and ASPRS, 2001).s u m m e r 2 0 0 6
Earth ScopeUdo’s WorldR emot e Sensi ng Com mu n ity’s Transgen er at iona l R esponsi bi lityThis January, a one-year-old boyfrom S. Korea named Udo was adoptedby a wonderful family in the U.S.A. He isa lucky young lad who beat the odds andwill be loved and nurtured and protectedto every extent possible by his new family.But in the increasingly dynamic world welive in, what kind of future will he face?It is becoming patently clear that theadults on our planet do not fully grasp thechanges that are rapidly manifesting allaround the globe, much less the impactsof these changes and the challengesthese impacts will create for Udo’s generation.This thought led to the fundamentalquestion of what we know about Udo’sworld and the conditions of the landscapethat will greet him as an adult. So it is thatwe should begin to consider further theissues of who should be held responsiblefor providing the information and trendsabout changes on the Earth’s surfaceand what might be done about raising theawareness of these extraordinary facts toour fellow citizens.So, what do we know about Udo’sworld? We have a good handle on thenumber of people living on the planetand the growth rate of the population.Allowing for some lack of precision inthe census numbers, we currently haveapproximately 6.5 billion people livingaround the globe, and the number isincreasing at a rate of 2.3 people persecond, or around 72 million per year(www.census.gov/ipc/www/popclockworld.html).In 1950, there were 2.5billion people. This exponential increasein population has had a profound impacton our environment. Both the rich andthe poor have been transforming theEarth’s surface through urban expansion,agricultural growth, forest reduction, soilexhaustion, and mineral and oil extraction.Tracking these transformations wouldprovide for true-cost accounting ofresource utilization, accurate valuationof national resource assets, and fullaccountability of development loans andhuman impacts on the Earth’s resources.Incredibly, we do not know with anyprecision just how much we have beenchanging the land surface. Let me repeatthis basic fact: The scientists and thegovernments of the world, and internationaldevelopment banks, do not knowhow much we have been transforming theland cover and surface of planet Earth. Asthe former head scientist for the UnitedNations Environment Programme, I amsharing with you this unassailable fact.The Millennium Ecosystem Assessment(MA; www.millenniumassessment.org) has performed an admirable job ofcomprehending and communicating theextent to which ecological goods andservices provide the life support systemsfor all humans. Living in our urbanizedenvironments or working in our sterilecorporate offices, we tend to forget thedirect dependency all humans have onthese ecological goods and services.These are not luxuries; these goodsand services are the foundations oflife, albeit not evenly distributed for thehuman population. Importantly, the MAcould not quantify the current amount ofecological goods and services nor theloss rates of these critical life-sustainingresources, as a result of the basic factpreviously mentioned: It all comes backto measuring and monitoring the Earth’ssurface—something that we could do, buthave not done.Why don’t we accurately measureand monitor the Earth’s surface? Landcover is not a principal indicator usedfor the policies and decisions that drivethe politics and commerce of our globaleconomy. Instead of using land cover asthe principal indicator, a host of proxieshave been created for reports and discussionsby major sectors. These include theWorld Banking community (World Bank,Asian Development Bank, Inter-AmericanDevelopment Bank, etc.); the UnitedNations community (FAO, UNDP, UNEP,UNESCO, etc.); the NGO community(Conservation International, The NatureConservancy, The World ConservationUnion, World Resources Institute, WWF,etc.); and United States agencies (CIA,State Department, US AID, etc.).10 s u m m e r 2 0 0 6 w w w . i m a g i n g n o t e s . c o m
Indicators are the rage among intellectualsand institutions always on the prowlfor refinement of the Gross DomesticProduct (GDP). At the extreme we haveBhutan’s King Wangchuk introducingthe Gross Domestic Happiness (GDH)index to measure development, althoughit would be imposed in a non-democraticfashion for his little Himalayan country.Amazingly, precise counting of whatis available on the Earth’s surface tosupport life and accurate defining ofour dependence on land cover are notforemost in any of the major indices andreports of commerce and policy wonks.Land cover should be foremost in ourlocal, national, and international dialogsas the critical factor regarding conditionsand trends on our world. Trained scientistscan diagnose a wealth of informationabout a geographic area through theassessment of remotely sensed data.And, much as a physician shares informationfrom an x-ray, a remote sensingprofessional can convey her diagnosisto a layperson by discussing the Earthimagery and the changes displayed in theimagery over time.If this is true, then what is theproblem? It is threefold:1. No synoptic and comprehensive measurementsare being recorded at theproper scales.2. No universal diagnostic kit, withstandard protocols, is available for allnations to utilize.3. No unified report is produced and sharedon the conditions and status of theEarth’s surface covering.So what is the role of the remotesensing community? I would suggest thatthe remote sensing community shouldhave the key role and responsibility forproviding the information and trendsabout changes on the Earth’s surface.Collectively, we should be the “primaryphysician” for all citizens and agenciesconcerned with the planet’s health. Weshould accept the challenge and raise thew w w . i m a g i n g n o t e s . c o mMonitoring the planet now is urgent for thesake of future generations like Udo’s.s u m m e r 2 0 0 6 11
Earth Scopeawareness of these extraordinary facts toall of our fellow citizens. Sadly, we havefailed in our role. We have not harnessedour potential to collaborate. We havedebated endlessly over the past 30 yearsIt all comes back to measuringand monitoring the Earth’ssurface—something that wecould do, but have not done.to distribute freely a global collection ofLandsat, AVHRR, and MODIS data. TheUniversity of Maryland’s fire monitoringand land cover change research hasdeveloped excellent templates for globalcollaboration. What is needed is the willto collaborate with other remote sensingcenters. Townshend’s team is monitoringphenomenal rates of land cover changes(deforestation) in Argentina, Boliva,Columbia and other South Americancountries, as well as large areas ofprofessional vocations to a collectiveeffort that will enable the world to begincalibrating and monitoring the elementsof our life support system? I would positthat this collective whole will not comeabout from any of the existing groups ofcommittees, and certainly not from anyknown government.Innovation, like the Internet, Googleand Microsoft must take the stand andbegin to harness the array of talentsand to network the centers that existaround the globe in order to accomplisha true physical view and accounting ofthe planet—an “Earth Scope”—in orderto provide a true and level playing fieldfor Udo’s generation before they inheritthe future. Anything less would be adisservice to the beautiful and wondrouschildren that are growing among us todayand an abrogation of our unique role asthe only qualified clinical monitors for theEarth’s health.with alphabet-soup committees (GEOSS,GTOS, GOFC-GOLD, GLCN, etc.) andstill have not produced one operationalreport that could be used to calibrate thecondition of the Earth’s surface and itstrends. This would seem to indicate thatwhat we are doing now is not working,and what we should be doing needs to beidentified and acted upon.Notable and noble examples ofworking models abound. Professor JohnTownshend, through the Global LandCover Facility (GLCF), in conjunctionwith the EROS Data Center, is attemptingWest Africa and Asian countries suchas Myanmar. Other excellent researchcenters are tracking hotspots or topicalareas of interest to their investigators orinvestors.But this represents a disparate set ofresource centers with hit-or-miss focus,and certainly is not a serious collaborativeeffort to provide a regular global censusof the Earth’s surface conditions — aclinical diagnosis of the planet.What can we do about this deplorablecondition in which we find ourselves?How can we apply our passions andDr. Timothy W. Foresman is Presidentof the International Centre forRemote Sensing Education. He hasbeen director of United NationsEnvironment Programme’s Divisionof Early Warning and Assessment(Nairobi, Kenya) and national programmanager for NASA’s Digital Earth(Washington, D.C.). He is editor of TheHistory of Geographic InformationSystems, 1998, Prentice Hall.12 s u m m e r 2 0 0 6 w w w . i m a g i n g n o t e s . c o m
w w w . i m a g i n g n o t e s . c o mS u m m e r 2 0 0 613
next-gen mapping[1]Data withoutBorders:The Future of I/RSCraig BachmannNatasha LÉgerITF Advisors, LLCDenver, Colo.www.itfadvisors.comIn this new column, we willbe bringing a different perspective toreaders on what we see as “Next-generationMapping.” Our focus is to explorenew forms of aggregated geo-data andthe uses of imagery and remote sensing(I/RS) and GIS beyond traditional customerchannels. We believe that I/RS is enteringa next generation of mapping applicationsbecause Moore’s Law has hit the geo-datacommunity in full force. Moore’s Law,simply stated as the doubling of computingpower and halving of the price every 18months, is forcing a change in businessmodels and in the cost, functionality, andavailability of geo-data. The evolution of newusers of geo-data and I/RS is most clearlyevidenced by media company Google’sFigure 1 The image shown on the CNN Website, taken byDigitalGlobe’s QuickBird satellite, identifies a mountainside anomaly,15,300 feet on the northwest corner of Mt. Ararat, in eastern Turkey,that associate professor and veteran national security analyst,Porcher Taylor believes to be the remains of Noah’s Ark.Figure 2 A poster advertising “An InconvenientTruth,” a Paramount Classics movie releasedirected by Davis Guggenheim, which opened in theU.S. on May 24, 2006, features a satellite image.[2]new use of geo-data in its service offeringGoogle Earth, Microsoft’s Virtual Earth, andmany others.New media is still the new buzz with over175 million global broadband users. Newmedia brings a fundamental shift in the waypeople communicate and share informationthat leads to an unprecedented level ofcollaboration-driven innovation. Pre-Internet,communication was constrained by a limitedaudience (think a telephone conversationbetween two people, not a conference call)and the ability of one party to control the informationbeing disseminated to many people(think broadcast TV). As the movement awayfrom the traditional constraints of communicationthat are involved in one-to-one andone-to-many exchanges, new media meansthat content shared or viewed by people isno longer controlled by a single party (thinkglobal R&D collaboration). 1 New media is themany-to-many model whereby almost anyoneoutside the traditional production chain ofa piece of content—be it a book, TV show,movie, video, or I/RS image—can “add value”to that content and create new business anddistribution models. New media creates anew decentralized environment that includesdata without borders.Once solely in the hands of earthscientists, military professionals, and largecorporate resource management organizations,I/RS data was considered thedomain of the highly trained expert. Userswere traditionally restricted by expensiveworkstations. Data sets required significantstorage. As a result, access to data, tools,and distribution was made available only toniche professional users.However, via the Internet, I/RS data hasbecome ubiquitous through news sites,blogs, Google Earth, ArcWeb, and similarportals. Figure 1 illustrates the use of DigitalGlobe imagery in a mass media article byCNN used to support historical researchin identifying the remains of Noah’s Ark.As I/RS increasingly is subsidized by newadvertising revenue models and journalists,consumption by new users will increase.Recently, consumers have seen more I/RSdata than ever before due to images andreports of the 2005 Asian Tsunami andHurricane Katrina, the 20th anniversary ofthe Chernobyl nuclear disaster, the war inIraq, pursuit of weapons of mass destruction,and terrorism. “An Inconvenient Truth,” themovie of the dangers of Global Warmingfeaturing Al Gore, is full of I/RS experts anddata. Promotions, such as the one for “AnInconvenient Truth” in Figure 2 rely on I/RSimages to drive the message. Remotelysensed data in this film demonstrates theintegration of once niche information inmainstream film entertainment. This hasall resulted in a newfound awareness andintegration of imaging and remote sensing.Google Earth has received much attentionfor providing what was once prohibitivelyexpensive satellite imagery for free (see Figure3). Offerings of several other companies,such as ESRI’s ArcWeb, and Terraserver.14 s u m m e r 2 0 0 6 w w w . i m a g i n g n o t e s . c o m
[3]com’s clearinghouse for imagery, alsoexpand the use of geo-data. These examplesare only the beginning, assuming this newportal approach follows other industries; notonly will new applications emerge, but newbusiness models will, as well. For example,Terraserver has established relationshipswith most of the commercial satellite imageryproviders and allows users to choose thesource and date of the image. At this time,free imagery appears to be used by thegeneral public as simply a nifty new application—“agee-I-can-zoom-in-on-my-house” kindof thing—and as news information. However,we can expect MSN Virtual Earth to presentsomething new due to Microsoft’s acquisitionof Boulder, Colo.-based Vexcel (see featurearticle on page 20).As broadband adoption rates continue torise around the world, the online world is nowone in which users of every type—students,professionals, academics, researchers,techies, concerned citizens, and hobbyists—developcommunities of shared interestsand therefore of shared data applications.As these examples illustrate, the Internetprovides a platform for “connecting manydots” for the multi-layers of I/RS, GIS, GPS,and field data. As geo-data professionalsknow, an inevitable demand for locationbasedviews and analyses arises from theability to be connected 24/7. From thebeginning, I/RS depended on technologicalinnovation to advance geo-data aggregationand integration: ERTS-1, MSS, Telsat, SPOT;then “arcs and info” overlaid on satellitephotography; polygon analysis applied toremote sensing data; GPS enabling moreaccurate, efficient field data capture; and lastmonth’s Russian launch of a remote sensingsatellite. With each innovation, a new globalset of users has emerged.New virtual communities no longerconstrained by accepted business practicesnow have access to I/RS as they participatein environmental and community-basedprojects that span drought control, conservation,climate change, natural disasters, andrecreational use of nature, to name just afew. For example, scientists traditionallyrelied on armies of students or contractors togather field information. Today, with a GPS,a mobile device, and an Internet connection,w w w . i m a g i n g n o t e s . c o many concerned citizen has the ability toprovide scientists with local geo-coded datathat can reduce significantly field data acquisitioncosts. As GPS has become availablein cars, on cellphones and on PDAs, it haspassed from the hands of professionals tohikers, campers, hobbyists, and kids doingscience projects. Everyone can participate inand use location-based services that includedigital I/RS data: this is truly data withoutborders.As we at ITF provide strategy to innovation-drivenindustries, one of our offeringsincludes scenarios based on economic,political, and social assumptions that driveplausible futures. Many of these scenariosinclude location-based services that utilizeI/RS. New wireless applications, globalization,and security all have inherent needs forI/RS in the future. New location services,from personal questions such as “Where aremy kids and family?” to traffic and 911 alerts,are developed every week, but what wehave found to be key new media drivers arethe rapidly growing online communities andaffiliation groups.In some cases these communitieswithout borders will collaborate andinnovate on issues that extend beyondgovernment’s presumed authorityover certain pieces of information andprojects. Online sharing of data of alltypes has begun the unforeseen demandof geo-data and will fuel the “long tail”of unique users. These new users willcollaborate in ways that blur the lines oftraditional private, public, and individualdistribution of products.Figure 3 Google Earth 3D screen shotshows the Colorado River in the Grand Canyon.1 Crosbie, Vin. 2002. What is New Media?,White Paper. www.digitaldeliverance.com/philosophy/definition/definition.htmlCraig Bachmann and NatashaLÉger are partners in ITF Advisors, LLC,an independent consulting firm with afocus on next-generation strategy and ontranslating the increasingly complex newmedia business environment’s impacton business models, markets, and users.Craig Bachmann was a pioneer in the useof GIS by utilities and communicationscompanies and has participated in manymilestones along the path of geo-dataaggregation. Craig Bachmann and NatashaLéger have combined their strategy andscenario planning expertise in the fields ofcommunications, utilities, mapping, publicpolicy, and international trade to providetheir clients with a dynamic, comprehensiveand innovative perspective on therisks and opportunities presented by thenew media environment. Natasha Léger isalso a published scenario-planning authorand an Adjunct Professor at the Universityof Denver’s Institute for Public PolicyStudies.s u m m e r 2 0 0 6 15
LiDAR Technologyat Your FingertipsIntroducing the World’s Largest LiDAR ResourceExchange MarketplaceAlejandra EspinosaDirector of MarketingIn collaboration with:Todd StennettPresident and CEOHeather AshenfelterKey Accounts ManagerAirborne 1 CorporationEl Segundo, Calif.www.airborne1.com3“The answer to that question is eBay…”That is what my boss said three years ago during the company’sannual strategic planning meetings. My boss: Todd Stennett, Presidentand CEO of Airborne 1 Corporation, a Los Angeles-basedprovider of LiDAR (a laser mapping technology known as LightDetection and Ranging). The question: “How can we radically improvevalue for customers shopping for LiDAR services?”“But an eBay-like Web site for just one seller? Wouldn’t that be alittle overkill?” I thought to myself. eBay (San Jose, Calif.) has becomea very successful company by building a network of 100 million buyersand sellers throughout the world. It seemed obvious to me thatin order to satisfy the huge demand for LiDAR services, Airborne 1would need the help of additional sensor owners across the industry.With a “LiDAR community” mindset, and seeking to enhancethe value proposition for LiDAR data and products to consumers ofthese services through an online marketplace, LiDARXCHANGEwas created. After three years of extensive research, market analysis,product development, and rigorous testing, LiDARXCHANGE.comwas launched this past February by a world-wide network of LiDARsensor owners, including Airborne 1.LiDARXCHANGE.com allows LiDAR and geospatial professionalsto post, view, rent, or buy available LiDAR system capacity andrelated resources online. The site also offers a low-cost solution that letsusers track the location of LiDAR sensors and aircraft across the globein real time, using a GPS-based tracking device developed exclusivelyfor LiDARXCHANGE called X-TRACKER, which sends locationand other information to the site via satellite. (See Figure 1.)Like eBay, LiDARXCHANGE seeks to benefit the buyer just asmuch as the seller. Buyers enjoy the convenience of a one-stop shop tobuy or rent LiDAR and related services or assets. Since all assets postedon the exchange board are arranged by region, buyers can select to workwith local providers, which will in turn result in better logistics as wellas cost savings in ferrying and other fees. Alternatively, they can shopfor the closest planned selected sensor at a selected date in the future.LiDARXCHANGE buyers can also post their needs for a specific asset,in case none of the items currently listed on the site meets their projects’16 s u m m e r 2 0 0 6 w w w . i m a g i n g n o t e s . c o m
Only a few months1after its launch inFebruary 2006,LiDARXCHANGE hasalready gatheredthe participation ofover 40% of the LiDARsensors in thecommercial sector.requirements. In addition, LiDARXCHANGE providesa user-friendly format for buyers with complex project arrangements,particularly for projects requiring multiplesensors, aircraft, and/or personnel. (See Figures 2 and 3.)Sellers find that LiDARXCHANGE provides aneffective forum for them to make their assets’ capacitiesavailable to a broader audience. With LiDARsensor prices ranging between $500,000 and $1.4million, keeping a high utilization rate for the Li-DAR system is vital. The site provides LiDAR systemowners with new revenue opportunities that help increasetheir sensors’ utilization rates, which wouldotherwise average a mere 10 to 20 percent annually.Resources such as digital cameras and GPS groundstations, as well as field operations and data processingpersonnel, can also be posted on LiDARX-CHANGE. The site can be viewed as a marketingplatform for companies to post their assets and Li-DAR services, allowing them to stay in full control oftheir pricing, the information that is displayed, andtheir online visibility, which can be turned on or offat the seller’s will.At times, a seller may become a buyer. LiDAR sensorowners often find themselves in situations where,due to logistical challenges such as bad weather, projectdelays, and equipment malfunctions, immediate accessto LiDAR sensor capacity is needed in order to replacetheir own. Finding a fast solution is critical in these situationsto avoid additional delays or the threat of overlapwith other projects. LiDARXCHANGE’s aroundthe-clockonline access provides the latest informationabout available sensor capacity, allowing users to findthe most expeditious solution to their problem.LiDAR companies that were previously spendingvaluable time flying sensors and equipment across theglobe for new projects can now use LiDARXCHANGEto buy capacity from the closest available sensor to theproject’s site. By increasing their revenues, reducingw w w . i m a g i n g n o t e s . c o mtheir costs, improving their productivity, and enhancingtheir competitiveness, LiDARXCHANGE enablessellers to get the most out of their assets.There are currently more than 120 LiDAR assetsworldwide — enough to gain logistical, industry-widecoordination, and to fulfill demand. Only a few monthsafter its launch in February 2006, LiDARXCHANGEhas already gathered the participation of over 40% ofthe LiDAR sensors in the commercial sector, making itthe largest fleet of LiDAR sensors in the world. Behindthe concept’s success are the participants who, alongwith Airborne 1, have had an essential role in creatingand refining the online exchange. LiDARXCHANGEparticipants hold a common belief that by sharing costsavings with the market, LiDAR players will collectivelydrive far higher and more stable collection andprocessing volumes throughout the industry.Interested parties can learn more about LiDARX-CHANGE by visiting www.lidarXchange.com and creatinga free user account. The site is under constant revisionfor the addition of new tools and mechanisms to enhancethe user’s LiDARXCHANGE experience. Feedback andquestions are welcomed at feedback@lidarXchange.com.This year’s strategic planning meetings are currentlytaking place. What will the boss think of next?Stay tuned!Figure 1 LiDAR-XCHANGE Asset TrackingPageFigure 2 LiDARSystem — OptechALTM3100 (Courtesy ofOptech Inc.)Figure 3 LiDARDigital Elevation ModelColor-Coded by Elevationof Hoover Dam,Colo., U.S.A.s u m m e r 2 0 0 6217
How toUnderstandandInfluencePublicOpinionA dvocat i ng for Sat elliteI m agery i n t h e Big C i t yDavid LogsdonExecutive DirectorSpace Enterprise CouncilWashington, D.C.www.uschamber.com/spaceIt seems so simple,really — promoting a product that is considereda media darling. One can tune in to thenightly news and come across a major newsstory for which commercial satellite imageryis utilized during the coverage. Generals relyon commercial satellite imagery in their dailyplanning, the nation’s farmers use the imageryfor precision agriculture, and thousandsof disaster management planners have incorporatedthe imagery into both their pre- andpost-disaster assessments. One would thinkthat advocating for such a product would bea cinch, but that is not necessarily the case.A lot of different actions need to be takenbefore true progress can be made. Here’s abird’s-eye view into the advocacy processfrom the standpoint of the U.S. Chamber ofCommerce Space Enterprise Council (SEC),describing how the SEC influences policy.The two driving forces of issuesmanagementFor as long as I can remember, the key toadvocating for an issue either within theFederal Government or on a local level isthe ability to tie the issue to two distinctconcerns: national and economic security.To put it bluntly, ‘fear’ and ‘greed’ sell onCapitol Hill and on Main Street. Frameyour issue within this context, and more oftenthan not, you will win the debate.How to reach out to the state,regional, and local businesscommunities: grass-tops lobbyingBecause the SEC is affiliated with theU.S. Chamber of Commerce, we have theunique ability to reach out to the entireAmerican business community to articulatethe relevancy of an issue. This can beaccomplished in many formats. For example,if we were hosting a forum at the U.S.Chamber of Commerce on the benefits ofcommercial satellite imagery for nationalsecurity, that forum could be Web-castlive to over 1,300 chambers, and could bepromoted through the chamber’s monthlynewsletter. Yet another way to reach a localaudience is through Letters to the Editorand Opinion Editorials placed in regionaland local papers. When these localbusiness leaders respond back to Congresson an issue, it is considered grass-tops lobbying.Infusing the grass-tops into actionis a major goal for the SEC.Figure 1 Agricultural use of land inWeld County, Colo. QuickBird satelliteimage courtesy of DigitalGlobe.18 s u m m e r 2 0 0 6 w w w . i m a g i n g n o t e s . c o m
Building business coalitionsA coalition is the lifeblood of issue advocacy.Issue coalitions enable minority intereststo build majority support. Coalitions allowdifferent interests to band together and atthe same time to maintain their separatepolicy agendas. While it is necessary toidentify and recruit ‘natural allies,’ doingso is only a first step. The more coalitionmembers reflect the same or very similarinterests, the less effective the coalition willbe. The most powerful coalitions representa broad range of interests that the publicand decision makers cannot ignore.Moving towards the building of coalitions,the SEC hosted two cabinet-secretarylevelevents in 2005 focusing on the synergiesbetween commercial satellite imageryand different sectors of American business.Our April program focused on the agribusinessindustry (see Figure 1) and our July programfocused on the energy industry. Thecouncil is aiming to create a sustainablecoalition with these and other business interestsin order to convince the public anddecision makers of the importance of commercialsatellite imagery to our national andeconomic security.Influencing events:use of the mediaThe public gets its information from themedia, but so do decision makers. The mediahas the ability to make news as well asto report it, and issue advocates can use themedia to influence policymakers. There’s asurefire way to make an agency respond,and that is to get them on the news. OurApril 2005 agribusiness and satellite imageryforum showcased keynote addressesfrom both Agriculture Secretary Mike Johannsand Senator Pat Roberts (a key memberof the Senate Agriculture, Nutrition,and Forestry Committee) and was coveredlive by CSPAN. Shortly thereafter, we weresuccessful in having language added to theagriculture appropriations bill in support ofcommercial satellite imagery.Persuading decision makers:working with the Executive BranchThe lynchpin that has driven SEC activityover the course of the last three years hasbeen the national commercial satellite remotesensing policy. The SEC was an instrumentalplayer in the drafting of the policy, workingclosely with the White House Office of Scienceand Technology Policy (OSTP) and theNational Security Council (NSC). The SEChad worked for many years cultivating relationshipsin both offices and the end resultwas a significant amount of SEC input thatwas incorporated into the national policy.Washington is all about relationship buildingand establishing trust.The road ahead for commercialsatellite imageryFor the commercial satellite imagery industryto move ahead, advances will have to bemade in the utilization of the imagery bythe United States government civilian agencies.Use of commercial satellite imagery bythe national security sector will continue togrow with the Future Imagery Architecture(FIA) program, though it is years behindschedule. The industry clearly needs to makeinroads both inside and outside the beltwayin order to create an impact with the civilianagencies. The SEC stands ready to assistwith this critical mission.The SEC was founded in 2000 to representbusinesses with a commercial interest inspace. Over the past five years, the Councilhas grown to represent all sectors of theindustry, including commercial, civil, andmilitary space. As a forum for space-relatedcompanies, the council brings the collectivepower of its affiliation with the U.S. Chamberof Commerce and its diverse members into asingle, unified voice that is used in advocatingmember interests to policymakers. TheCouncil’s primary focus is the unique connectionbetween space-based applications andour economy. The Council’s Executive Directoris David Logsdon and he can be reached atdlogsdon@uschamber.com.w w w . i m a g i n g n o t e s . c o ms u m m e r 2 0 0 619
How the Ve xcelAcquisitionContribute s toMicrosof t’sVisionBuilding a Virtual EarthDr. Bill GailDirectorJerry SkawMarketing Communications ManagerMicrosoft Virtual Earth Business UnitBoulder, Colo.www.virtualearth.comwww.vexcel.comThe multi-faceted technology of the Internet is rapidly transformingour lives. The ability to quickly search, find and share informationhas changed the way we operate at work and at home.Today, ‘geospatial’ is the hot word around the Internet. The newInternet services providing imagery of our communities and mapsaround nearly everything are a part of everyday conversation in businessand social settings. Internet search companies have come to recognize avery simple concept: information relevant to our everyday lives can benaturally organized and effectively searched, in a geospatial context.For the billions of consumers using the Internet, this is powerfulstuff. Bill Gates’ vision of the ‘geospatial’ Internet was unveiled thispast October during his 50th birthday speech in London: “You’ll bewalking around in downtown London and be able to see the shops,the stores, see what the traffic is like. Walk in a shop and navigate themerchandise — not in the flat, 2D interface that we have on the webtoday, but in a virtual reality walkthrough.”This new geospatial world is revolutionary for both consumers andbusinesses. A decade from now, people will be using geospatial informationin ways that are hard to imagine today. Those working in thegeospatial field now will play a central role in that transformation; personaland professional lives will be altered as a result. Gone are the dayswhen mapping was a quiet occupation — those in the geospatial fieldtoday are privileged to be at the heart of an information revolution.Microsoft® is dedicated to turning this image of the future intotoday’s reality. Bill Gates’ vision is not simply words. He has committedthe Microsoft resources and the creative team needed to accomplishthe vision. The result — Virtual Earth within WindowsLive Local (www.local.live.com) — is currently available as one elementof Microsoft Live, an initiative to make software and informationroutinely accessible as services through the Internet (see Figure 1).But this is only the beginning.120 s u m m e r 2 0 0 6 w w w . i m a g i n g n o t e s . c o m
2aVirtual Earth will ultimately become a virtual ‘world,’ collectingand organizing a wealth of information about Earth and the cities andtowns we have built on it. People will count on Virtual Earth in theireveryday lives for many things. They will use it to plan their travel andto visit places they might otherwise only dream of. They will play videogames using realistic representations of any city or town in the world.They will even be able to add content themselves, uploading imagesfrom mobile phones — a ‘living, evolving’ virtual world.Businesses will use Virtual Earth as a focused means to find andcontact the consumers who need their products most. Imagine makinga dinner reservation and routinely reserving a table based on ‘virtually’sitting at different tables to select the best view. Companies will improvethe efficiency of their operations by using Virtual Earth to access the latestweather and environmental information associated with their manufacturingand shipping activities. The government, a very large user ofgeospatial information today, will depend increasingly on Virtual Earthas the source for their custom application needs. Even the science communitywill employ Virtual Earth as the starting point for a wide rangeof scientific analyses and modeling. And it will help everyone to betterunderstand every last corner of the planet on which they live.The Virtual Earth vision is built on large volumes of high-resolutionimagery. With this in mind, Microsoft began establishing partnershipswith key imagery providers more than a year ago. On May 23, 2005,Microsoft and Pictometry International (Rochester, N.Y.) announced afive-year agreement to license Pictometry’s existing and new nationwideaerial images for use in Virtual Earth. Pictometry captures up to 12 viewsof land features in a given area, each at a different angle. This oblique imageryprovides Virtual Earth users with aerial views in a 3D-like manner,allowing them to see around objects within their search area of interest.Microsoft next partnered with ORBIMAGE (now merged withSpace <strong>Imaging</strong> to form Dulles, Va.-based GeoEye), announcing onJune 29, 2005, a 5-year agreement to incorporate the company’s globallibrary of high-resolution satellite images into Virtual Earth. At thetime the deal was signed, Microsoft had access to OrbView-2 and Orb-View-3 imagery. Now, Microsoft also has access to GeoEye’s IKONOSarchive and will have access to even higher resolution imagery fromGeoEye-1 when it is launched early next year.Microsoft then entered into a third five-year agreement. This time itwas with EarthData (Frederick, Md.), one of the largest U.S. aerial mappingcompanies. The agreement provides access to EarthData’s new andarchived LiDAR and radar data, as well as map production support.Microsoft’s commitment to Virtual Earth also goes beyond theseagreements to include acquisitions of companies chosen to round outinternal capabilities. On December 23, 2005, Microsoft announcedFigure 2a At the front end of the Vexcel fully digitalworkflow are the UltraCam-X and UltraCam-D largeformat digital aerial cameras, and the UltraScan5000precision photogrammetric scanner.Figure 1 Windows Live Local ‘street-side’feature presents imagery in a split-screen navigationwindow.In the upper navigation pane, users can tourtheir destinations through street-level imagery. In thelower navigation pane, users can alternate betweenthree navigation vehicles—race car, sports car, andwalk-by—for varied approaches to using location information.This screen shows San Francisco viewed froma sports car. Note that the image on the front cover ofthis magazine may also be used within Virtual Earth.w w w . i m a g i n g n o t e s . c o ms u m m e r 2 0 0 621
Figure 2bVexcel’s UltraCam-X captured this stunning imageryover Graz, Austria during overcast and rainy conditions.Figure 3The Vexcel UltraMap Server integrates with theUltraCam and UltraScan devices, easily ingesting aerial imagery. Witha robotic library and large disk space, data can be safely stored,archived and catalogued using spatial references for the imageheader. From there, Vexcel’s UltraMap WorkSuite delivers automatedand radically improved photogrammetric production.Figure 4Vexcel’s FotoG is the leading close-range photogrammetrysystem used to take precision measurements and create 3Das-built CAD models directly from photographic imagery. FotoG alsoallows users to apply photo textures to 3D building polygons displayedin the CAD environment, as pictured here.////Today, ‘geospatial’ is////the hot word around////the Internet.2bthe acquisition of GeoTango Corporation, a Torontobasedprovider of desktop and Web-based 3D geospatialvisualization and mapping products and solutions.Then, on March 15, 2006, Microsoft entered into anagreement to purchase remote sensing company VexcelCorporation. The deal was completed May 4, 2006.Why did Microsoft acquire Vexcel, and what rolewill Vexcel play? For over twenty years, Vexcel Corporationhas been a leader in imagery, photogrammetry, andremote sensing technology. Vexcel has long been knownfor its expertise in synthetic aperture radar (SAR). Morerecent prominence has arisen from the highly successfulUltraCam digital aerial mapping camera. Vexcel has135 full-time employees and is headquartered in Boulder,Colo. (with additional operations in Canada, Austria,the United Kingdom, and the Netherlands). As partof Microsoft, the company remains headquartered inBoulder and has retained all of its field offices. John Curlander,former CEO of Vexcel, is now General Managerreporting to Stephen Lawler, who is General Manager ofVirtual Earth. The vast majority of the current Vexcelteam continues to report to Curlander within the VirtualEarth team. Vexcel will also continue to develop, sell,and support its full line of products.Virtual Earth is central to Microsoft’s significant investmentin local search. The local search market is estimatedto be tens of billions of dollars annually. Microsoftis making a major bet that winning in local searchwill revolve around providing the best visuals and richest,most dynamic data that can be viewed and used in amapping and local geographical context.Vexcel’s experienced engineering team and rich set ofproducts and services will play a central role in helpingMicrosoft deliver on its vision to provide a dynamic, immersivedigital representation of the real world for VirtualEarth. Microsoft has an incredibly talented teamof people already working on this vision. To achieve thegoals for local search quickly, Vexcel was an obviouschoice to augment the team.Vexcel will contribute in the following three ways:The first contribution will be through its people. Vexcel’stalent pool, coupled with extensive experience in 2Dand 3D imagery, will be critical to delivering the most immersiveexperience possible on the Web. Vexcel will takethe lead in providing an automated imaging pipeline thatwill enable rich sets of aerial, bird’s-eye, and streetsideimagery to be delivered to consumer, commercial andpublic sector offerings in a much easier and more timelyfashion than is currently possible. Vexcel will also play acentral role in creating the ‘real world’ foundation that22 s u m m e r 2 0 0 6 w w w . i m a g i n g n o t e s . c o m
4enables new information and immersive mappingexperiences to be added continuously tomake Microsoft’s offerings as much like the realworld as possible.The second contribution will be through Vexcel’scurrent technologies, which will be importanttools for producing the richest, most dynamicsets of imagery and data in the world. Thesetechnologies support the Virtual Earth vision inthree key areas: photogrammetric mapping, radarmapping, and high-speed data handling.Photogrammetric mapping technology is thefoundation for much of the imagery in VirtualEarth. Over the last decade, Vexcel has becomea major supplier of photogrammetric products— including a full suite of products and servicesfor automated photogrammetric production.Strengthening this position in the mapping andGIS field, Vexcel introduced its UltraCam largeformat digital camera in 2003. It has been theleading digital aerial camera in sales for the pasttwo years. Along with Vexcel’s UltraScan5000precision photogrammetric film scanner, theUltraCam serves as a front-end collection device for Vexcel’s fully digitalphotogrammetric workflow (see Figures 2a and 2b).This workflow also features the UltraMap Server for archive, catalogand production management, and the UltraMap WorkSuite for automatedphotogrammetric production (see Figure 3). Rounding offits photogrammetry capabilities is Vexcel’s FotoG close-rangephotogrammetric software, which allows users to make measurementsand to create 3D textured models from imagerycaptured by digital, handheld cameras (see Figure 4).Vexcel has built its mapping and photogrammetric capabilitiesin support of the aerial photogrammetry market.Virtual Earth will drive a considerable need for aerial photogrammetryproducts and capabilities. Vexcel’s UltraCam andautomated photogrammetric workflow will play a fundamentalrole in meeting this need.Radar mapping technology will ultimately provide an importantcomplement to Virtual Earth’s optical imagery. Radarprovides information about the Earth that cannot be obtained byany other means. Vexcel’s innovative advancements in new syntheticaperture radar (SAR) image formation and processing technologiesinclude digital elevation models (DEMs), interferometry,tomography, shape-from-shading, and the ability to combine radarwith high-resolution optical data, to name just a few (see Figure 5).The company has also recently made advances in radar tag developmentand wireless field instrumentation. Vexcel’s radar capabilities3w w w . i m a g i n g n o t e s . c o ms u m m e r 2 0 0 623
will provide the basis for new and innovative Virtual Earth content.Radar data will be used for the underlying DEM upon which all of VirtualEarth will be built. New spaceborne, aerial, and terrestrial radarsensors will fill gaps left by the limitations of optical sensors. Vexcel’scurrent radar software products will provide the basis for business-orientedapplications that leverage Virtual Earth to meet targeted businessneeds. Also, an ongoing robust radar R&D effort will supply new applications,many of which we can hardly imagine today.High-speed data handling technology underlies nearly every aspectof image acquisition. Vexcel’s expertise in this area comes frombuilding high-speed satellite data terminals (see Figure 6). The in-houseexpertise needed for these terminals spans data from reception and telemetryprocessing to precision product generation and image exploitation.The company has provided end-to-end, integrated, multi-satellitesystems to commercial and government customers needing real-timedata acquisition and efficient handling of large data volumes. Thesesame capabilities will be scaled up to real-time networks of sensors tostore and catalog vast information sources, as well as to process andpublish the information in real-time to Virtual Earth.Vexcel’s third contribution, though not least in the list of reasonsfor the acquisition, will be Vexcel’s experience with business in thegovernment sector. Vexcel has extensive experience working withgovernment contracts, providing solutions to geospatial problems ina broad set of areas for a range of customers. Microsoft is committedto expanding business in this sector, and Vexcel’s experience willplay a significant role.Since the Industrial Revolution, technological advances have consistentlyresulted in mainstream phenomena that impact our lives tothe extent that we wonder how we ever managed prior to their existence.The Internet is just such a phenomenon. Over the past 10 years,it has connected people from all over the globe, providing access to avast wealth of information by empowering individuals to share theirknowledge and experiences. It has created new business models, fromWeb-based businesses to Internet service providers to Web design and5aThe geospatial/////////////Internet revolution///////is destined to//////////////be the next wave/////////of the Internet;/////////////some day, we will///////wonder how we//////////managed without it.////6Figure 6 Vexcel’s ground station offeringsfeature the Proton TM high-speed, direct-to-disktelemetry processing system, supporting import andexport streaming data rates to 800 Mbps.24 s u m m e r 2 0 0 6 w w w . i m a g i n g n o t e s . c o m
5bFigure 5image processing technologies.Examples of Vexcel’s synthetic aperture radar (SAR)Figure 5a Perspective view of digital elevation model (DEM)created from Tandem ERS SAR data (copyright ESA) over NunavutTerritory, Canada.Figure 5b Interferogram showing speed of a glacier and thetopography of its constraining valley walls.development agencies: an entire newbusiness ‘ecosystem.’ It has acceleratedthe adoption of the home personalcomputer and is largely responsiblefor virtual work forces, home officesand telecommuting—the ability towork anywhere, anytime.The geospatial Internet revolutionis destined to be the next waveof the Internet; some day, we willwonder how we managed withoutit. At the heart of this revolutionwill be Internet Search Portals suchas Microsoft Virtual Earth, whichwill change the way we search andexplore our world, drastically reducingthe time necessary to gatherlocation-based information. Thetime-savings gained will make individuals,businesses and governmentagencies—particularly local lawenforcement, emergency preparednessand homeland security—moreefficient and effective. And, muchas the first wave of the commercialInternet created a business ‘ecosystem,’this new Virtual Earth-basedwave will as well.Vexcel’s technologies will becritical to this geospatial revolution,serving as Microsoft’s center of excellence,providing the best-of-breedimagery that will make up the VirtualEarth ‘real world’ framework. Indoing so, the company will continueto work towards enabling the visionthat many in the geospatial industryshare—the widespread availabilityand use of digital Earth informationto enhance society.w w w . i m a g i n g n o t e s . c o ms u m m e r 2 0 0 625
Challengingthe Odds ofHurricaneDamage DataCollectionA Detailed Account from a First ResponderDr. Beverley AdamsRemote Sensing Technical DirectorLondon, EnglandDr. J. Arn WombleWind EngineerLong Beach, Calif.ImageCat, Inc.www.imagecatinc.comShubharoop Ghosh of ImageCat,Inc. and Carol J. Friedland ofthe Louisiana State UniversityHurricane Center also contributedto this article.See several additionalresponders’ stories in relatedarticle on page 32.ven though it may be the most well-knownhurricane of recent history, Hurricane Katrina,which struck the U.S. Gulf Coast stateson Aug. 29, 2005, was only the third mostpowerful windstorm of the 2005 season. Itwas not Katrina’s power, but her storm surgethat caused catastrophic damage along thecoastlines of Louisiana, Mississippi and Alabama.After the levees separating Lake Pontchartrainfrom New Orleans were breachedby the surge, about 80 percent of the city wasleft flooded. All told, Hurricane Katrina wasresponsible for an estimated $75 billion indamages, and the deaths of 1,418 people.Countless relief organizations madethemselves available to help the impacted regionsusing an arsenal of advanced technologies.We at ImageCat have spent the pastfew years refining our portable VIEWS ®(Visualizing Impacts of Earthquakes withSatellites) reconnaissance and visualizationsystem to map and assess damage in theaftermath of major natural disasters suchas Hurricane Charley, the Bam Iran earthquakeand the Southeast Asian tsunami.By the time Hurricane Katrina hit, wecould draw upon our collective experienceand were well equipped to respond.We quickly realized that Katrina’s uniquecombination of certain circumstances createddramatic — but not insurmountable— challenges for mapping and assessingdamage. See Figure 1.Hurricane Katrina:Unique Among StormsIn terms of windspeed, Hurricane Katrinawas not a major event. Prior to reaching land,Katrina’s windspeed measurements indicatedthat maximum sustained winds exceeded170 miles per hour, making it a Category 5storm. But the storm weakened significantlyin the 18 hours preceding landfall, and thestorm had decreased to a Category 3, basedon sustained windspeeds. However, tremendousstorm-surge capabilities persisted fromthe storm’s prior Category 5 status.Hurricane Katrina’s landfall near theLouisiana-Mississippi border placed theMississippi Coast in the classically vulnerableright side of the hurricane. Windspeedsin New Orleans likely did not exceed Category1 or 2 levels. While the west side of thehurricane did experience lower windspeedscompared to the east, the particular locationof Lake Pontchartrain resulted in waterbeing pushed towards New Orleans, stressingthe miles of levees constructed to holdback the lake and the network of canals.Coupled with the below-sea-level elevationof the city, this situation proved disastrousas floodwaters poured into New Orleans.As a historic event, Hurricane Katrinawas devastatingly record-breaking. Certainly,it was quickly acknowledged as the costliestU.S. hurricane on record, causing billions26 s u m m e r 2 0 0 6 w w w . i m a g i n g n o t e s . c o m
Figure 1 VIEWS high-definitionaerial imagery acquired froman elevation of 5000 feet showsflooding as well as minor winddamage to roofs in New Orleans(HDV imagery from ImageCat).Figure 2 Radarsat-1 SAR imageof Hurricane Katrina approachingLouisiana and Mississippi on August28, 2005. This image showsthe surface of the sea within thehurricane (SAR imagery from MDACorporation).FIG 1FIG 2of dollars worth of damage. But Katrina wasalso characterized by the convergence of multiplehazards within a single event — includingflooding, windstorm, storm surge andlevee breach. The unusual combination ofthese hazards created challenges for performingrapid and widespread assessments of thedamage, and for preserving the perishabledamage characteristics for conducting futureresearch activities. Physical access to the areawas severely limited due to evacuation ordersor the obstruction of roads by fallen trees,high flood waters or collapsed bridges.In the wake of disasters such as HurricaneKatrina, the gathering of situationalinformation is a critical priority, since it providesdecision support to guide immediateresponse and long-term recovery activities.To conduct any accurate mapping efforts, weat ImageCat knew we would have to find away either to clear a path to the scene, or togather information about the damage usingother means.The Importance of Post-DisasterReconnaissanceReconnaissance activities aimed at uniformlyand consistently documenting damageconditions following windstorms areimportant for rapidly assessing damageand losses, understanding the effect of thesestorms on the built environment, evaluatingw w w . i m a g i n g n o t e s . c o mthe effectiveness of mitigation measures andgauging the progress of windstorm mitigationover time. With proper analysis andimplementation, such studies can help tolessen or eliminate the tragic consequencesof future windstorms and help with constructionand reconstruction efforts.However, a number of barriers to conductingcomplete and uniform surveys haveemerged in engineering-oriented investigationsof post-windstorm damage areas.These most notably include the inability to:Document the damage states of allbuildings in large areas, both rapidlyand in detail, before clean-up effortscommence;Examine and document the “pristine”spread of windborne debris, which isfrequently moved before investigatorsarrive at the damage scene;Access damaged areas isolated byeither law-enforcement agenciesor by natural causes, such as fallentrees, washed-out roadways and collapsedbridges;Rapidly screen large areas for relativelevels of damage, for informationto use in the strategic planning ofstatistically sampled damage surveys,especially in unfamiliar areas; andAssign consistent damage characteristicsto structures due to the biasesamong investigators.These types of barriers can lead to costlytime delays in assessing damage across a widearea and in strategically deploying emergency-responsepersonnel and supplies. Additionally,there is inevitably a loss of valuableinformation for long-term research that couldotherwise lead to improved understanding ofsevere wind effects on the built environment.Carol J. Friedland, a graduate researchassistant with the Louisiana State University(LSU) Hurricane Center, agrees that theability to gather damage data uniformly iscritical — but, she admits, it is often difficultto achieve accurate data from groundsurveys due to human error and naturalbiases. “Collecting data hour after hourin the aftermath of any major disaster createssignificant ‘damage fatigue.’ Seeing thesame damage over and over, we as humansare bound to make mistakes or miss criticaldamage characteristics. Also, wind and waterexperts ‘see’ things differently and maycatalog data with biases toward their specificexpertise.”The benefits of augmenting the conventionalground survey approach withs u m m e r 2 0 0 627
FIG4aFIG4bFIG 3Figure 3 Expert-interpretation-based flood limit (delineated in yellow) overlaid with the QuickBirdfalse-color composite image of New Orleans for September 3, 2005 (from which the flood zone wasderived), comprising enhanced and mosaiced tiles (QuickBird Imagery from DigitalGlobe).advanced technology, such as remote sensing,cannot be denied. The emergence ofremote sensing as an accepted source ofpost-disaster information can be tracedback to the Sept. 11, 2001 attacks on theWorld Trade Center towers, where remotesensing was widely deployed at GroundZero for situation assessment.Within the wind-engineering arena, HurricaneCharley, which struck the Gulf Coastof Florida in August 2004, marked the initialdeployment of satellite remote sensingcombined with ground truthing for perishabledamage assessment. In this instance,pre- and post-hurricane satellite imagerywas integrated within the technology-drivenVIEWS reconnaissance system and used torecord the damage state of more than 10,000buildings. The 2005 hurricane season sawthe implementation of remote sensing techniquesby risk modeling companies to helpgenerate initial loss estimates.Leveraging Reconnaissance fromPost-Hurricane KatrinaOn Aug. 30, one day after Hurricane Katrinamade landfall in Louisiana, we deployeda response team to the Gulf Coastregion, consisting of our own staff andresearchers from the MultidisciplinaryCenter for Earthquake Engineering Research(MCEER), with backing from RiskManagement Solutions (RMS). Our objectiveswere to perform rapid and widespreadassessments of damage at a per-buildingscale, and to preserve the perishable damagecharacteristics of this unique multi-hazardevent for future research activities.We overcame the challenges associatedwith Katrina’s multiple hazards by leveraginga variety of satellite and aerial imagingplatforms that enabled us to conduct thoroughand effective analysis of the damage.Our Post-disaster Damage Verification(PDV) team used an airplane to fly over theBiloxi, Miss. and New Orleans, La. regionsand record the devastation. Within 48 hoursof landfall, GPS-referenced, five- to 15-centimeterresolution imagery was acquired byairborne deployment of our VIEWS fielddata collection and visualization system.VIEWS integrates pre- and post-disaster remotesensing data with in-field observationsand provides a permanent, geographicallyreferenced record of the post-disaster scene.Geo-referenced high-definition videoand still photographs recorded the initialstorm flooding and subsequent overtoppingof the levees surrounding NewOrleans. Captured on Aug. 30, prior toeither cloud-free post-storm satellite orNOAA airborne coverage, the informationprovided the earliest known indicationof damage within New Orleans.In the days following the hurricane, remotesensing data from optical and radarsensors were analyzed in detail, providingresponse teams with a rapid and synopticview of the affected areas at the regional,neighborhood and individual-building level.Through expert interpretation, these datasetsyielded important information for disastermanagers concerning the nature, severityand extent of building damage at regionaland neighborhood scales throughout theGulf Coast region.LSU’s Friedland accompanied the ImageCatteam to conduct surveillance andcollect damage information in New Orleans.According to her, VIEWS provideda critical ability to gather Hurricane Katrinadamage data because the system isalways on. “Because VIEWS is continuouslyand systematically collecting data,it eases the strain of manually catalogingdata and analyzing it as we go along.”Also, Friedland says, VIEWS createsan accurate, unbiased record of thephysical situation that can be referencedon a computer screen hours, weeks — or28 s u m m e r 2 0 0 6 w w w . i m a g i n g n o t e s . c o m
FIG 5a FIG 5beven years — afterward. “The ability todigitally catalog data as a permanent recordwill no doubt lead to more accuratedamage assessments for many types ofdisasters, and will help speed the processof categorizing damage data for analysisand reporting purposes.” See Figures 2-3.Figure 4 Pre- and post-Hurricane Katrina Landsat-5 TM imagery was used to detect storm surge damagein Mississippi (Landsat imagery from USGS and NASA).Figure 5 NASA’s Landsat-7 30-meter imagery reveals flooding extent in New Orleans on August 30,2005. (NASA imagery from Jesse Allen with data provided by USGS EROS Data Center and Landsat ProjectScience Office at Goddard Space Flight Center).Data Variet y is FundamentalThe complementary characteristics of thedifferent remote sensing platforms, which includedoptical, radar and LiDAR, afforded usthe ability to view the damage from multiplevantage points: optical imagery allowed usto view the landscape as it naturally appearsto the human eye, radar gave us the magicalability to “see” through clouds and darkness,and LiDAR helped us visualize the varyingheights of terrain and water. Suddenly, ourpicture was complete and led to the rapid,thorough, and consistent assessment of thesituation.Our team used post-Hurricane Katrinaremote sensing images that span awide variety of spatial resolutions. Thespatial resolution of an image determinesthe ability to view individual features suchas buildings and bridges. It also affectsthe ability to monitor and assess damageconditions, and depends on the nature ofthe hazard itself — for example, flooding,wind pressure, and storm surge.w w w . i m a g i n g n o t e s . c o mPixel sizes of approximately 10 metersor smaller are necessary to discern thepresence and location of individual buildings,while much smaller pixels, on theorder of one meter or less, can distinguishdamage conditions of individual buildings,such as damage to roofs caused bywind pressure. Widespread flooding canbe detected and monitored using less-detailedmoderate-resolution imagery.In addition to spatial factors, spectralresolution influences the use and usefulnessof the data. Physical materials have differentreflectance values in different portionsof the electromagnetic spectrum, and sofeatures of interest, such as constructionmaterials, water, and vegetation, can beidentified by unique and distinguishingcharacteristics. The use of multispectralremote sensing systems is therefore criticalfor the separation of constituent materialswithin an image, and for the interpretationof images for damage assessment.While post-disaster remote sensing imagesaccurately capture damage caused by adisaster, pre-disaster coverage is extremelyuseful for establishing the “normal” situation.Pre-storm images provide a benchmark“no-damage” baseline for changedetectionoperations, comparing pre- andpost-storm images on a regional and/orper-building basis, which creates importantvalidation of damage-assessment results,particularly for moderate damage levels.For the investigation of Hurricane Katrinadamage, pre-storm satellite imageryfrom Landsat-5 and QuickBird providedthis important comparative baseline. RecentLandsat-5 imagery for the New Orleans areaand Mississippi Coast was accessed throughthe United States Geological Survey (USGS)disaster Web site, and an older scene collectedin 2000 was obtained from the StennisSpace Center Web site. DigitalGlobe’sQuickBird imagery, which had been collectedover the area in March 2004, created criticalcapabilities for comparing the landscapeand infrastructure of the Gulf Coast regionbefore and after the disaster occurred.LiDAR airborne imagery was availables u m m e r 2 0 0 629
FIG 6FIG 7Figure 6 Example of per-building visual assessment of wind-pressure damage. Colored symbols aresuperimposed on a NOAA aerial image, indicating the damage states of individual roof facets accordingto the Remote-Sensing Damage Scale (base image from NOAA).Figure 7 VIEWS field-reconnaissance data accessible via Google Earth. This image shows stormsurgedamage in Biloxi, Miss.Figure 8 This image depicting 3D-London TM provides detailed information about building shape,height, number of stories and footprint area. Courtesy of ImageCat.information about changes in urban vegetation,and about major changes in buildingconfigurations due to high-velocity floodwaters,which caused the displacement of entirebuildings. See Figure 6.From Satellites to Google to 3D Citiesfrom the NOAA and the USGS disasterWeb sites for use in flood-elevation mapping.NOAA aerial images acquired in 2004following Hurricane Ivan were available forsuch areas as Gulfport and Biloxi, Miss. Becausethe effects of Hurricane Ivan on buildingsin these locations had been so minimal,the post-event images also served as a set ofpre-storm data for Hurricane Katrina. SeeFigures 4 and 5.Neighborhood Damage DetectionWhile various sources of imagery havebeen used for decades to evaluate the environmentalimpacts of storms, the newestplayer in the field of post-disaster reconnaissance—high-resolutionsatellite imagery—has raised the bar in terms of the amountof visual detail typically available in nonairbornecollected datasets. While providingvisual coverage over large expanses ofarea, this imagery is fine enough in detail todepict damage down to the neighborhoodand individual-building level.High-resolution satellite imagery of NewOrleans, acquired by DigitalGlobe, becameavailable for analysis within days of HurricaneKatrina. The imagery was collectedon Sept. 3 and distributed to MCEER researchersat ImageCat on Sept. 4. A neighborhood-basedhigh-velocity flood-damageassessment for areas near the levee breacheswas performed using this dataset. Each ofthe levee-failure locations was identifiedusing expert interpretation of a pan-sharpenednatural-color composite of the imagery.Areas surrounding the levee failureswere inspected using the composite imageto extract information concerning the approximatelength of the breaches, and thelocations of flooded areas.For example, the east side of the 17thStreet Canal bordering Jefferson and OrleansParishes failed, causing high-velocityflooding in Orleans Parish on the east side ofthe canal, while Jefferson Parish to the westwas not affected. The imagery also revealedRecognizing the importance of promotingrapid and accurate post-disaster reconnaissance,MCEER and ImageCat researchershave, for a number of years, worked tostreamline information-gathering activitiesthrough the implementation of advancedtechnologies such as remote sensing. HurricaneKatrina heralded the benchmark deploymentof remote sensing for reconnaissanceplanning and damage-assessmentsupport in a unique multi-hazard context.Taking remote sensing technology leapsand bounds further were the launches ofInternet-based Google’s Google Earth andMicrosoft’s Virtual Earth. Immediately afterHurricane Katrina, Google Earth provideda publicly accessible vehicle for distributingfreshly collected satellite imageryas well as VIEWS ground-reconnaissanceinformation. More than 18,000 VIEWS imagesillustrating Katrina’s damage along theMississippi Coast, and more than 27,000images from New Orleans, were integratedinto Google Earth.Evacuated residents with access to an30 s u m m e r 2 0 0 6 w w w . i m a g i n g n o t e s . c o m
FIG 8Internet connection were able to viewpost-event images showing damage totheir neighborhood — offering an unbeatablemechanism for helping residentsunderstand the damage sustained by theirproperties before trying to return home.What’s next for the field of post-disasterreconnaissance? Our work is now emphasizingpre-disaster planning with the releaseof 3D-City, a series of 3D city models servingas tools for managing corporate riskswithin vulnerable urban and industrial environments.Offering a detailed structural renderingof buildings in a given city, 3D-City providesattribute information about building height,number of stories, and footprint area. Themodel can be visualized using popular onlineand off-the-shelf software packages includingGoogle Earth (see Figure 7), MSN VirtualEarth, VRML, ESRI’s ArcGIS 3D Analystand other common GIS applications, puttingcritical geotechnology data at the fingertipsof decision makers. First issued in April ofthis year representing the city of London (seeFigure 8), 3D-City takes a proactive approachto planning and preparing for potential disastersor other events impacting a city.Washington_ad1_3rdSquare.indd 15/22/2006 2:14:34 PMw w w . i m a g i n g n o t e s . c o ms u m m e r 2 0 0 631
S e n s i n g M o t h e r N a t u r e ’ s C h a n g i n g M o o d s / / B y R o d F r a n k l i n /32 s u m m e r 2 0 0 6 w w w . i m a g i n g n o t e s . c o m
F i g u r e 1 NOAA caught Rita’s eye in thisGOES-12 satellite image at 1-km resolution.Courtesy of NOAA./ R e p o r t e r / / D e n v e r , C o l o .w w w . i m a g i n g n o t e s . c o mSorting order from the ferocity ofsummer’s large tropical and sub-tropical storms is a developing art thatmerges human wit with quick response experience, remote sensing technologyand computer science. The events of 2004 and 2005 remindedthe imaging community of how severely hurricanes and tsunamis candestroy food and water supplies while completely obfuscating the ingressand egress by which first responders would logically hope to retrieve theimperiled, the wounded and the dead.During and after such tempests, image modeling geographers trytheir best to superimpose known reality onto the windy, dark canvassesof the moment. It isn’t an easy trick. Ask anyone who watched hurricanesKatrina and Rita storm ashore like a pair of enraged sister shrews whowere in no mood to accommodate any of the personnel in charge of GISnetworks or rescue efforts.Some who worked the front lines can remember all too well the illequippedstaging areas and the few stressed-out jurisdictional spittingmatches — experiences that made some already difficult situations evenmore so. In the months that have elapsed, they have had a chance toreview the massive body of logistical intelligence that was collected fromsatellites and aircraft, as well as to analyze the more human aspects ofthe rescue response.From a technical perspective, remote sensing’s contribution to lastyear’s efforts appears to have carried with it fewer technical glitches thansome other chores that were necessary in order to stage command posts,deploy rescue teams and distribute supplies. Pilots and air controllersexercised their common sense training when it came to flying withinproximity of Mother Nature’s hissy fits. If anything, they may have donetheir job too well: Large organizations like the National Oceanic andAtmospheric Administration (NOAA) collected more images than couldbe digested by the makeshift networks set up to process them.NOAA and 3001, Inc. (Fairfax, Va.) recorded so much imagery inthe days after Katrina hit the coast that software experts “didn’t reallyknow how to process it,” recalls Louis Demargne, director of corporatemarketing for EarthData International Inc.s u m m e r 2 0 0 633
Laboratory at Louisiana State University’s (LSU)Coastal Studies Institute in Baton Rouge, the betterestablished, proven technologies again proved theirmettle. What worked best for New Orleans were themultispectral modalities, although imagers had towait for the clouds to clear before they could gatherclean data. The radar data was very useful for mappingoil slicks.According to most accounts, companies and organizationsholding title to valuable stores of databanded together in a spirit of cooperation. RemembersWalker, “We got our radar imagery throughNOAA, and everybody that usually wants to selltheir imagery was willing to share it. I’m pretty surethat the big companies, once they see the light andthe scale of a disaster, they open up their libraries.”In pre- and post-storm analysis, some imaging technologieshave proven more useful than others. LiDAR,for example, relies on the physical distance of an airbornesensor to a reflective surface, and thus may beless helpful in situations where the modeler wants toquantify standing storm water on a volumetric basis sorational pump deployment decisions can be made.But new techniques are always coming to the fore.Jacqueline Mills, coordinator of LSU’s GIS Clearinghouse,said personnel working in the Lower NinthWard of New Orleans were grateful for the GPS-encodeddigital video system loaned by the NationalCenter for Geocomputation at the National Universityof Ireland. As window-mounted video camerasroll, the changing location of the vehicle can beHe isn’t exaggerating. On Aug. 31, NOAA postedmore than 350 aerial images of the decimated areabetween Bay St. Louis and Pascagoula, Miss. Thenext day it produced an additional 1,450 aerial images,including those picturing the mess Katrina hadmade of New Orleans. On Sept. 5, NOAA added another1,100 images to the repository.EarthData was called in to help strain variousdatasets in ways that could help rescuers delineatewhere houses and bridges had once stood. “Theytasked us to correct the mosaic and extract informationsuch as the debris line,” Demargne said.To deal with the exigencies of emergency logisticsplanning, the company generally favored colorinfrared imaging. “It’s a little bit easier to produce aland cover map,” Demargne explained. “We can calculatethe total amount of impervious surfaces andplug that into a hydrologic runoff model. What wedid is provide them with the basic information thatthey needed to run their models.”For Dr. Nan Walker, director of the EarthScanF i g u r e 2 Another satellite image showing Rita as itmade landfall. To the right is Florida, and to the left isMexico. (Courtesy of NOAA).traced onto a street network, greatly simplifying thechore of assessing damage, flood heights, and markingsfor search and rescue.“This type of geospatial technology could readilyreplace the manually intensive paper-only recordingapproaches of Red Cross damage assessment teams,”Mills wrote in a recent correspondence. “The obviousbenefit of this system is the speed and accuracyof data recording, and the dramatic reduction in humaneffort.”But flooding was by no means the all of it. When Katrinastruck, offshore oil platform valves and pipelinesacross a wide area in the Gulf region bent or snapped,fouling an estimated 534 square miles with crude oil,according to Skytruth (Shepherdstown, W.Va.), a nonprofitthat uses remote imaging to expand awareness ofenvironmental issues. Images Skytruth recorded on Sept.34 s u m m e r 2 0 0 6 w w w . i m a g i n g n o t e s . c o m
2 showed slicks over an area calculatedto host about 38,000 gallons of spilledoil. This estimate assumed that the slickswere just 1.1um (1/10,000th of a millimeter)thick, which is the lower limit for detectionon radar satellite images, so thisestimate is really a minimum.To get better estimates when mappingoil spills, fate/transport models(typically analytical solutions to simplifiedtransport equations) can beconceived to account for sea currents,temperature, turbidity and other factors.Skytruth founder John Amospoints to these exercises as good areasfor further research by specialists inthe thermal infrared and ultravioletspectrums.Skytruth images picturing lingeringoil several weeks after the stormsuggested that up to 100,000 gallonsof oil eventually were released fromleaking platforms and pipelines. Withlives and freshwater quality at stake,however, other emergency responsechores took precedence. Katrinatipped more than nine million gallonsof oil out of containers in and aroundNew Orleans, creating a hazard moreominous than that which wafted overthe ocean’s surface. “The Coast Guardwas quite rightly throwing its energyinto those spills,” Amos said.F i g u r e 3 This satellite image showsthe dry areas of New Orleans in pink andflooded regions in blue (Courtesy of SPOTImage).These spills amounted to little morethan grease spots when compared withthe 11,000 square miles of Alaska waterspolluted in 1989 as a result of the ExxonValdez accident. “Back in 1989 therewasn’t a whole lot of geospatial technologybeing used on the Exxon Valdez oilspill,” recalls Leslie Pearson, emergencyresponse program manager for the stateDepartment of Environmental Conservationin Anchorage. “We didn’t evenhave an Internet back then. It was a realpiecemeal effort.” Remote imaging andGIS have allowed quick responders tow w w . i m a g i n g n o t e s . c o ms u m m e r 2 0 0 635
etter prepare themselves forocean oil spills of any size.When it comes to errantwater, there are roles reservedfor most imaging resolutionsat some point along the emergencyresponse timeline. TheSee related storyof hurricaneresponse byImageCat, Inc. onpage 26.IKONOS satellite owned by GeoEye of Dulles, Va., forexample, was able to document the extent of damagealong the coast of Sumatra from the Indian Ocean tsunamiin late 2004 — information that was put to usefor purposes of initial response planning.“That imagery was quickly made available to the U.S.government, and some of it was released to the media,”said Mark Brender, vice president of communicationsand marketing. “It really provided a contextual assessmentfor policymakers even before ground-level reportswere aggregated. You could see which airports still hadrunways. You could see how extensive the damage was,so you could gauge the level of the response.”As the imaged resolutions of flooded regions becomefiner in any scenario, with satellite work giving way toaerial imaging, and finally to land-based GPS, responsestrategies and equipment planning can proceed at scalestailored more realistically to real-world needs.Many of the lingering weaknesses in the technologyhave to do with human factors. Everyone remembersthe anger and helplessness reflected in the faces ofKatrina’s rooftop refugees. Some accounts have it thatthe mood in the staging areas was no less frenetic, withnetwork and computer hardware experts in crampedoffices tripping over the feet of GIS modelers, imagingspecialists, data miners and others as they all rushed toproduce maps and other logistical guidance.Amid such chaos, emergency managers are comingto understand the promise of moreformal operational and behavioralF i g u r e 4 Skytruth used existingdata to show the proximity of the storm protocols. Hurricane Katrina: GISto undersea oil pipelines (Courtesy of Response for a Major MetropolitanSkytruth).Area (www.colorado.edu/hazards/qr/qr180/qr180.html) was a postmortemcritique authored by several LSU faculty whoworked the storm. It identified data organization and access,chaotic working environments and request trackingas the three areas most in need of improvement.The report concluded as follows: “Two of the mainfindings that can enable greater efficiency in GIS responseto a similar disaster are the need for 1) a specific responseplan that includes the use of volunteers early in the responseand designates these people well before a disaster;and 2) digital and paper copies of existing products forstandard requests, such as road maps for the impactedareas, which save time, money, and personnel from duplicatingefforts on a product that is already available.”On a wider level, it remains to be seen if and whenthe remote imaging and GIS industries will shake handsin a serious way with the media. While the drama of thelone reporter standing amid sheets of rain while dodgingassorted flying detritus continues to sell, newer uses ofgeospatial data are beginning to tease the idea of moredetailed and practical reportage. How many viewers,for example, might opt to replace the reporter’s standupwith a graphic illustrating the proximity of nursing homeresidents living next to the clogged storm culvert at theedge of town, or the homes situated under the quakinglimestone-capped hilltop of saturated mud?Theoretically, imagers and data modelers could pooltheir hardware and expertise with that of television networksand meteorologists, cable networks and independentstations, which traditionally have been shackled bythe one-dimensional limitations of video to report storieswith graphic demographic data or image overlays.A few creative ideas have surfaced. During Rita,the Federal Emergency Management Agency (FEMA)mapped the projected storm path to concentrated populationsof children under the age of five just north of thecoastline at the Texas-Louisiana border. Demographicswere also used to pinpoint additional at-risk groups inthe storm’s right-of-way, including populations of the elderlyand the incarcerated.As the technologies mature, remote sensing and imagingcan only add greater value to disaster relief dataaggregation. The areas that appear to need attention atthis writing include more formalized response protocolsand more widespread implementation of imaging techniquesthat allow responders to gauge the severity of astorm’s damage at ground level in a timely manner.36 s u m m e r 2 0 0 6 w w w . i m a g i n g n o t e s . c o m
hindsight(continued from page 38) helping tomitigate the effects of these disasters.The 2004 Indian Ocean earthquake andtsunami were among the first eventswhere satellite and airborne imageryof all types was being captured andstudied. For example, the commercialhigh-resolution satellite data providerDigitalGlobe captured and immediatelyIn the same way, a more rapidresponse after Hurricane Katrina— especially in understanding the extentof flooding in New Orleans and theinundation areas along the Mississippi— could have provided a more realisticassessment of the needs and priorities inthe first few days and weeks after Katrinamade landfall. There were many usefulFirst responders must receive adequatetraining and education on howbest to interpret and use this informationfor response and recovery.Damage detection methodologiesmust be more robust. That is, theymust be able to work with variouslevels of data resolution or sensortypes. In the ideal case, data fusionshould be emphasized, or at the veryleast, conclusions should be drawnbased on independent assessments.More emphasis needs to be placedon integrating simulation technologies(models that predict damage orimpacts) with post-event imagery anddata. Using simulation models as aninitial a priori estimate of impacts andrevising or calibrating this estimatebased on real, post-event data willlikely lead to the more accurate assessment.released images of the tsunami wavetrain hitting the shores of Sri Lanka. Also,spectacular before and after images ofBanda Aceh showed very clearly to theworld the level of devastation that hadoccurred in this event. Had these types ofimages been captured for all areas alongIndonesia, Thailand, India and Sri Lankain the first few days after the earthquake,a much better situational assessmentcould have been made and, perhaps,could have assisted in providing a morerapid and coordinated response to thosemost severely affected areas. This morerapid response would not have saved themajority of individuals who were killedin the tsunami, but it definitely wouldhave alleviated much of the suffering andperhaps some of the lingering healthissues that occurred weeks and monthsafter the disaster.w w w . i m a g i n g n o t e s . c o mimages of these areas — and many takenvery quickly after the initial onslaught ofthe hurricane. However, these imagescould have been more useful if they weregeo-referenced to be more compatiblewith GIS systems.We certainly have not seen the last oflarge natural catastrophes, and we certainlywill not abandon the development anduse of advanced technologies for disasterresponse. However, in order for these technologiesto be effective in responding to thenext wave of disasters, they must addressthe following issues or requirements:First-responders and those individualswho provide technical support tothis group must have timely access toall images collected after the event.This is especially true for sensorsoperated by all levels of government.We need to work towards online solutionswhere post-event imagery andany analyses of the event are postedon the internet and as close to realtimeas possible. This way, a muchlarger audience will have access tothis information, which will also helpwith response in many ways.We must document our successesand failures with respect to the useand adoption of these technologies inevery event, so that we can continueto improve the application andimplementation of new and advancedtechnologies for disaster response.Finally, more government support isessential— especially in the researcharea — to design, develop and testmethodologies, systems, platforms,and other components, so that robustdisaster response tools can be developedand deployed throughout theU.S., as well as around the world.s u m m e r 2 0 0 6 37
hindsight [ g u e s t e d i to r i a l]It Is the Best of Times;It Is the Worst of Times“It was the best of times,it was the worst of times…” Thusbegins Charles Dickens’ novel, A Taleof Two Cities. Dickens might have beendescribing the information technologyexplosion that all of us have witnessedsince 9/11. How else do we describe theincredible push for new and advancedtechnologies, yet the failure to use thesetechnologies effectively to prevent orminimize the catastrophes that have sweptthrough the world in the past two years?Disaster experts around the world havecontinually warned governments and thepublic about the possibility of “worstcase”natural hazard scenarios and theiroverwhelming impacts. Yet, planning forthe occurrence of these events has fallenfar short of need. The large earthquakethat occurred off the coast of Sumatra,which resulted in one of the deadliesttsunamis ever recorded, was a painfulreminder that living in some of the mostdesirable areas of the world does haveits risks. We all have enjoyed the fun ofrestful visits to coastal resort communitiesall around the world, and we rarely thinkabout earthquakes or tsunamis interferingwith this enjoyment. Yet, they take us bysurprise. Before these events do occur,there should be adequate education foreveryone on what actions areappropriate, as well as aneffective warning system totrigger the right actions.Although predicted someyears ago, the disaster inNew Orleans after HurricaneKatrina was still a huge surpriseto many, including some keygovernment agencies. Whileone can argue that the calamitythat occurred was brought on by the “perfectstorm,” one cannot argue that the responseby key government organizations, as theyattempted to provide emergency support toRonald T.EguchiPresident/CEOImageCat, Inc.Long Beach, Calif.www.imagecatinc.comEmail Ron at rte@imagecatinc.com.New Orleans and to the other areas affectedby the hurricane, was timely or effective.Whether the emergency response systemwas taxed at all levels of government to apoint where it became dysfunctional will bea topic that will be discussed for many years.One can hope that such discussion willresult in significant changes that will preventthis type of catastrophic failurefrom occurring ever again.Proper use of geospatialtechnologies could have helpedalleviate some of the confusionand suffering of New Orleans’citizens, and, properly applied,these technologies can helpresponse teams to alleviate,and even prevent, the samekind of suffering in the future.In both of these events, there werebright spots that had to do with technologiesattempting to find some role in(continued on page 37)38 s u m m e r 2 0 0 6 w w w . i m a g i n g n o t e s . c o m
Join the digital revolutionIntergraph’s Z/I <strong>Imaging</strong> ® DMC ®(Digital Mapping Camera) deliversextreme geometric/radiometricresolution and accuracy for a broadscope of downstream applications.No other camera delivers large-scaleimages with such accuracy.Since the DMC provides panchromatic,full-color rgb, or color infrared imagesin one photo-flight mission, there isno longer a need for separate missions.For downstream production, customersare reporting 20 percent productivitygains or more. For post processingof the images, Intergraph has evenfaster solutions.See the DMC’s extreme resolution foryourself! Visit www.intergraph.com/dmc/for more information.Resolution. Performance.Productivity.Image courtesy of Kokusai Kogyo Ltd., Tokyo, Japan.w w w . i m a g i n g n o t e s . c o mIntergraph and the Intergraph logo are registered trademarksof Intergraph Corporation. Z/I <strong>Imaging</strong> and DMC are registeredtrademarks of Z/I <strong>Imaging</strong> Corporation. Other brands andproduct names are trademarks of their respective owners.S p r© i 2006 n g Intergraph / S u m Corporation, m e r 2 Huntsville, 0 0 6 AL 39 35824