Challengingthe Odds ofHurricaneDamage DataCollectionA Detailed Account from a First ResponderDr. Beverley AdamsRemote Sensing Technical DirectorLondon, EnglandDr. J. Arn WombleWind EngineerLong Beach, Calif.ImageCat, Inc.www.imagecatinc.comShubharoop Ghosh of ImageCat,Inc. and Carol J. Friedland ofthe Louisiana State UniversityHurricane Center also contributedto this article.See several additionalresponders’ stories in relatedarticle on page 32.ven though it may be the most well-knownhurricane of recent history, Hurricane Katrina,which struck the U.S. Gulf Coast stateson Aug. 29, 2005, was only the third mostpowerful windstorm of the 2005 season. Itwas not Katrina’s power, but her storm surgethat caused catastrophic damage along thecoastlines of Louisiana, Mississippi and Alabama.After the levees separating Lake Pontchartrainfrom New Orleans were breachedby the surge, about 80 percent of the city wasleft flooded. All told, Hurricane Katrina wasresponsible for an estimated $75 billion indamages, and the deaths of 1,418 people.Countless relief organizations madethemselves available to help the impacted regionsusing an arsenal of advanced technologies.We at ImageCat have spent the pastfew years refining our portable VIEWS ®(Visualizing Impacts of Earthquakes withSatellites) reconnaissance and visualizationsystem to map and assess damage in theaftermath of major natural disasters suchas Hurricane Charley, the Bam Iran earthquakeand the Southeast Asian tsunami.By the time Hurricane Katrina hit, wecould draw upon our collective experienceand were well equipped to respond.We quickly realized that Katrina’s uniquecombination of certain circumstances createddramatic — but not insurmountable— challenges for mapping and assessingdamage. See Figure 1.Hurricane Katrina:Unique Among StormsIn terms of windspeed, Hurricane Katrinawas not a major event. Prior to reaching land,Katrina’s windspeed measurements indicatedthat maximum sustained winds exceeded170 miles per hour, making it a Category 5storm. But the storm weakened significantlyin the 18 hours preceding landfall, and thestorm had decreased to a Category 3, basedon sustained windspeeds. However, tremendousstorm-surge capabilities persisted fromthe storm’s prior Category 5 status.Hurricane Katrina’s landfall near theLouisiana-Mississippi border placed theMississippi Coast in the classically vulnerableright side of the hurricane. Windspeedsin New Orleans likely did not exceed Category1 or 2 levels. While the west side of thehurricane did experience lower windspeedscompared to the east, the particular locationof Lake Pontchartrain resulted in waterbeing pushed towards New Orleans, stressingthe miles of levees constructed to holdback the lake and the network of canals.Coupled with the below-sea-level elevationof the city, this situation proved disastrousas floodwaters poured into New Orleans.As a historic event, Hurricane Katrinawas devastatingly record-breaking. Certainly,it was quickly acknowledged as the costliestU.S. hurricane on record, causing billions26 s u m m e r 2 0 0 6 w w w . i m a g i n g n o t e s . c o m
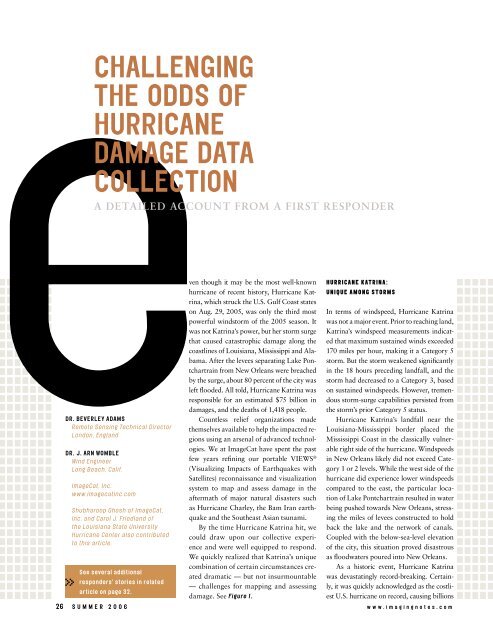
Figure 1 VIEWS high-definitionaerial imagery acquired froman elevation of 5000 feet showsflooding as well as minor winddamage to roofs in New Orleans(HDV imagery from ImageCat).Figure 2 Radarsat-1 SAR imageof Hurricane Katrina approachingLouisiana and Mississippi on August28, 2005. This image showsthe surface of the sea within thehurricane (SAR imagery from MDACorporation).FIG 1FIG 2of dollars worth of damage. But Katrina wasalso characterized by the convergence of multiplehazards within a single event — includingflooding, windstorm, storm surge andlevee breach. The unusual combination ofthese hazards created challenges for performingrapid and widespread assessments of thedamage, and for preserving the perishabledamage characteristics for conducting futureresearch activities. Physical access to the areawas severely limited due to evacuation ordersor the obstruction of roads by fallen trees,high flood waters or collapsed bridges.In the wake of disasters such as HurricaneKatrina, the gathering of situationalinformation is a critical priority, since it providesdecision support to guide immediateresponse and long-term recovery activities.To conduct any accurate mapping efforts, weat ImageCat knew we would have to find away either to clear a path to the scene, or togather information about the damage usingother means.The Importance of Post-DisasterReconnaissanceReconnaissance activities aimed at uniformlyand consistently documenting damageconditions following windstorms areimportant for rapidly assessing damageand losses, understanding the effect of thesestorms on the built environment, evaluatingw w w . i m a g i n g n o t e s . c o mthe effectiveness of mitigation measures andgauging the progress of windstorm mitigationover time. With proper analysis andimplementation, such studies can help tolessen or eliminate the tragic consequencesof future windstorms and help with constructionand reconstruction efforts.However, a number of barriers to conductingcomplete and uniform surveys haveemerged in engineering-oriented investigationsof post-windstorm damage areas.These most notably include the inability to:Document the damage states of allbuildings in large areas, both rapidlyand in detail, before clean-up effortscommence;Examine and document the “pristine”spread of windborne debris, which isfrequently moved before investigatorsarrive at the damage scene;Access damaged areas isolated byeither law-enforcement agenciesor by natural causes, such as fallentrees, washed-out roadways and collapsedbridges;Rapidly screen large areas for relativelevels of damage, for informationto use in the strategic planning ofstatistically sampled damage surveys,especially in unfamiliar areas; andAssign consistent damage characteristicsto structures due to the biasesamong investigators.These types of barriers can lead to costlytime delays in assessing damage across a widearea and in strategically deploying emergency-responsepersonnel and supplies. Additionally,there is inevitably a loss of valuableinformation for long-term research that couldotherwise lead to improved understanding ofsevere wind effects on the built environment.Carol J. Friedland, a graduate researchassistant with the Louisiana State University(LSU) Hurricane Center, agrees that theability to gather damage data uniformly iscritical — but, she admits, it is often difficultto achieve accurate data from groundsurveys due to human error and naturalbiases. “Collecting data hour after hourin the aftermath of any major disaster createssignificant ‘damage fatigue.’ Seeing thesame damage over and over, we as humansare bound to make mistakes or miss criticaldamage characteristics. Also, wind and waterexperts ‘see’ things differently and maycatalog data with biases toward their specificexpertise.”The benefits of augmenting the conventionalground survey approach withs u m m e r 2 0 0 627