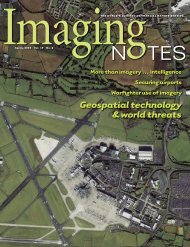
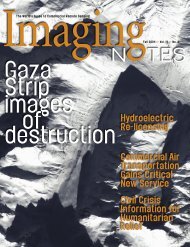
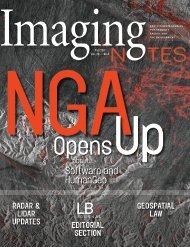
FIG 6FIG 7Figure 6 Example of per-building visual assessment of wind-pressure damage. Colored symbols aresuperimposed on a NOAA aerial image, indicating the damage states of individual roof facets accordingto the Remote-Sensing Damage Scale (base image from NOAA).Figure 7 VIEWS field-reconnaissance data accessible via Google Earth. This image shows stormsurgedamage in Biloxi, Miss.Figure 8 This image depicting 3D-London TM provides detailed information about building shape,height, number of stories and footprint area. Courtesy of ImageCat.information about changes in urban vegetation,and about major changes in buildingconfigurations due to high-velocity floodwaters,which caused the displacement of entirebuildings. See Figure 6.From Satellites to Google to 3D Citiesfrom the NOAA and the USGS disasterWeb sites for use in flood-elevation mapping.NOAA aerial images acquired in 2004following Hurricane Ivan were available forsuch areas as Gulfport and Biloxi, Miss. Becausethe effects of Hurricane Ivan on buildingsin these locations had been so minimal,the post-event images also served as a set ofpre-storm data for Hurricane Katrina. SeeFigures 4 and 5.Neighborhood Damage DetectionWhile various sources of imagery havebeen used for decades to evaluate the environmentalimpacts of storms, the newestplayer in the field of post-disaster reconnaissance—high-resolutionsatellite imagery—has raised the bar in terms of the amountof visual detail typically available in nonairbornecollected datasets. While providingvisual coverage over large expanses ofarea, this imagery is fine enough in detail todepict damage down to the neighborhoodand individual-building level.High-resolution satellite imagery of NewOrleans, acquired by DigitalGlobe, becameavailable for analysis within days of HurricaneKatrina. The imagery was collectedon Sept. 3 and distributed to MCEER researchersat ImageCat on Sept. 4. A neighborhood-basedhigh-velocity flood-damageassessment for areas near the levee breacheswas performed using this dataset. Each ofthe levee-failure locations was identifiedusing expert interpretation of a pan-sharpenednatural-color composite of the imagery.Areas surrounding the levee failureswere inspected using the composite imageto extract information concerning the approximatelength of the breaches, and thelocations of flooded areas.For example, the east side of the 17thStreet Canal bordering Jefferson and OrleansParishes failed, causing high-velocityflooding in Orleans Parish on the east side ofthe canal, while Jefferson Parish to the westwas not affected. The imagery also revealedRecognizing the importance of promotingrapid and accurate post-disaster reconnaissance,MCEER and ImageCat researchershave, for a number of years, worked tostreamline information-gathering activitiesthrough the implementation of advancedtechnologies such as remote sensing. HurricaneKatrina heralded the benchmark deploymentof remote sensing for reconnaissanceplanning and damage-assessmentsupport in a unique multi-hazard context.Taking remote sensing technology leapsand bounds further were the launches ofInternet-based Google’s Google Earth andMicrosoft’s Virtual Earth. Immediately afterHurricane Katrina, Google Earth provideda publicly accessible vehicle for distributingfreshly collected satellite imageryas well as VIEWS ground-reconnaissanceinformation. More than 18,000 VIEWS imagesillustrating Katrina’s damage along theMississippi Coast, and more than 27,000images from New Orleans, were integratedinto Google Earth.Evacuated residents with access to an30 s u m m e r 2 0 0 6 w w w . i m a g i n g n o t e s . c o m
FIG 8Internet connection were able to viewpost-event images showing damage totheir neighborhood — offering an unbeatablemechanism for helping residentsunderstand the damage sustained by theirproperties before trying to return home.What’s next for the field of post-disasterreconnaissance? Our work is now emphasizingpre-disaster planning with the releaseof 3D-City, a series of 3D city models servingas tools for managing corporate riskswithin vulnerable urban and industrial environments.Offering a detailed structural renderingof buildings in a given city, 3D-City providesattribute information about building height,number of stories, and footprint area. Themodel can be visualized using popular onlineand off-the-shelf software packages includingGoogle Earth (see Figure 7), MSN VirtualEarth, VRML, ESRI’s ArcGIS 3D Analystand other common GIS applications, puttingcritical geotechnology data at the fingertipsof decision makers. First issued in April ofthis year representing the city of London (seeFigure 8), 3D-City takes a proactive approachto planning and preparing for potential disastersor other events impacting a city.Washington_ad1_3rdSquare.indd 15/22/2006 2:14:34 PMw w w . i m a g i n g n o t e s . c o ms u m m e r 2 0 0 631