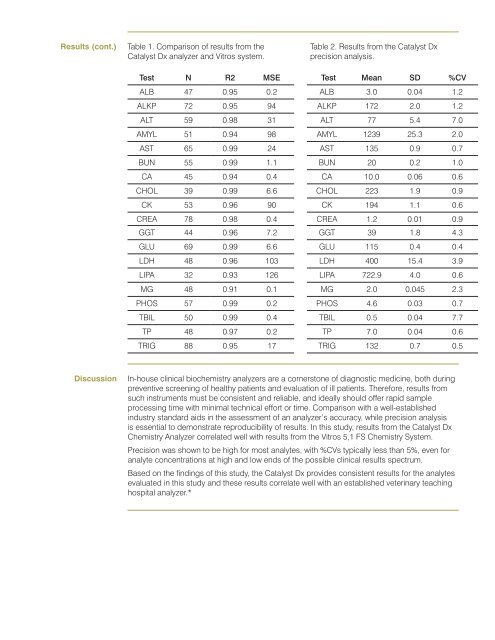
MethodsSamples: All patient samples were canine, feline, or equine serum or plasma that wasremaining after primary diagnostic testing at ei<strong>the</strong>r <strong>the</strong> Purdue University Veterinary TeachingHospital (PUVTH) or at <strong>the</strong> North Grafton <strong>IDEXX</strong> Reference Laboratory (<strong>IDEXX</strong>). InitialC for1 week after initial diagnostic analysis, thawed, and <strong>the</strong>n reanalyzed for <strong>the</strong> analyte <strong>of</strong>interest within 4 hours on both <strong>the</strong> <strong>Catalyst</strong> Dx and <strong>the</strong> Vitros 5,1 FS system. After <strong>the</strong>initial assessment, characterized clinical specimens from <strong>the</strong> PUVTH and <strong>IDEXX</strong> wereobtained to assure that sufficient spread over <strong>the</strong> complete dynamic range <strong>of</strong> each analytedays prior to analysis on both instruments, which was performed in <strong>the</strong> same manner. Allsamples were analyzed in <strong>the</strong> PUVTH by one author (W.D.S.) or an experienced laboratorytechnician, according to manufacturer instructions.Method comparison: Analytes for which method comparison was performed includedglucose (GLU), blood urea nitrogen (BUN), creatinine (CREA), phosphorus (PHOS), calcium(Ca), magnesium (Mg), total protein (TP), albumin (ALB), alanine aminotransferase (ALT),aspartate aminotransferase (AST), lactate dehydrogenase (LDH), alkaline phosphatase(ALKP), gamma glutamyltransferase (GGT), total bilirubin (TB), cholesterol (CHOL),triglycerides (TRIG), amylase (AMYL), lipase (LIPA), and creatine kinase (CK). For eachwhich included a broad range <strong>of</strong> results similar to those that might be routinely encounteredin healthy and ill veterinary patients. For each analyte, correlation plots were constructed,with calculation <strong>of</strong> <strong>the</strong> R 2 value and root mean square error.Precision analysis:multiple target concentrations <strong>of</strong> each analyte were selected in advance to represent low,“normal,” and high values for that test. For most analytes, two patient samples with resultsin close proximity to each target concentration for <strong>the</strong> analyte were selected, with10 replicates <strong>of</strong> <strong>the</strong> assay run on <strong>the</strong> <strong>Catalyst</strong> Dx analyzer. Mean, standard deviation, andcoefficients <strong>of</strong> variation (CV) were calculated for each precision run.ResultsMethod comparison: Correlation and bias plots for selected analytes that are commonlyevaluated using <strong>the</strong> <strong>Catalyst</strong> Dx analyzer are shown in Figure 1. These analytes and <strong>the</strong>irrespective R 2 ALKP (0.95), AST (0.99), GGT (0.96), BUN (0.99), LIPA (0.93), AMYL (0.94) and CK (0.96).PHOS (0.99), CA (0.94), Mg (0.91), LDH (0.96), TBIL (0.99), CHOL (0.99), and TRIG (0.95).Precision analysis: In order to determine <strong>the</strong> precision for each assay, means, standardcorrespond to results for each analyte expected to fall in a typical reference interval areshown in Table 2. CVs were also calculated for precision runs with target concentrationsexpected to be significantly outside a typical reference interval to ensure acceptablereproducibility at concentrations likely to occur in disease states. The majority <strong>of</strong> %CVs wereless than 1% and nearly all were 2.5% or less, which included all runs for ALB, ALKP, AMYL,AST, BUN, CA, CHOL, CK, CREA, GLU, LIPA, MG, PHOS, TP, and TRIG. Of those remaining
Results (cont.)Table 1. Comparison <strong>of</strong> results from <strong>the</strong><strong>Catalyst</strong> Dx analyzer and Vitros system.Table 2. Results from <strong>the</strong> <strong>Catalyst</strong> Dxprecision analysis.Test N R2 MSE Test Mean SD %CVALB 0.95 0.2 ALB 3.0 0.04 1.2ALKP 0.95 94 ALKP 2.0 1.2ALT 59 0.98 31 ALT 5.4 AMYL 51 0.94 98 AMYL 1239 25.3 2.0AST 65 0.99 24 AST 135 0.9 BUN 55 0.99 1.1 BUN 20 0.2 1.0CA 45 0.94 0.4 CA 10.0 0.06 0.6CHOL 39 0.99 6.6 CHOL 223 1.9 0.9CK 53 0.96 90 CK 194 1.1 0.6CREA 0.98 0.4 CREA 1.2 0.01 0.9GGT 44 0.96 GGT 39 1.8 4.3GLU 69 0.99 6.6 GLU 115 0.4 0.4LDH 48 0.96 103 LDH 400 15.4 3.9LIPA 32 0.93 126 LIPA 4.0 0.6MG 48 0.91 0.1 MG 2.0 0.045 2.3PHOS 0.99 0.2 PHOS 4.6 0.03 TBIL 50 0.99 0.4 TBIL 0.5 0.04 TP 48 0.2 TP 0.04 0.6TRIG 88 0.95 TRIG 132 0.5Discussionpreventive screening <strong>of</strong> healthy patients and evaluation <strong>of</strong> ill patients. Therefore, results fromsuch instruments must be consistent and reliable, and ideally should <strong>of</strong>fer rapid sampleindustry standard aids in <strong>the</strong> assessment <strong>of</strong> an analyzer’s accuracy, while precision analysisis essential to demonstrate reproducibility <strong>of</strong> results. In this study, results from <strong>the</strong> <strong>Catalyst</strong> Dx<strong>Chemistry</strong> Analyzer correlated well with results from <strong>the</strong> Vitros 5,1 FS <strong>Chemistry</strong> System.Precision was shown to be high for most analytes, with %CVs typically less than 5%, even foranalyte concentrations at high and low ends <strong>of</strong> <strong>the</strong> possible clinical results spectrum.Based on <strong>the</strong> findings <strong>of</strong> this study, <strong>the</strong> <strong>Catalyst</strong> Dx provides consistent results for <strong>the</strong> analytesevaluated in this study and <strong>the</strong>se results correlate well with an established veterinary teachinghospital analyzer.*