Planning for Sea Level Rise and Coastal Flooding - Virginia Institute ...
Planning for Sea Level Rise and Coastal Flooding - Virginia Institute ...
Planning for Sea Level Rise and Coastal Flooding - Virginia Institute ...

You also want an ePaper? Increase the reach of your titles
YUMPU automatically turns print PDFs into web optimized ePapers that Google loves.
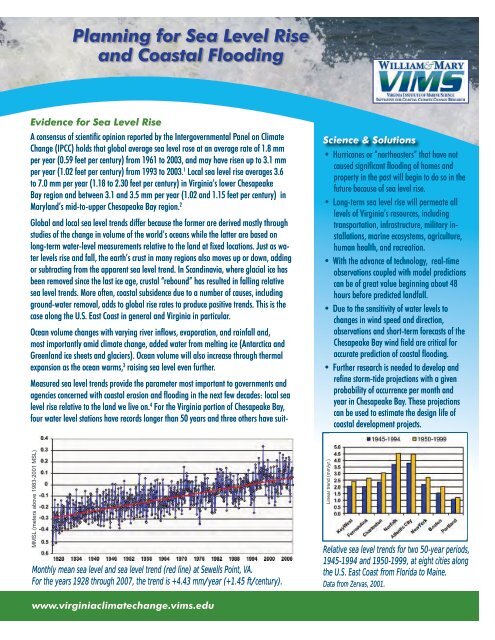
Whereas tidal predictions have long been essential to the mariner concernedwith safe navigation, waterfront property owners have little reason to beconcerned until water levels exceed the vertical limits of theastronomical tide <strong>and</strong> become “extratidal.”able records longer than 30 years. From the evidence these stations provide, local riserates are expected to be nearly twice the global rate, or about 4 mm per year, <strong>and</strong> mayprove to be as high as 5 to 7 mm per year. This equates to up to one foot (0.3 m) of sealevel rise, relative to the l<strong>and</strong>, by 2050.Consequences of <strong>Sea</strong> <strong>Level</strong> <strong>Rise</strong>The impact of sea level rise on coastal flooding is amply demonstrated by comparingHurricane Isabel of 2003 with another major storm: the hurricane of August 1933, widelyregarded as the “storm of the century” <strong>for</strong> Hampton Roads. The 1933 hurricane was morepowerful than Isabel <strong>and</strong> produced a storm surge (rise in water level due to the effectsof the storm) of 1.8 m (5.8 feet) as compared to 1.5 m (4.8 feet) <strong>for</strong> Hurricane Isabel inHampton Roads. Yet the maximum water level or storm tide (sum of the storm surge <strong>and</strong>the astronomical tide) <strong>for</strong> both storms was about the same: 2.4 m (8.0 feet) <strong>for</strong> the 1933hurricane <strong>and</strong> 2.4 m (7.9 feet) <strong>for</strong> Isabel. 5 The reason the weaker of the two storms producedan equivalent storm tide is that monthly mean sea level during Isabel stood about0.43 m (1.4 feet) higher than the monthly mean during the August 1933 hurricane. Mostof the difference is due to sea level rise during the 70 years between these two storms.Comparison of hurricane storm surge, storm tideat Sewells Point, Hampton Roads, VA, in feet above1983-2001 Mean Lower Low Water (MLLW).Northeaster of October 7, 2006, Gloucester Point,VA. Photo courtesy of Dr. David Forrest.Contingency <strong>Planning</strong>:Storm Tide Emergency ManagementAs the st<strong>and</strong>ard long used in the U.S. <strong>for</strong> coastal planning, the “100-year storm” can begrossly misleading without the necessary updates dictated by sea level rise. In addition,sea level rise expressed in mm per year is only an average; hourly, daily, <strong>and</strong> monthlysea level variations also affect flooding risk. Ongoing changes in sea level, both short<strong>and</strong>long-term, are important because they dictate the base water level <strong>for</strong> a stormtide—the storm surge in combination with the astronomical tide—to build upon asa major storm approaches the coast. Whatever else may happen, the situation will bemade worse by an elevated monthly mean sea level—a condition known in advancewhere water-level monitoring is active. As the storm arrives, chance again plays a partthrough the tidal range (spring or neap) <strong>and</strong> phase (high water, mid-tide or low water)that eventually combines with the surge delivered by the storm. This uncertainty, lastinguntil the final hours be<strong>for</strong>e the event, can be addressed through a combination of nearreal-time observations <strong>and</strong> computer models capable of predicting coastal flooding inthe near-term, tens of hours be<strong>for</strong>eh<strong>and</strong>.Sophisticated dynamic computer models developed at the <strong>Virginia</strong> <strong>Institute</strong> of Marine Science6, 7 have been used to simulate storm flooding at various locations within ChesapeakeBay <strong>and</strong> its major tributaries. Along with improvements in computer modeling, recentdevelopments include new technology such as airborne Light Detection <strong>and</strong> Ranging (LI-DAR) used to delineate coastal topography (i.e., l<strong>and</strong> elevation) with high precision, <strong>and</strong>high-resolution, short-term wind <strong>for</strong>ecasts generated by the National Weather Service.
Trust but VerifyClose agreement between measured <strong>and</strong> modeled flood levels allows confidence infuture model predictions. Accurate water-level measurements there<strong>for</strong>e go h<strong>and</strong>-inh<strong>and</strong>with model simulations. Web-based observational networks such as the NOAAPhysical Oceanographic Real Time System—PORTS (www.tides<strong>and</strong>currents.noaa.gov) <strong>and</strong> the VIMS TideWatch System (www.vims.edu/tidewatch) can be used to notonly verify past model predictions but to feed data to real-time modeling systemsduring an event. These techniques can also be used to answer questions that ariseduring post-storm evaluations:• Do certain areas, tributaries, or small embayments tend to experience storm tideflooding to a greater degree or more frequently than others?• Can risks be mitigated through improved planning or engineering?• Are water-level extremes increased or locally prolonged because of increasedrunoff from modified watersheds?Extratidal Water <strong>Level</strong>s<strong>Planning</strong> <strong>for</strong> coastal flooding requires new methods <strong>and</strong> metrics. Whereas tidal predictionshave long been essential to the mariner concerned with safe navigation, waterfrontpropertyowners have littlereason to be concerneduntil waterlevels exceed thevertical limits ofthe astronomicaltide <strong>and</strong> become“extratidal.” Thisoccurs at HighestAstronomical Tide(HAT), a tidaldatum commonlyused outside theU.S. By referencinga storm tideto the HAT datum,coastal planners<strong>and</strong> emergencymanagers will beable to isolate thatpart of the extremethat exceedsthe normal rangeof the tide.Hampton Roads inundation estimates under different sea levelrise scenarios. From Titus <strong>and</strong> Wang (2008) EPA.A VIMS microwave radar gauge measures waterlevels at Yorktown, VA. The device, unlike oldergauges with stilling wells, has no contact withthe water. Data is transmitted to VIMS through aNOAA Geostationary Operational EnvironmentalSatellite (GOES).Examples of extratidal high water <strong>and</strong> extratidal lowwater at Jamestown, VA during March 9 throughApril 7, 2008.Model-simulated inundation at Alex<strong>and</strong>ria, VA.
References Cited1 Intergovernmental Panel on Climate Change. 2007. ClimateChange 2007: The Physical Science Basis, Summary <strong>for</strong>Policy Makers. Contribution of Working Group I to the FourthAssessment Report of the Intergovernmental Panel on ClimateChange, Geneva, Switzerl<strong>and</strong>.2 Zervas, C. 2001. <strong>Sea</strong> <strong>Level</strong> Variations of the United States1854-1999. NOAA Technical Report NOS CO-OPS 36. NationalOceanographic <strong>and</strong> Atmospheric Administration, NationalOcean Service, Silver Spring, MD.3 Douglas, B.C. 2001. <strong>Sea</strong> <strong>Level</strong> Change in the Era of theRecording Tide Gauge. In: B.C. Douglas, M.S. Kearney <strong>and</strong> S.P.Leatherman (eds.). <strong>Sea</strong> <strong>Level</strong> <strong>Rise</strong>, History <strong>and</strong> Consequences.International Geophysics Series, Vol. 75, Academic Press.4 Zhang, K., B.C. Douglas <strong>and</strong> S.P. Leatherman. 2004. GlobalWarming <strong>and</strong> <strong>Coastal</strong> Erosion. Climatic Change, Vol. 64, No.1.5 Boon, J.D. 2005. Isabel’s Silent Partners: <strong>Sea</strong>sonal <strong>and</strong> Secular<strong>Sea</strong> <strong>Level</strong> Change. In: K.G. Sellner (ed.), 2005. HurricaneIsabel in Perspective. Chesapeake Research Consortium, CRCPublication 05-160, Edgewater, MD.6 Wang, H. V, Joe Cho, Jian Shen, <strong>and</strong> Ya Ping Wang. 2005. Whathas been learned about storm surge dynamics from HurricaneIsabel model simulations? In: K.G. Sellner (ed.), 2005. HurricaneIsabel in Perspective. Chesapeake Research Consortium,CRC Publication 05-160, Edgewater, MD.7 Shen, J, H. V. Wang, M. Sisson, W. Gong. 2006. “Storm tidesimulation in the Chesapeake Bay using an unstructured gridmodel”. Estuarine, <strong>Coastal</strong> <strong>and</strong> Shelf Science, 68 (1-2), pp. 1-16.8 Nyberg, J., B.A. Malmgren, A. Winter, M.R. Jury, K. HalimedaKilbourne, <strong>and</strong> T. M. Quinn. 2007. Low Atlantic HurricaneActivity in the 1970s <strong>and</strong> 1980s Compared to the Last 270 years.Nature, Vol. 447, No.7.9 National Oceanographic <strong>and</strong> Atmospheric Administration,2001. Tidal datums <strong>and</strong> their applications. NOAA SpecialPublication NOS CO-OPS 1, 111pp.Because tidal range varies from place to place, the level that separates “normal” from“above normal” varies as well. Thus extratidal high water, measured in either feet ormeters above HAT, provides a true measure of the flooding potential at all locationsregardless of tidal range. By documenting this measure precisely <strong>for</strong> more storms atmore locations, a better underst<strong>and</strong>ing of the flooding threat in <strong>Virginia</strong>—<strong>and</strong> theresponse required—will result. Graphs showing extratidal water levels <strong>for</strong> severallower Chesapeake Bay locations can be seen at www.vims.edu/tidewatch as they occur.Strategic <strong>Planning</strong>: Smarter Future Developmentin the <strong>Coastal</strong> ZoneEvidence suggests that hurricane activity has increased since 1995 after a quiet periodfrom 1971 to 1994. 8 But even without a major tropical storm or hurricane, extratropicalstorms or ‘northeasters’ that have not caused significant flooding of homes <strong>and</strong>property in the past will begin to do so in the future due to rising sea level. Affectedcitizens will pressure local government to “fix” a problem <strong>for</strong> which there are fewpermanent solutions—all of them complex <strong>and</strong> involving considerable cost to thetaxpayer. Smarter planning will see coastal managers <strong>and</strong> planners anticipating ratherthan simply reacting to these problems.Present planning <strong>and</strong> management concepts will be ineffective if they remain “static”<strong>and</strong> do not account <strong>for</strong> sea level rise. Tidal datums are periodically updated <strong>for</strong> thisvery reason as m<strong>and</strong>ated by national agreement. 9 An example of a static concept is the100-year flood, which stipulates the same 1-in-100 chance of a specified flood levelin any given year, whether now or a hundred years from now. While this concept mayserve present-day flood insurance purposes, it is of little use when planning <strong>for</strong> the lifeexpectancy of a coastal development: the number of years until the infrastructure isdeemed liable to partial or total loss from recurring flooding or becomes inaccessibledue to repeated flooding of roadway access.For further in<strong>for</strong>mation, visitwww.virginiaclimatechange.vims.eduor contact us atemail: climatechange@vims.eduPhone: (804) 684-7000Prepared ByJohn BoonHarry WangJian Shen<strong>Virginia</strong> <strong>Institute</strong> of Marine SciencePrinted on recycled paper. October 2008