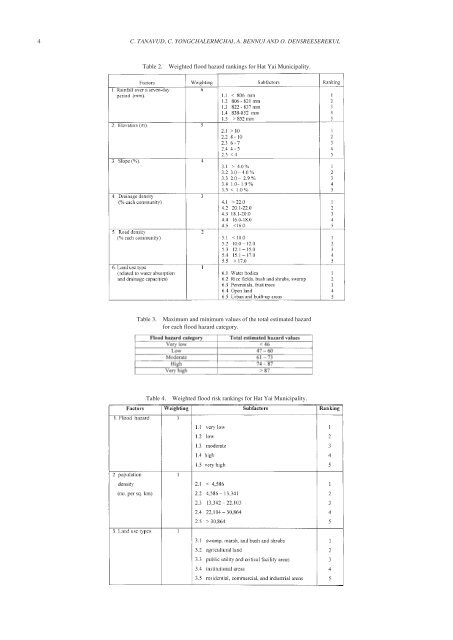
4C. TANAVUD, C. YONGCHALERMCHAI, A. BENNUI AND O. DENSREESEREKULTable 2.Weighted <strong>flood</strong> hazard rank<strong>in</strong>gs for <strong>Hat</strong> <strong>Yai</strong> <strong>Municipality</strong>.Table 3.Maximum and m<strong>in</strong>imum values <strong>of</strong> the total estimated hazardfor each <strong>flood</strong> hazard category.Table 4.Weighted <strong>flood</strong> <strong>risk</strong> rank<strong>in</strong>gs for <strong>Hat</strong> <strong>Yai</strong> <strong>Municipality</strong>.
ASSESSMENT OF FLOOD RISK IN HAT YAI MUNICIPALITY, SOUTHERN THAILAND, USING GIS5Table 5.Maximum and m<strong>in</strong>imum values <strong>of</strong> the total estimated <strong>risk</strong>for each <strong>flood</strong> <strong>risk</strong> category.Table 6. Land use changes <strong>in</strong> the Klong U-Taphao Bas<strong>in</strong>, 1982 to 2002.Table 7.Land use <strong>in</strong> headwater source areas <strong>of</strong> the Klong U-Taphao Bas<strong>in</strong>.Table 8. Changes <strong>in</strong> land use <strong>in</strong> the Klong U-Taphao Bas<strong>in</strong>, 1982 to 2002.Land use <strong>in</strong> 1982Land use <strong>in</strong> 2002Rice Forest Urban / built-upareasMiscellaneous Aquaculture Rubber Water bodies Orchards PerennialcropsMangrovesTotal (ha)4. RESULTS AND DISCUSSION4.1 Land use changesIn 1982, <strong>in</strong> the Klong U-Taphao Bas<strong>in</strong>, forests covered anestimated 48,281 ha, equivalent to 20.5 % <strong>of</strong> the bas<strong>in</strong>’s total landarea (Table 6). Over a period <strong>of</strong> 20 years, from 1982 to 2002,these forests were depleted by a total <strong>of</strong> 21,500 ha, equivalent to anannual loss <strong>of</strong> 1,075 ha (Figures 1 and 2). As a result, by 2002,forests accounted for only 11.4 % <strong>of</strong> the bas<strong>in</strong> (Table 6). Dur<strong>in</strong>gthat same period, the proportion <strong>of</strong> rubber plantation areas expandeddramatically from 150,218 to 172,130 ha, an annual <strong>in</strong>crease <strong>of</strong>1,096 ha (Table 6). In southern <strong>Thailand</strong>, such encroachment andconversion <strong>of</strong> natural forests to other uses has been attributed tothe expansion <strong>of</strong> agricultural land, illegal logg<strong>in</strong>g, and lack <strong>of</strong> publicawareness <strong>of</strong> the <strong>flood</strong> protection values <strong>of</strong> forests (UNDP,1994).The municipality’s land-use map, when overlaid with theheadwater source areas map, provided new <strong>in</strong>sight <strong>in</strong>to the status<strong>of</strong> land use <strong>in</strong> headwater areas. These types <strong>of</strong> environmentallycritical areas had been designated by the Watershed ClassificationSystem as “protected forest”, but <strong>of</strong> the 42,084 ha <strong>of</strong> headwaterareas, 17,116 ha, 42.7 percent, had already been converted to otheruses (Table 7). Indeed by 2002 or 42.5 % <strong>of</strong> the headwater areashad been converted to rubber plantation.Overlay<strong>in</strong>g the land-use map <strong>of</strong> 1982 with that <strong>of</strong> 2002revealed that a 21,912 ha <strong>in</strong>crease <strong>in</strong> rubber cultivation areas camefrom the conversion <strong>of</strong> 22,631 ha <strong>of</strong> forest area, 4,855 ha <strong>of</strong> ricefields and 2,513 ha <strong>of</strong> mixed orchards (Table 8). The dramatic